Worried about missed errors, message delays, or downtime? Atatus makes Kafka monitoring simple by unifying logs, metrics, and traces into one platform. Prevent failures, optimize performance, and keep your clusters running smoothly.
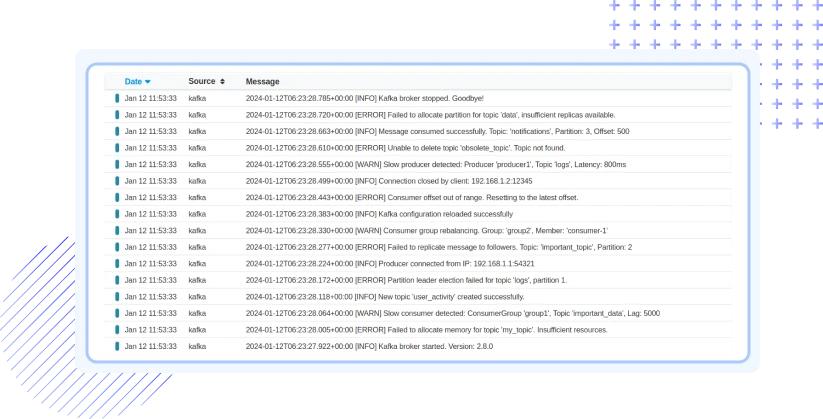
Get Started for FreeRequest DemoStop chasing errors across scattered files. Atatus captures all broker, producer, and consumer logs in one place, making Kafka monitoring and logging effortless. Trace issues, resolve incidents quickly, and reduce downtime dramatically.
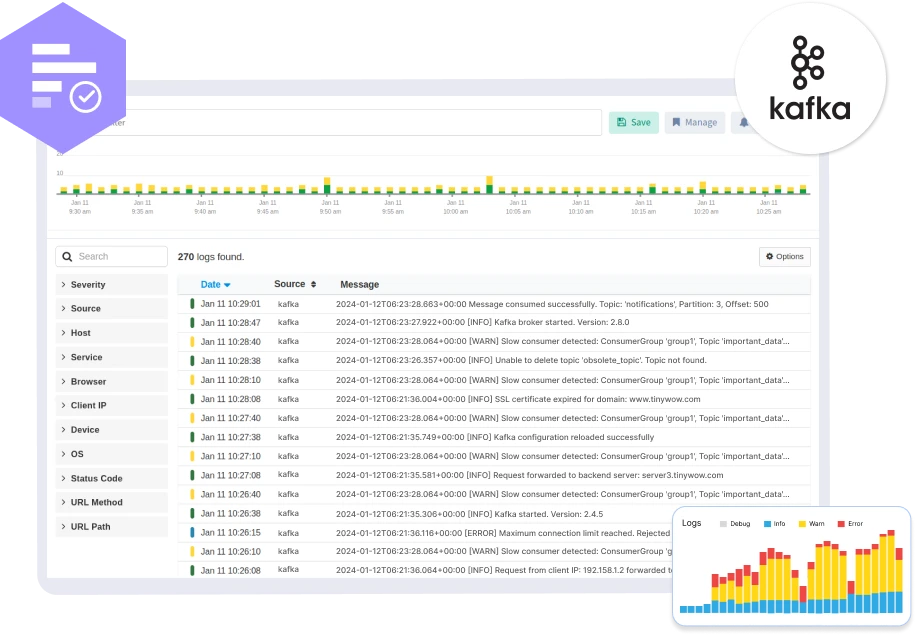
Explore Kafka LoggingTrack key metrics like consumer lag, partition health, throughput, and disk usage in real time. Atatus transforms raw data into insights you can act on, making Kafka metrics monitoring easier than ever.
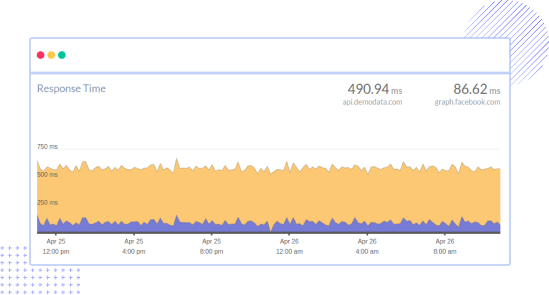
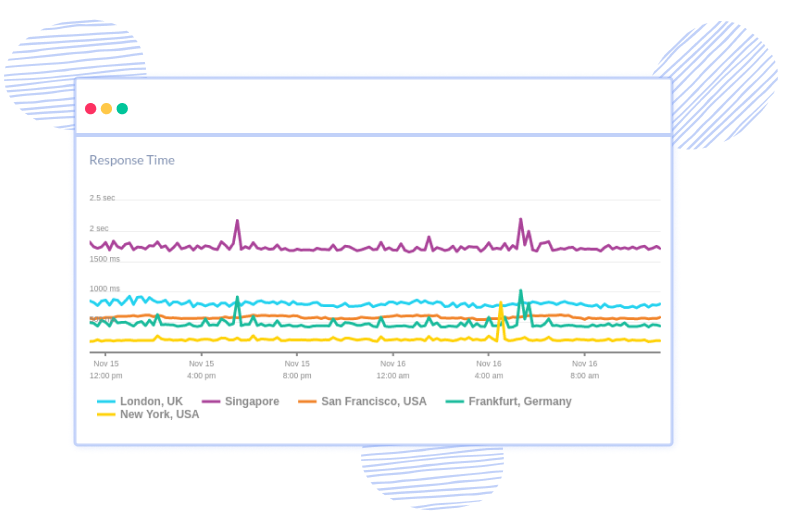
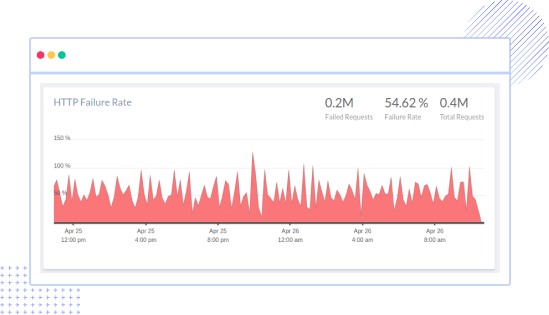
Explore Kafka MetricsPre-built Kafka monitoring dashboards give instant visibility into cluster health and anomalies. Customize them for your environment and get a clear, real-time view of the metrics that matter most to your team.
Start Free TrialNever miss critical issues with intelligent alerts sent to Slack, PagerDuty, Teams, or email. Atatus integrates seamlessly with your existing tools to make Kafka monitoring part of your workflow.
Request Live DemoLightweight and quick to deploy. No complex setup, just install the Atatus agent in your Kafka environment.
Automatically detects brokers, producers, and consumers to start monitoring Kafka with zero manual effort.
Pre-built dashboards and smart alerts give instant visibility, keeping your Kafka pipelines reliable 24/7.
Kafka monitoring is the process of tracking logs, metrics, and performance data from Apache Kafka clusters. It helps engineers detect consumer lag, broker issues, and message delays before they cause downtime. Without proper Kafka monitoring, businesses risk data loss, performance bottlenecks, and costly outages.
Some of the most critical Kafka metrics include:
Tracking these ensures stable performance and healthy clusters.
Atatus provides centralized Kafka monitoring by combining logs, metrics, and traces in one platform. It offers pre-built dashboards, real-time alerts, and seamless integrations with tools like Slack and PagerDuty. With Atatus, engineers can troubleshoot faster, optimize Kafka performance, and prevent failures proactively.
Yes. Atatus captures Kafka broker, producer, and consumer logs in one place. This eliminates the need to search through scattered files, making it easier to debug issues, resolve incidents quickly, and reduce downtime.
Absolutely. Atatus provides real-time Kafka dashboards that give visibility into consumer lag, partition health, cluster status, and anomalies. These dashboards are customizable, so teams can track the metrics that matter most to their environment.
Avail Atatus features for 14 days free-trial. No credit card required. Instant set-up.