
See Every Service.
Trace Every Failure. Fix It Fast.
Atatus Service Map automatically builds a live topology of your entire distributed system with every service, every dependency, and every health signal without manual diagrams.
Zero
Manual configuration for dependency discovery
<15min
Time to your first service map
Real-time
Service topology built from live trace data
Unified
APM, Tracing, Logs, Metrics, and RUM in one platform
Distributed Systems Hide Their Own Failures
Modern architectures move fast. Your visibility into them often doesn't keep up.
Hidden Service Dependencies
Services call services that call other services. Without a live map, teams operate with mental models that are weeks or months out of date. Architects draw diagrams; reality diverges immediately.
Cascading Failures Nobody Saw Coming
A timeout in one service silently degrades six downstream services. By the time alerts fire, users are already affected and engineers are digging through logs with no context on what hit what first.
Root Cause Investigations That Take Hours
Without knowing service relationships, on-call engineers bounce between dashboards, Slack threads, and Confluence pages trying to reconstruct a picture that should already exist.
Incident Scope Is Always Unknown
When something breaks, the first question is always "what else is affected?" If you can't answer that in seconds, your incident response slows to a crawl and blast radius grows.
Automatically Discover and Visualize Your Architecture
Turn on tracing and Atatus does the rest. Every service, dependency, and interaction is automatically discovered and mapped, giving you an up-to-date view of your architecture without any manual setup.
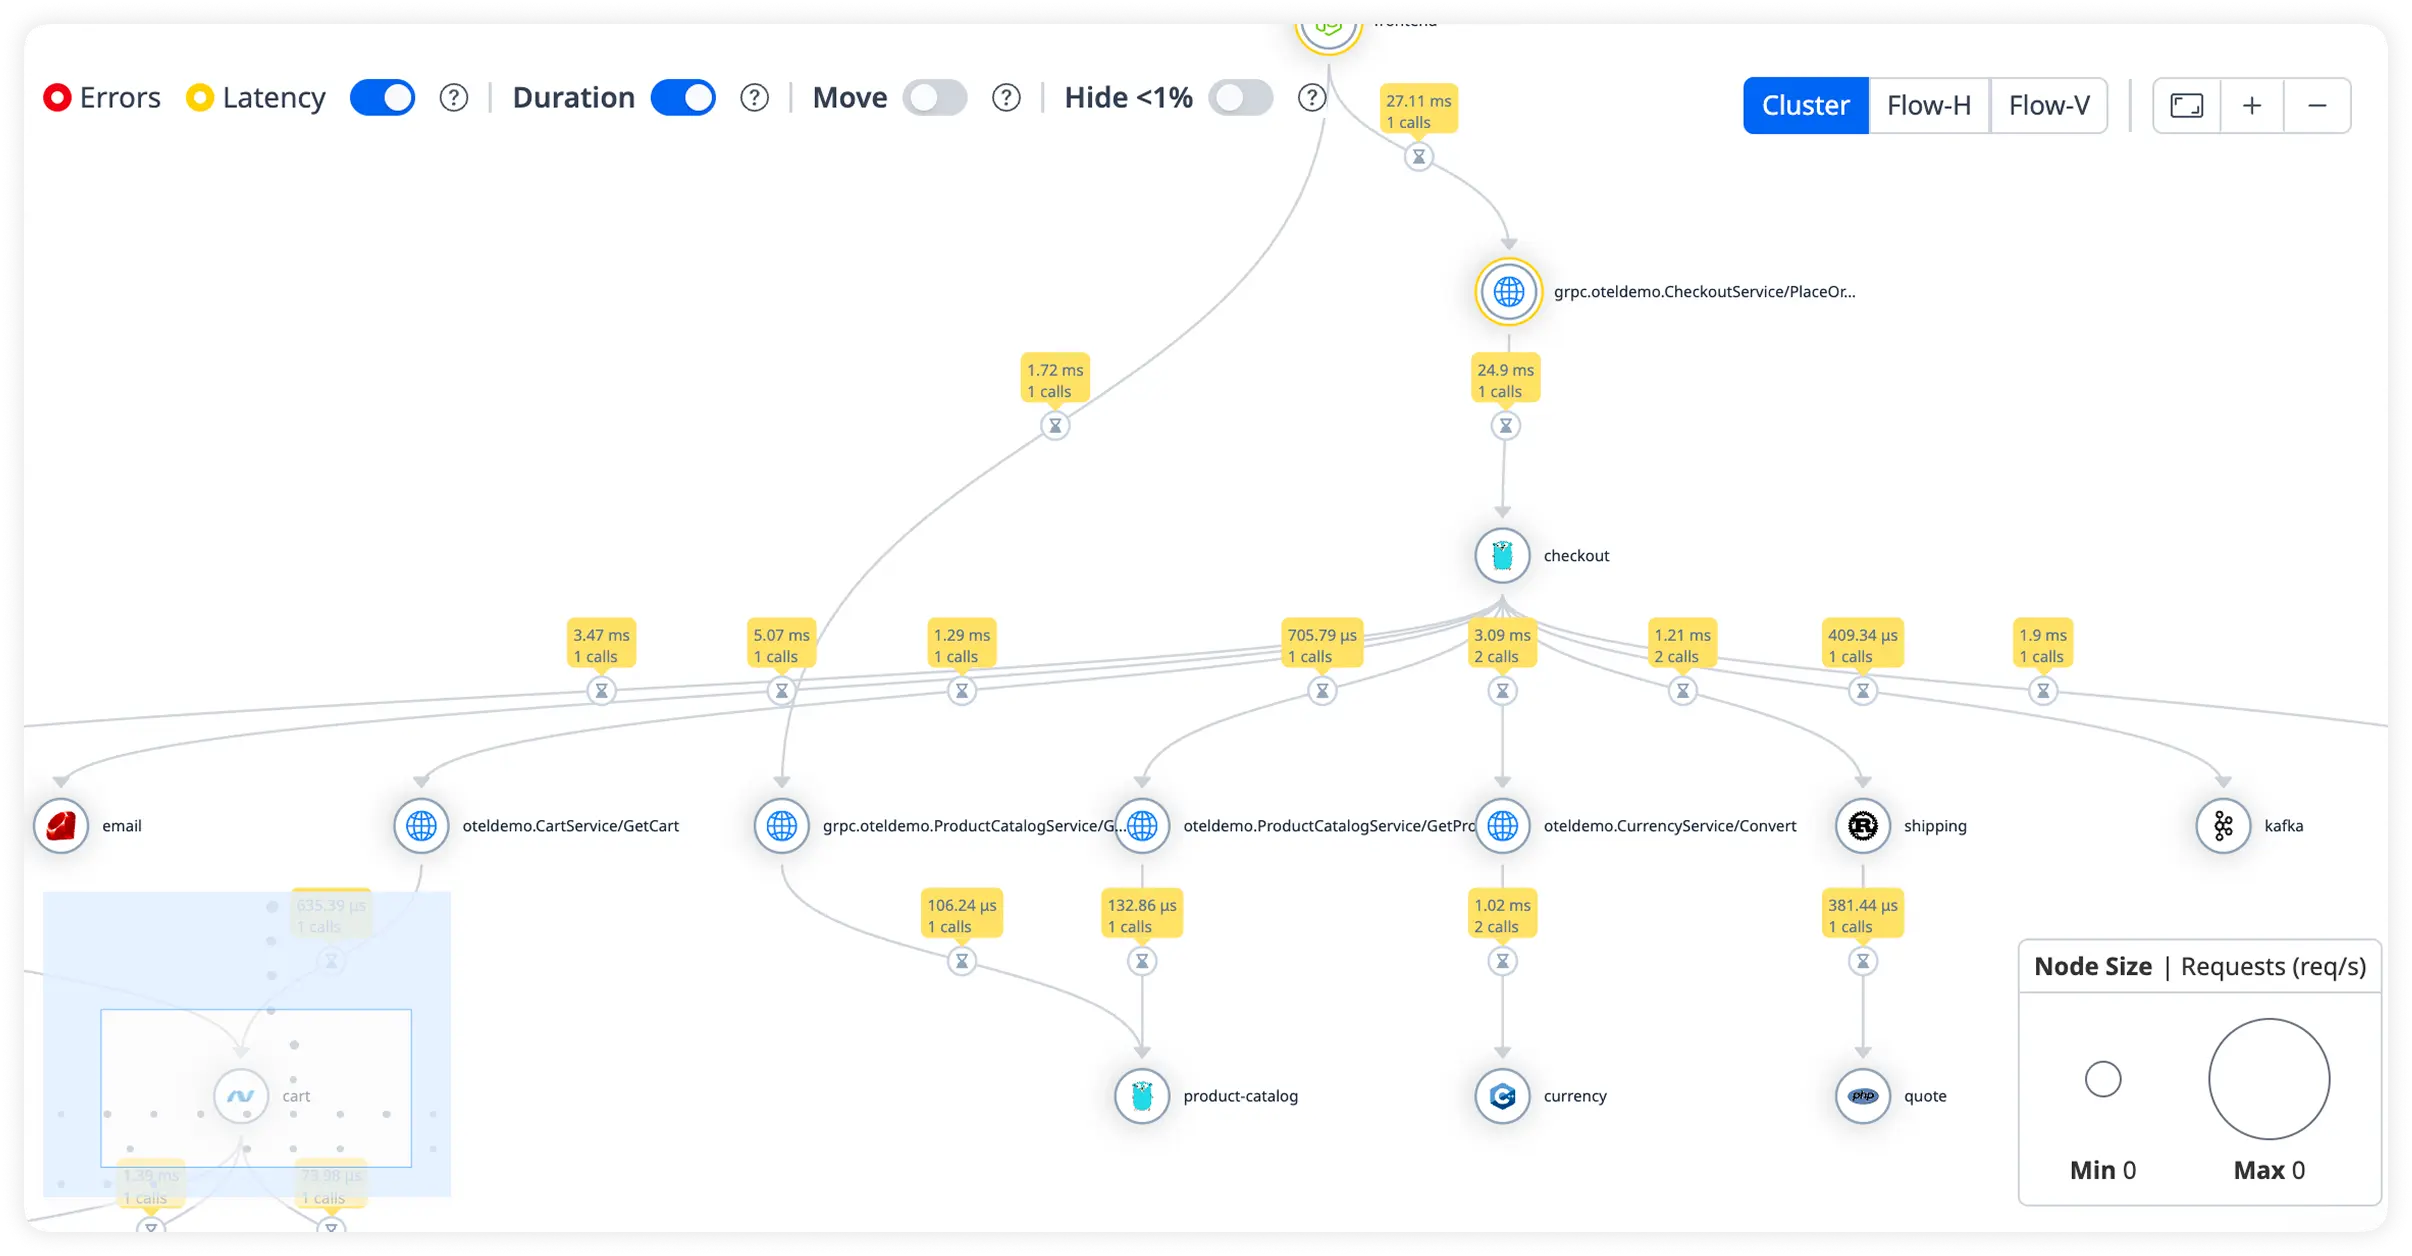
A Live View of Service Traffic and Health, Not a Snapshot
Atatus renders your service topology in real time using continuous tracing data. Request rates, error rates, and latency percentiles update on the map as they change, so your view reflects what's happening now, not what happened when someone last refreshed a dashboard.
- Live request rate, error rate, and p99 latency on every service node
- Color-coded health status: healthy, degraded, or failing at a glance
- Connection thickness reflects actual request volume
- Filter by time range: last 30 minutes, 1 hour, 6 hours, or custom
- Curved, step, or straight layout modes for different architecture shapes
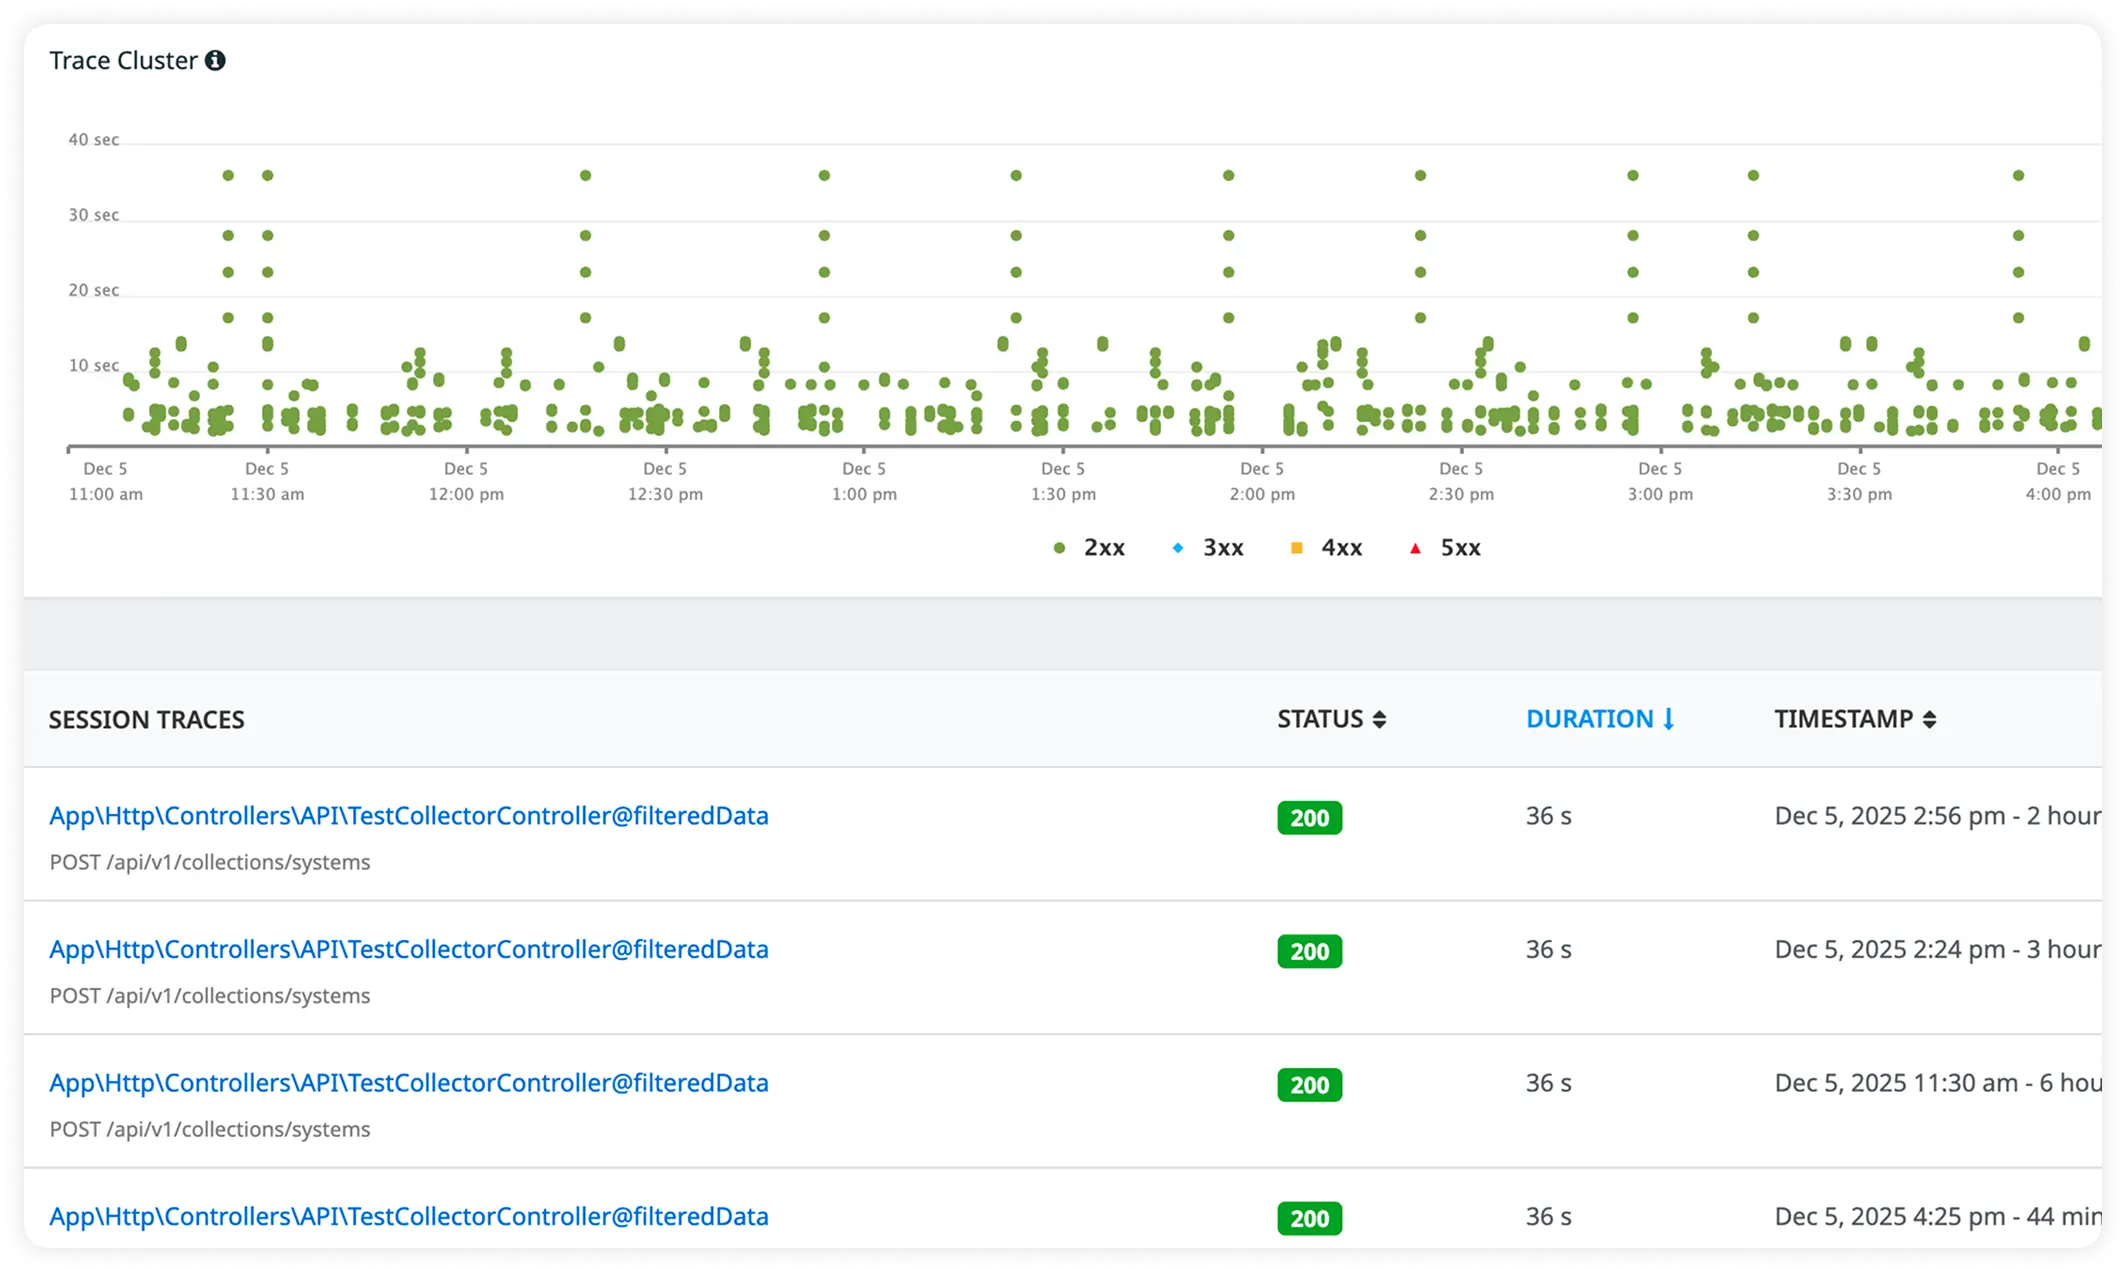
Follow Any Request From Entry Point to Every Service It Touches
Atatus connects the service topology directly to distributed traces, so you can move seamlessly from a high-level architecture view to the detailed request path of any individual transaction without switching tools or losing context.
- Click any service or connection to pull up linked distributed traces
- See upstream callers and downstream dependents for any service in one view
- Waterfall trace views show exactly where latency accumulates across hops
- Filter traces by status code, operation name, duration, or service path
- Correlate trace anomalies with infrastructure metrics and log events
How Service Maps Help
Platform Engineer Teams?
Service maps give teams a real-time view of dependencies, making it easier to troubleshoot issues, reduce MTTR, improve onboarding, and understand system architecture.
Faster Troubleshooting
When incidents occur, engineers jump straight to the relevant services instead of reconstructing the architecture from memory or docs. Investigation time drops from hours to minutes.
Reduced MTTR
Seeing the full blast radius of a failure in seconds rather than discovering it gradually through escalating alerts, lets teams resolve incidents before they compound.
Complete Dependency Visibility
Every upstream and downstream relationship is visible. Teams understand what calls what, what would break if a service went down, and what blast radius looks like before it happens.
Better Incident Response
On-call engineers have a shared visual reference during incidents. No more describing architecture verbally on a bridge call, everyone is looking at the same live map.
Improved Architecture Understanding
New team members understand the system in days, not weeks. The service map is always accurate documentation, the kind that actually reflects production, not what was planned six months ago.
Faster Engineer Onboarding
Onboarding to a complex microservices system used to mean weeks of shadowing. With a live service map, new engineers develop architectural intuition from day one.
Built for the Teams Running Modern Distributed Systems
Whether you're investigating an incident or planning your next architecture change, Atatus Service Map has a clear role to play.
Microservices Monitoring
Track the health, throughput, and latency of every microservice in real time. Spot degradation in individual services before it cascades to users.
Incident Investigation
When an alert fires, the service map is your first stop. Identify the source of failure and every downstream service in its blast radius within seconds of opening the page.
Service Dependency Analysis
Understand which services depend on which before you make changes. Assess the risk of a deployment, a configuration change, or a database migration before it goes live.
Cloud-Native Applications
Automatically maps services running on AWS, GCP, Azure, or hybrid environments. External cloud services and third-party APIs appear in your topology alongside internal services.
Kubernetes Environments
Native Kubernetes grouping by cluster, namespace, and pod. View your full multi-cluster topology or focus on a single namespace, no extra configuration required.
Performance Optimization
Identify services with consistently high latency or error rates and trace the performance bottleneck back to specific operations. Prioritize optimization work by actual impact.