
Deliver Better Experiences with Real User Monitoring
Get complete visibility into how real users experience your site. Atatus Real User Monitoring captures performance metrics, JavaScript errors, user journeys in real time and delivers seamless digital experiences that keep users coming back.
<5min
Time to first insight after install
70%
Faster mean time to resolution
99.9%
Crash-free session rate achievable
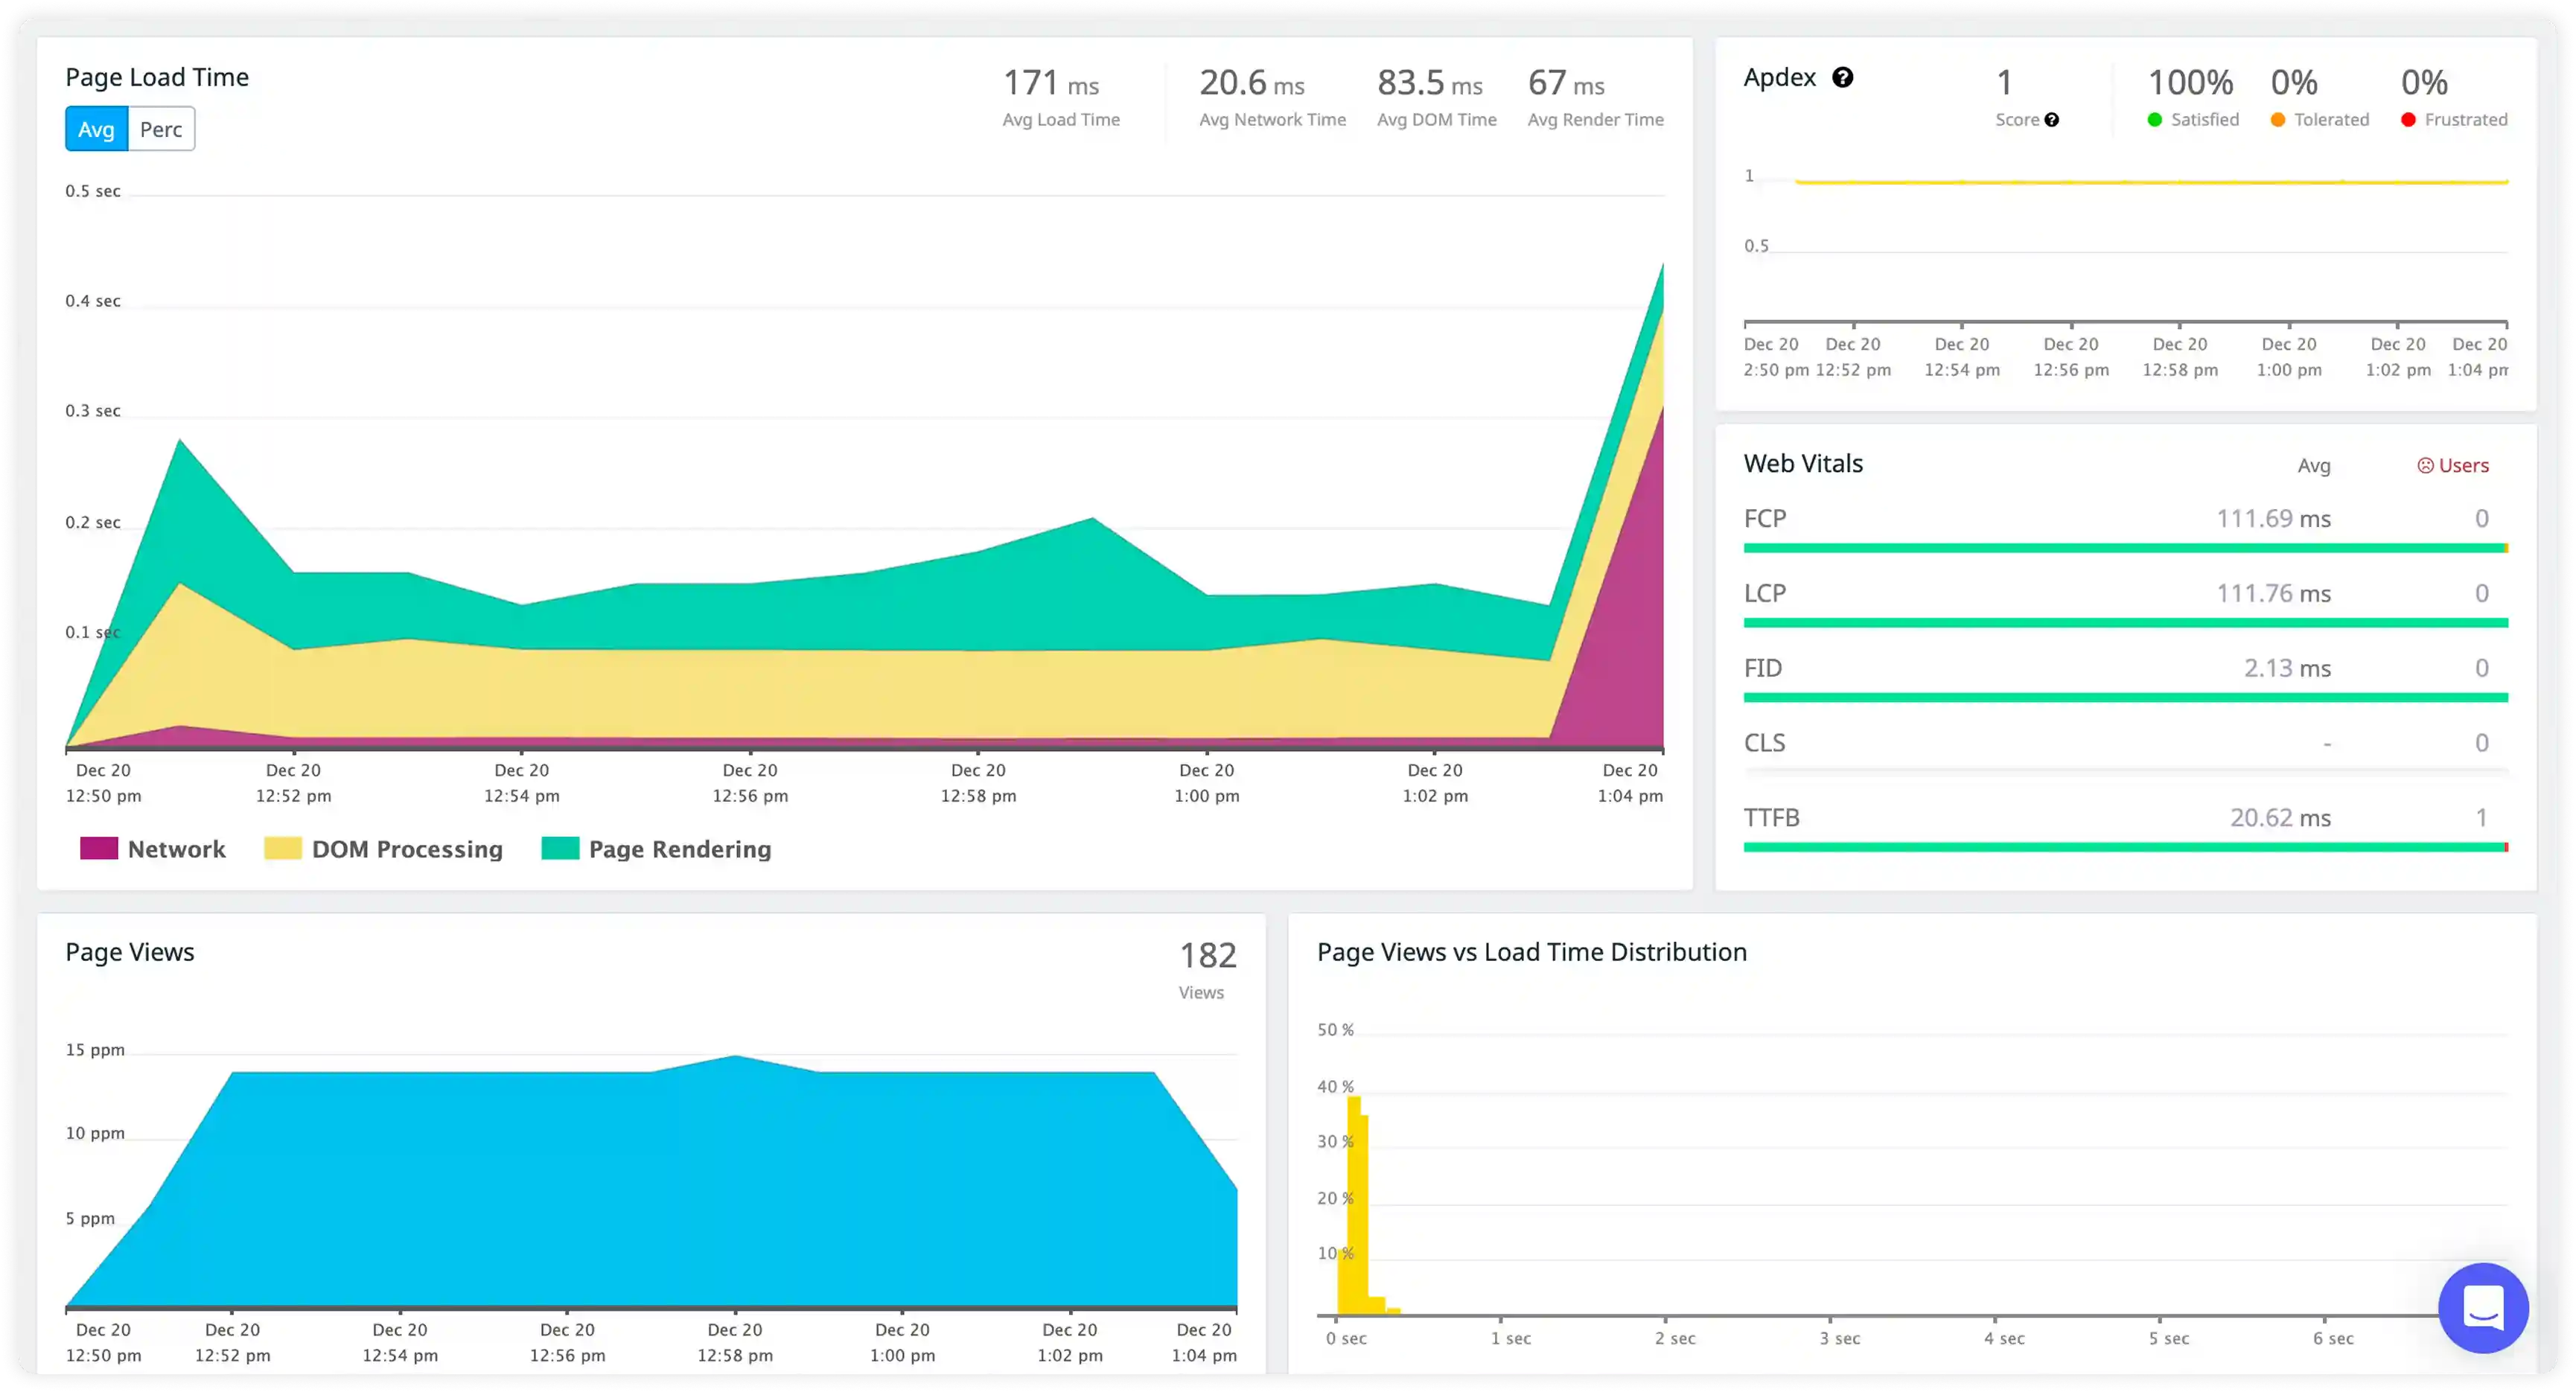
Everything your team needs to own the frontend experience
From Core Web Vitals to session-level JavaScript error context, every capability is built for the speed your users and your Google rankings demand.
Core Web Vitals Monitoring
Track LCP, INP, CLS, FID, TTFB, and FCP against Google's 75th-percentile thresholds in real time. Segment by URL, device type, browser, connection speed, and country. Know exactly which pages are dragging your search rankings and by how much before your SEO team files a ticket.
JavaScript Error Tracking with Full Session Context
Every JS exception is captured with a complete stack trace, browser/OS/device fingerprint, breadcrumb trail, prior navigation path, and active AJAX calls at the moment of failure. No more "can't reproduce" tickets sitting in the backlog for weeks.
Single-Page App (SPA) Route Monitoring
React, Angular, Vue, Next.js, and Nuxt route changes are tracked automatically as individual views, each with its own load performance timeline, resource waterfall, and XHR breakdown. Understand precisely which routes are slow, and which AJAX calls are causing them.
Smart Alerting on Performance Regressions
Set threshold-based or anomaly-based alerts on load time spikes, error rate increases, or Core Web Vital degradations. Route notifications to Slack, PagerDuty, OpsGenie, Teams, or email and catch regressions within minutes of a deploy, before users notice anything.
Page Asset Waterfall & Resource Diagnostics
Drill into every slow-loading page to see a full resource waterfall including JS, CSS, images, XHR with individual timing breakdowns (DNS, TCP, TTFB, download). Identify third-party scripts, render-blocking resources, and oversized assets killing your load time in one view.
Geographic & Device Segmentation
Performance doesn't look the same everywhere. Break down every metric by country, region, browser version, OS, device type, and connection type. Find that mobile users in Southeast Asia are experiencing 6-second LCP scores while desktop users in Europe see 1.9s and fix the right problem for the right audience.
Everything You Need to Monitor Real Users
Production-ready RUM features that help you deliver exceptional user experiences
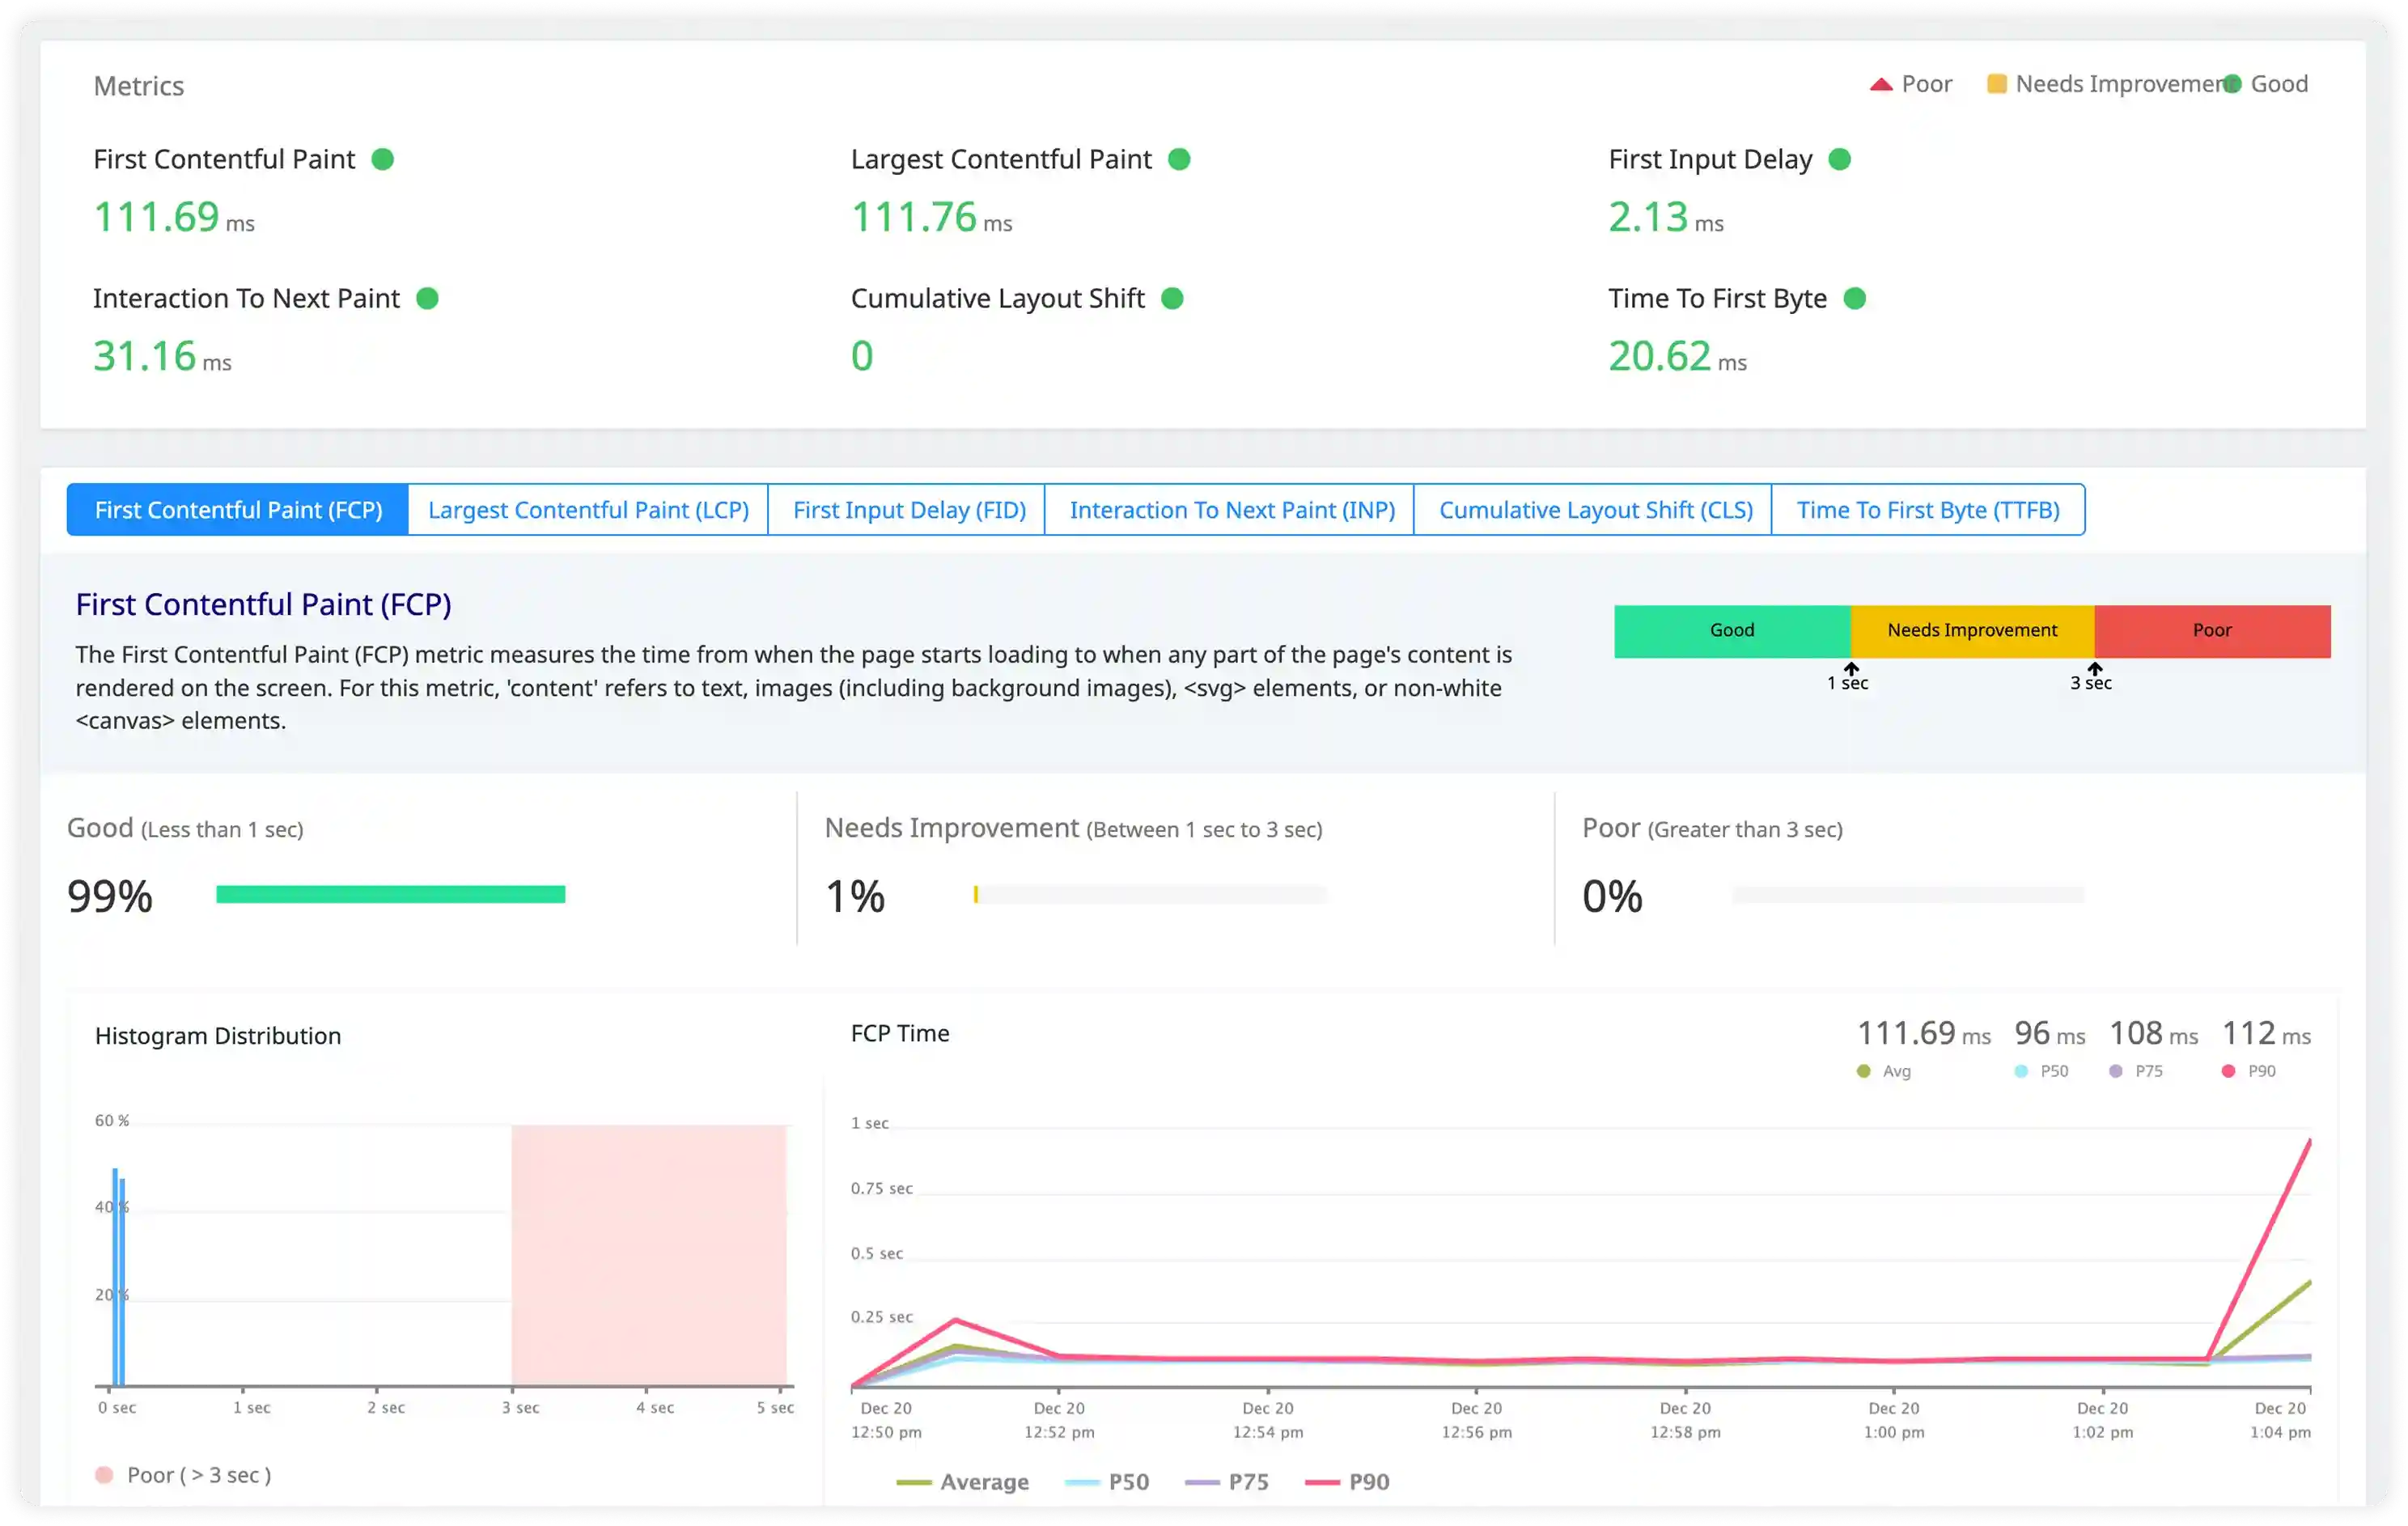
See Performance Through Your Users Eyes
RUM captures how real users experience your app across every device, browser, and region. Not just what your test environment predicts.
- Track real user page load times across devices, browsers, and geographies to see how performance behaves in production
- Measure Core Web Vitals in real time including LCP, INP, and CLS to understand what impacts user experience and search visibility
- Capture detailed resource timing data for scripts, APIs, and third-party assets to pinpoint what slows down real user sessions
- Correlate frontend performance metrics with user actions and session flows to identify where slow experiences lead to drop-offs
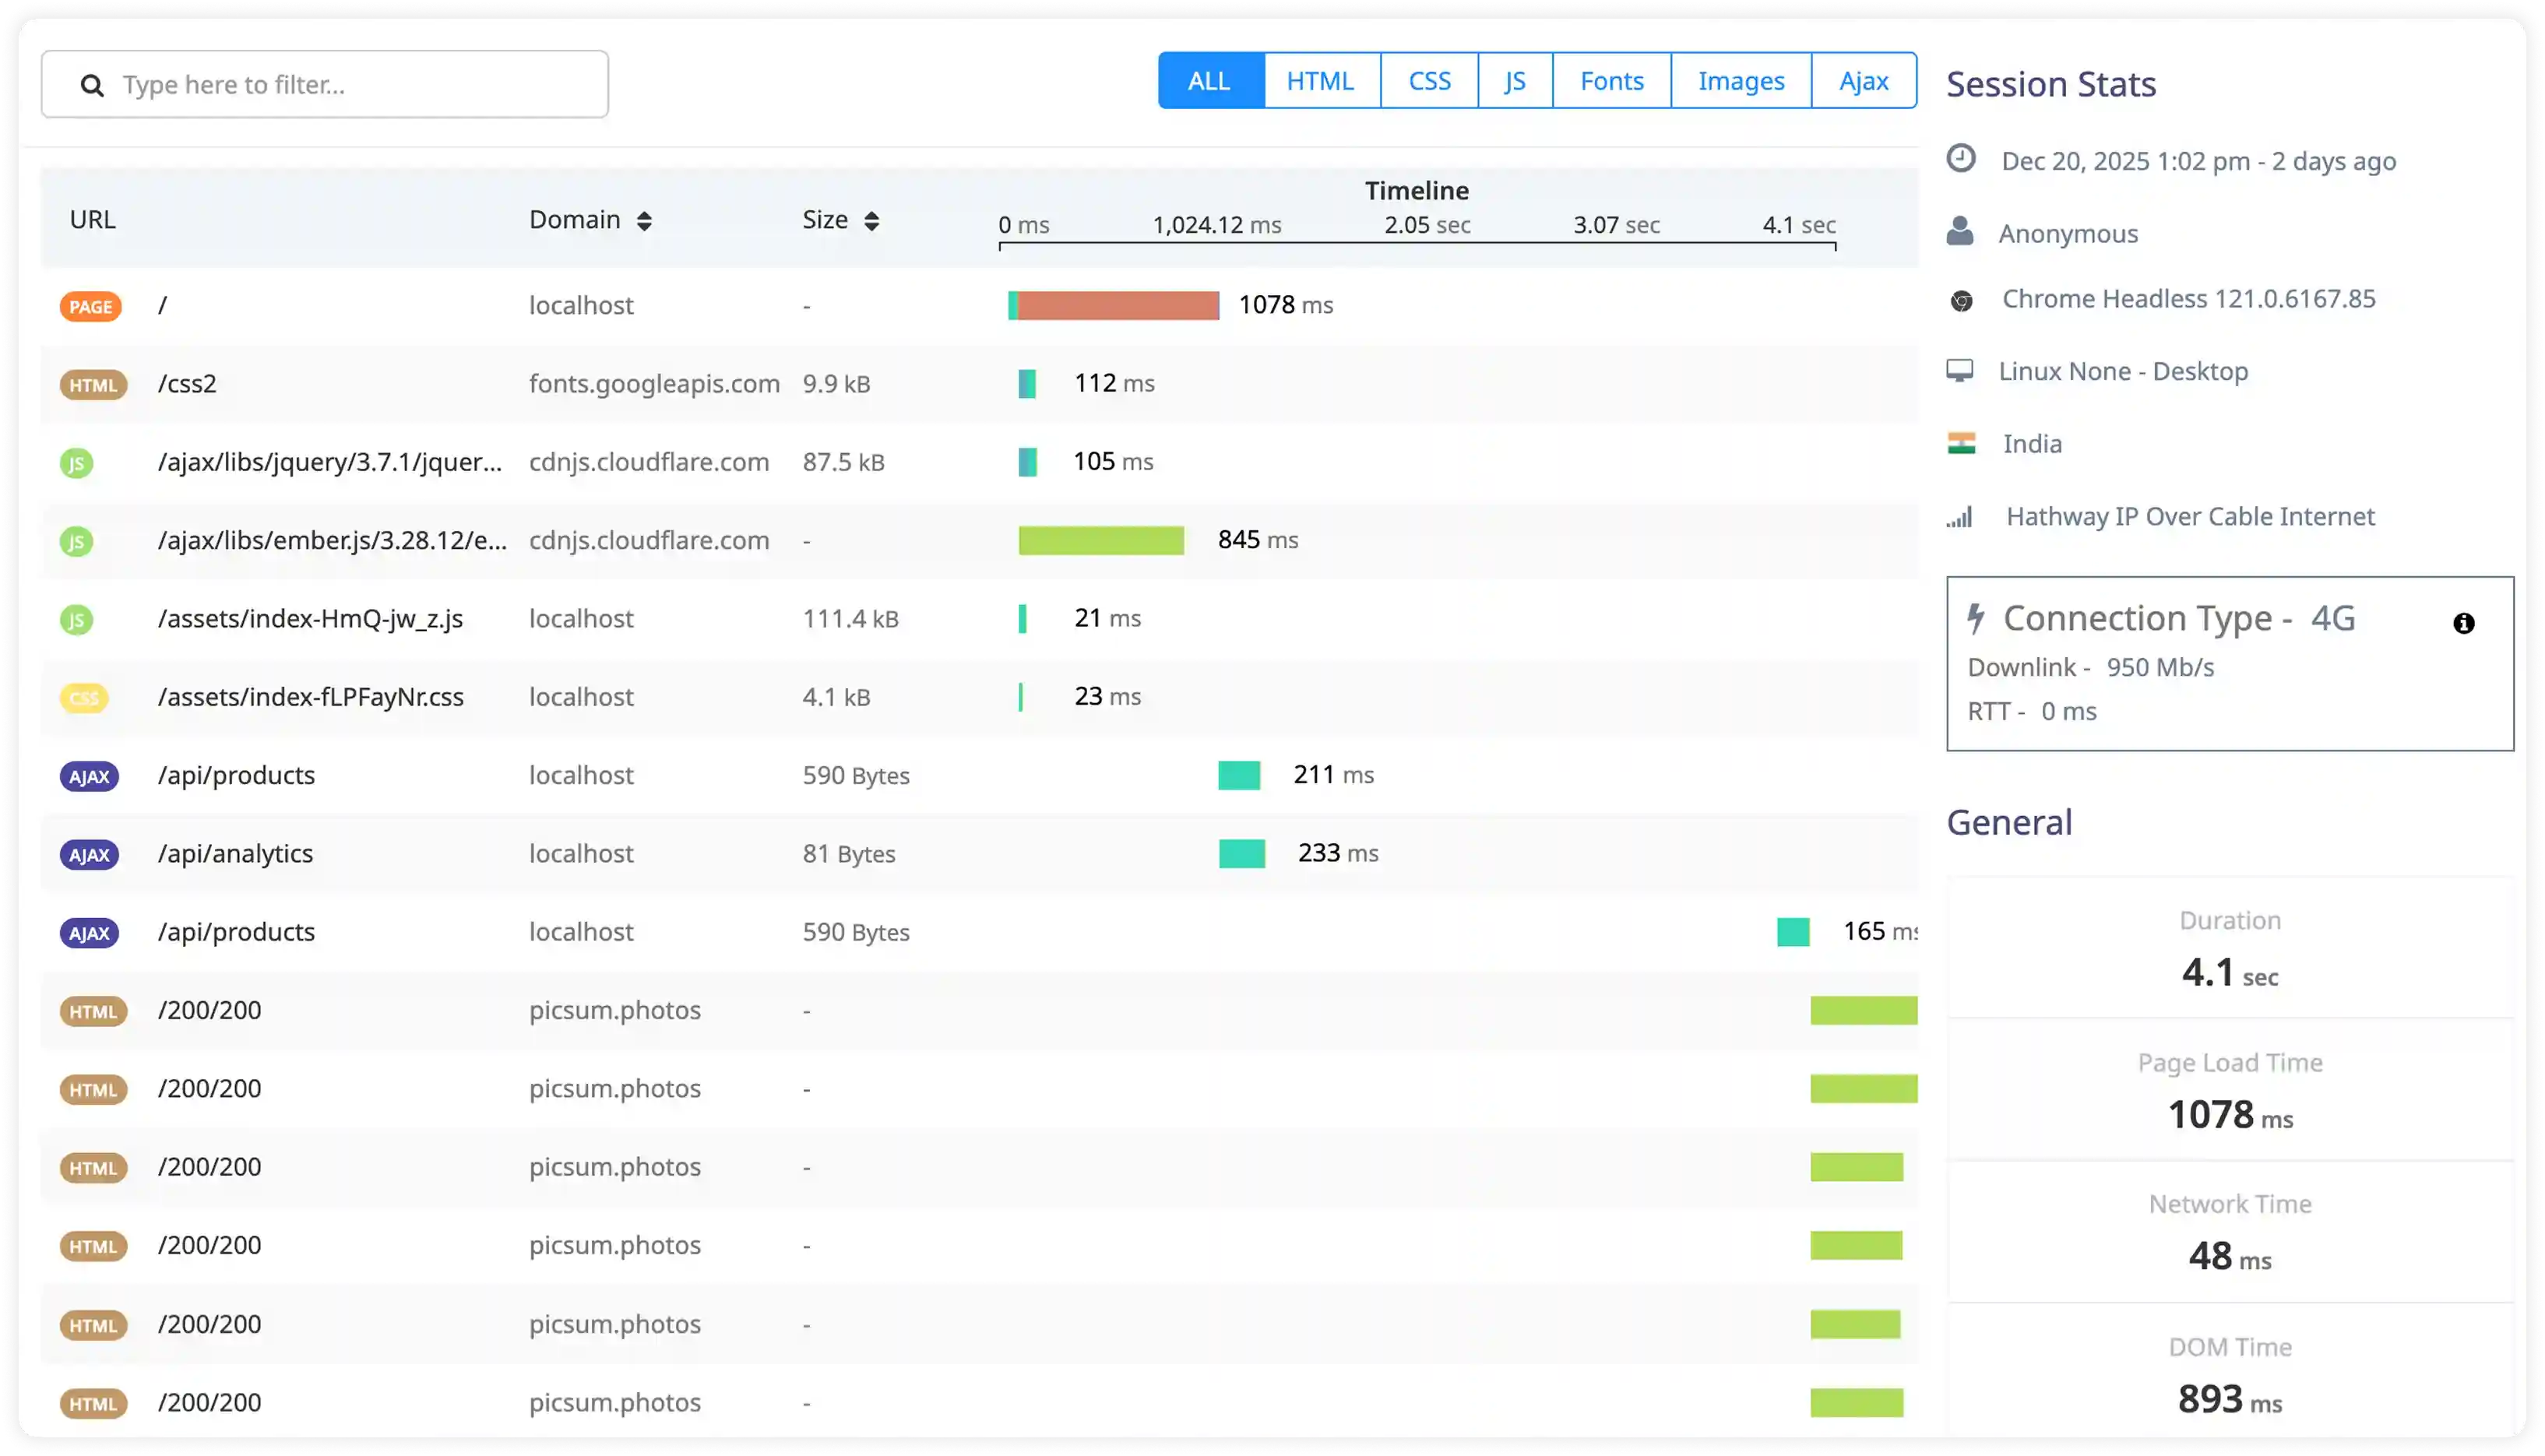
Understand Every Step of the User Journey
RUM records full session context and navigation paths so you can see exactly where friction slows users down and why.
- Capture real user sessions with full context such as device type, browser, OS, and location to understand performance variations across real environments
- Track complete user interaction paths and navigation flows to identify slow routes and high-friction moments across the application
- Analyze session-level performance metrics to see how load times and delays affect real user behavior and task completion
- Prioritize optimizations based on real usage patterns, focusing engineering effort where it delivers measurable experience improvements
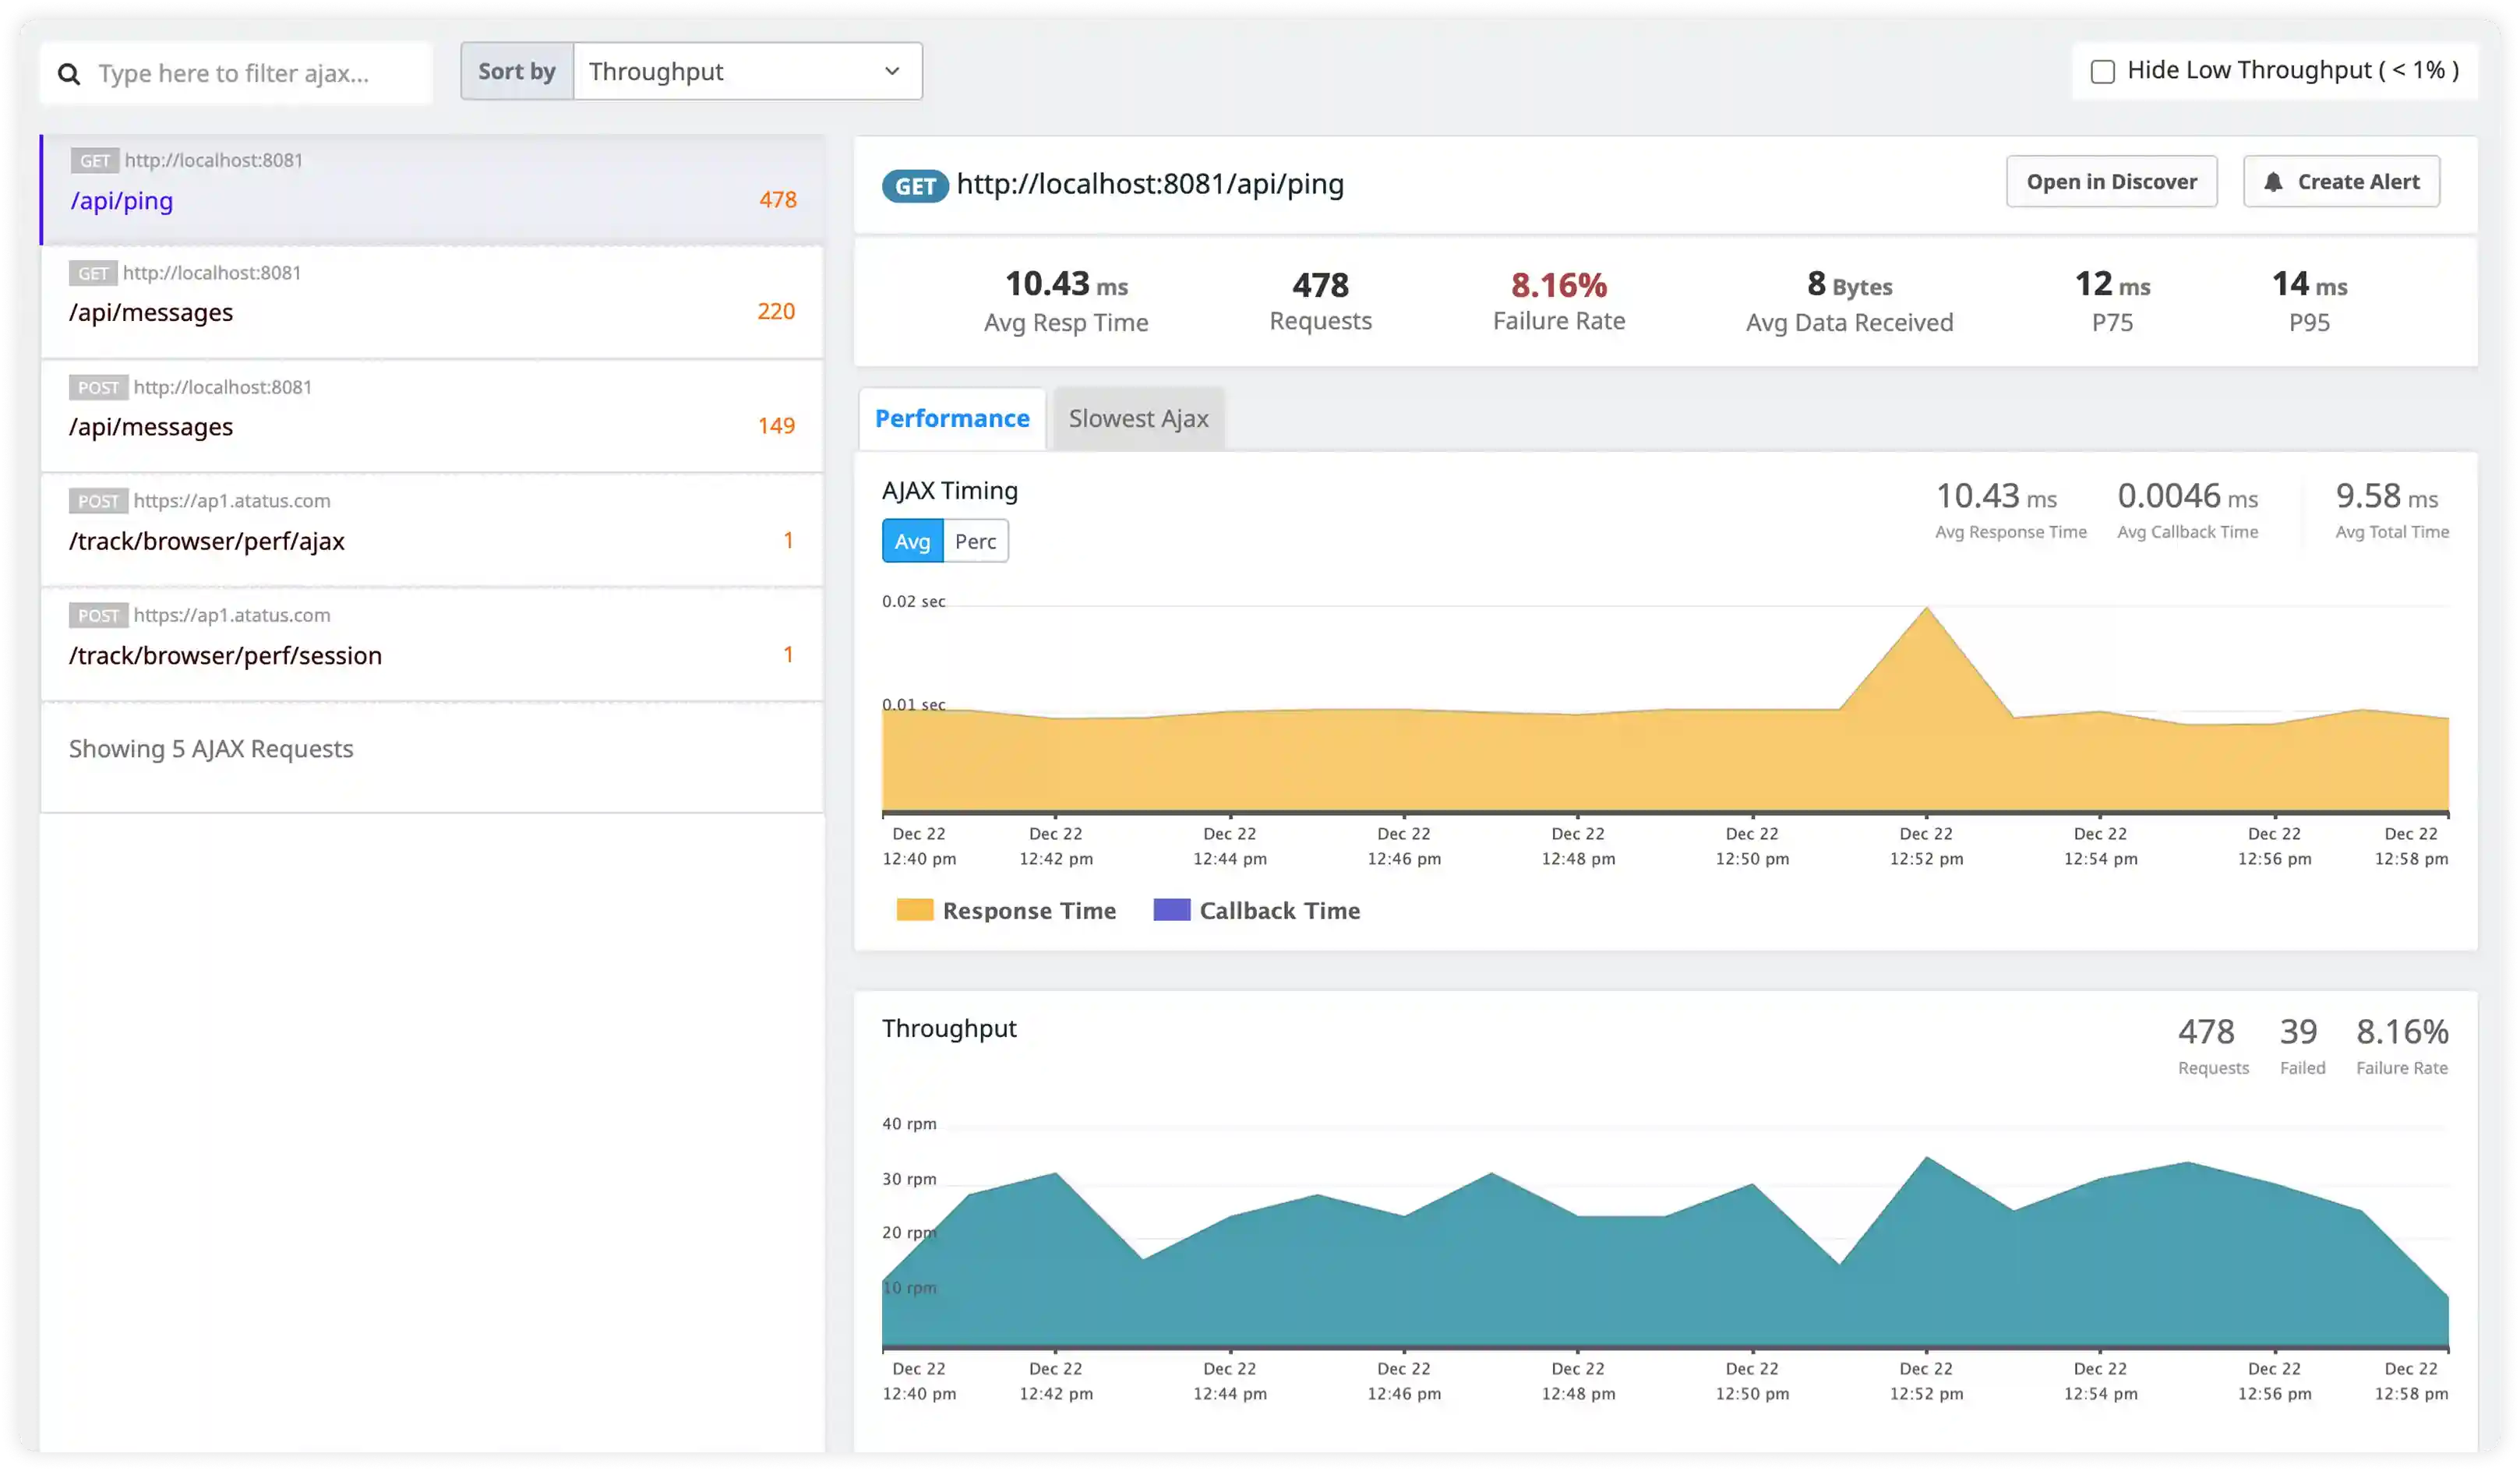
Catch Every Error Before It Costs You Users
RUM surfaces client-side errors and slow API calls from real sessions, giving you the context to fix what matters most.
- Capture JavaScript errors from real user sessions with full context such as browser, device, and the exact actions leading up to the error
- Monitor AJAX and fetch request performance to see latency, failures, and slow responses impacting frontend interactions
- Correlate client-side errors with specific pages, routes, and user flows to quickly isolate where experiences break down
- Prioritize fixes based on real user impact, focusing on errors and slow calls that affect the highest number of sessions
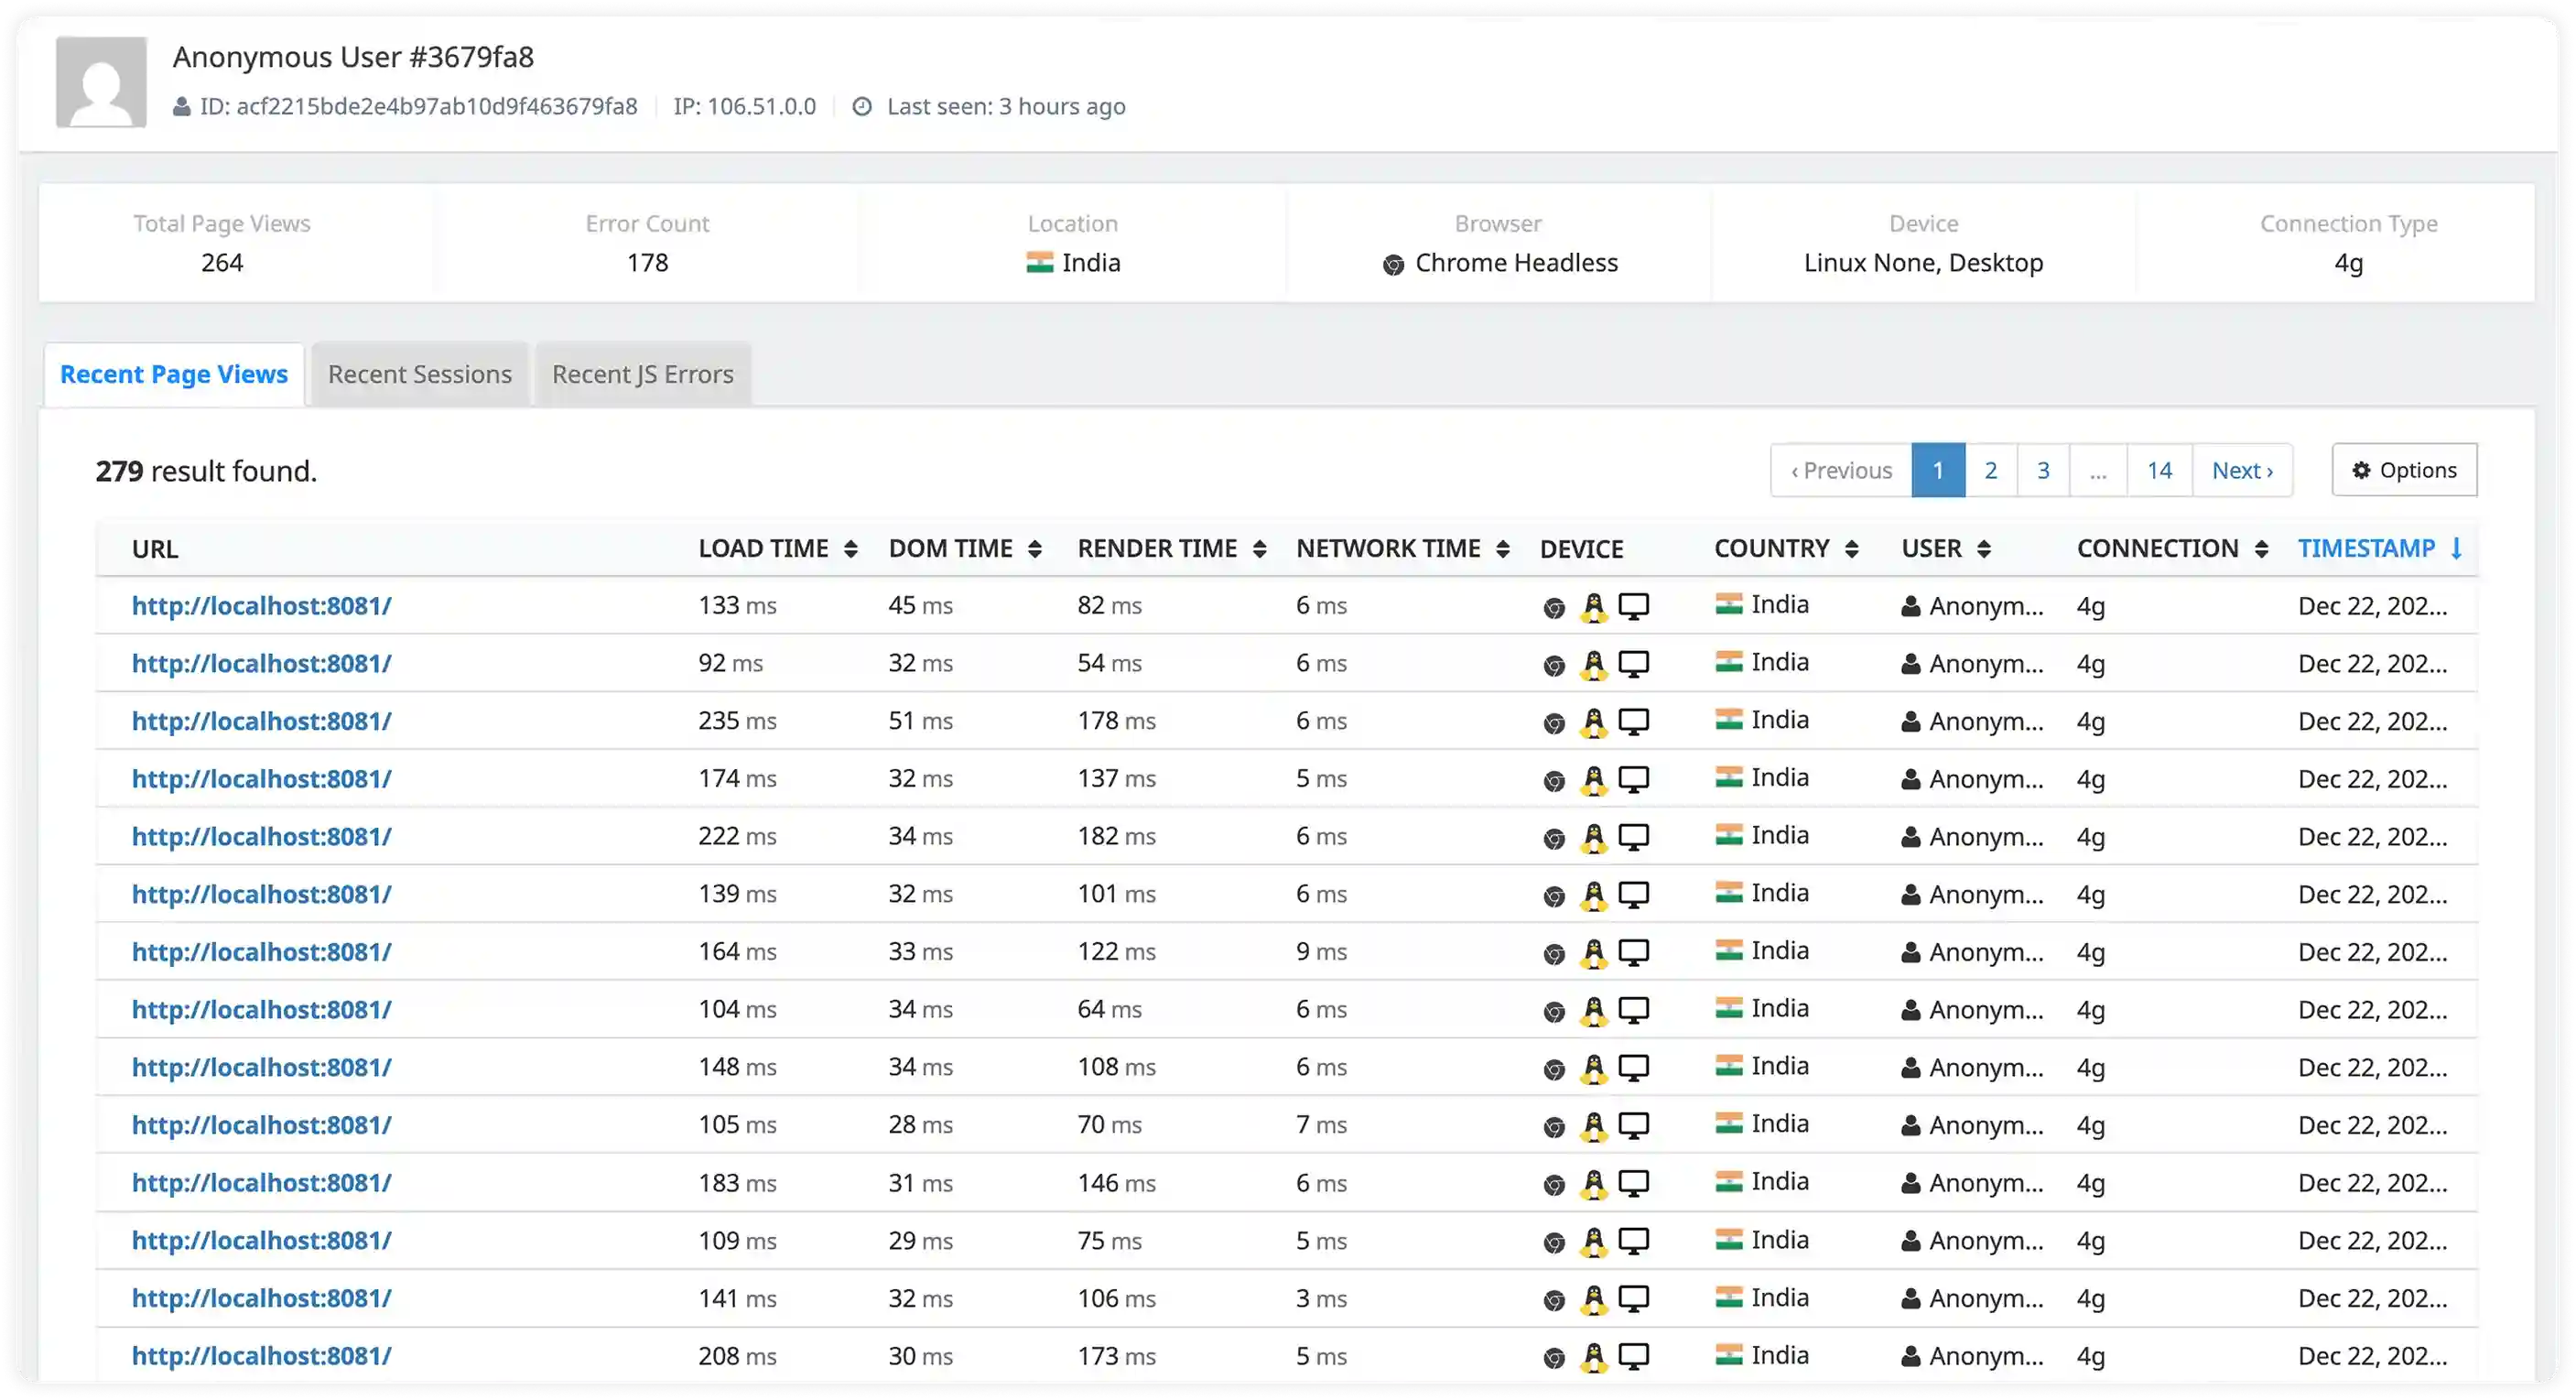
Full Visibility Into Modern Frontend Performance
RUM tracks SPA route changes and virtual page views so you can monitor real performance in dynamic apps, not just on initial load.
- Track SPA route changes and virtual page views to understand performance beyond traditional full page reloads
- Measure load times and delays for each route transition to identify slow views and interaction bottlenecks
- Correlate route-level performance with user actions to see how clicks, state changes, and navigation impact responsiveness
- Gain clear visibility into dynamic application behavior so teams can optimize real user flows in modern frontend frameworks
Built for Real Users,
Optimized for Performance
Get complete visibility into how real users experience your site. Start monitoring in minutes and optimize effortlessly.
Real User Visibility
See exactly how real users experience your site across browsers, devices, and locations. Capture Web Vitals, session data, and user behavior in real time.
Root-Cause Detection
Quickly identify what's causing slowdowns or errors. Drill into sessions, AJAX calls, and JavaScript issues to resolve problems before they impact users.
Zero Maintenance
Lightweight, easy-to-install script with no ongoing upkeep. Runs silently in the background without affecting site performance. Set it and forget it.
Business impact
What engineering teams actually achieve with Atatus RUM?
Real outcomes from teams running Atatus in production monitoring across SaaS, e-commerce, and digital products.
Time to reproduce any error
User actions, breadcrumbs, request state, and device context captured automatically. No more "cannot reproduce" tickets.
Reduction in alert noise
Intelligent grouping surfaces the real issues. Stop drowning in duplicates. See signal, not volume.
Crash-free session rate achievable
Proactive error tracking means exceptions are caught and fixed before they compound into revenue-impacting downtime.









Start Monitoring in Under 5 Minutes
Three simple steps to complete observability. No credit card required.
Embed Atatus RUM Snippet
Insert a small, lightweight JavaScript snippet into your website's HTML. It takes just a few lines of code and works with any web stack.
Start Capturing Real User Data
As visitors interact with your site, Atatus automatically collects performance metrics including page load times, Core Web Vitals, errors, AJAX requests, user sessions, and more.
Visualize Your RUM Dashboard
Log in to your Atatus dashboard to explore real-time insights across geography, browser, device, and user behavior with built-in reports and alerts to help you take action fast.