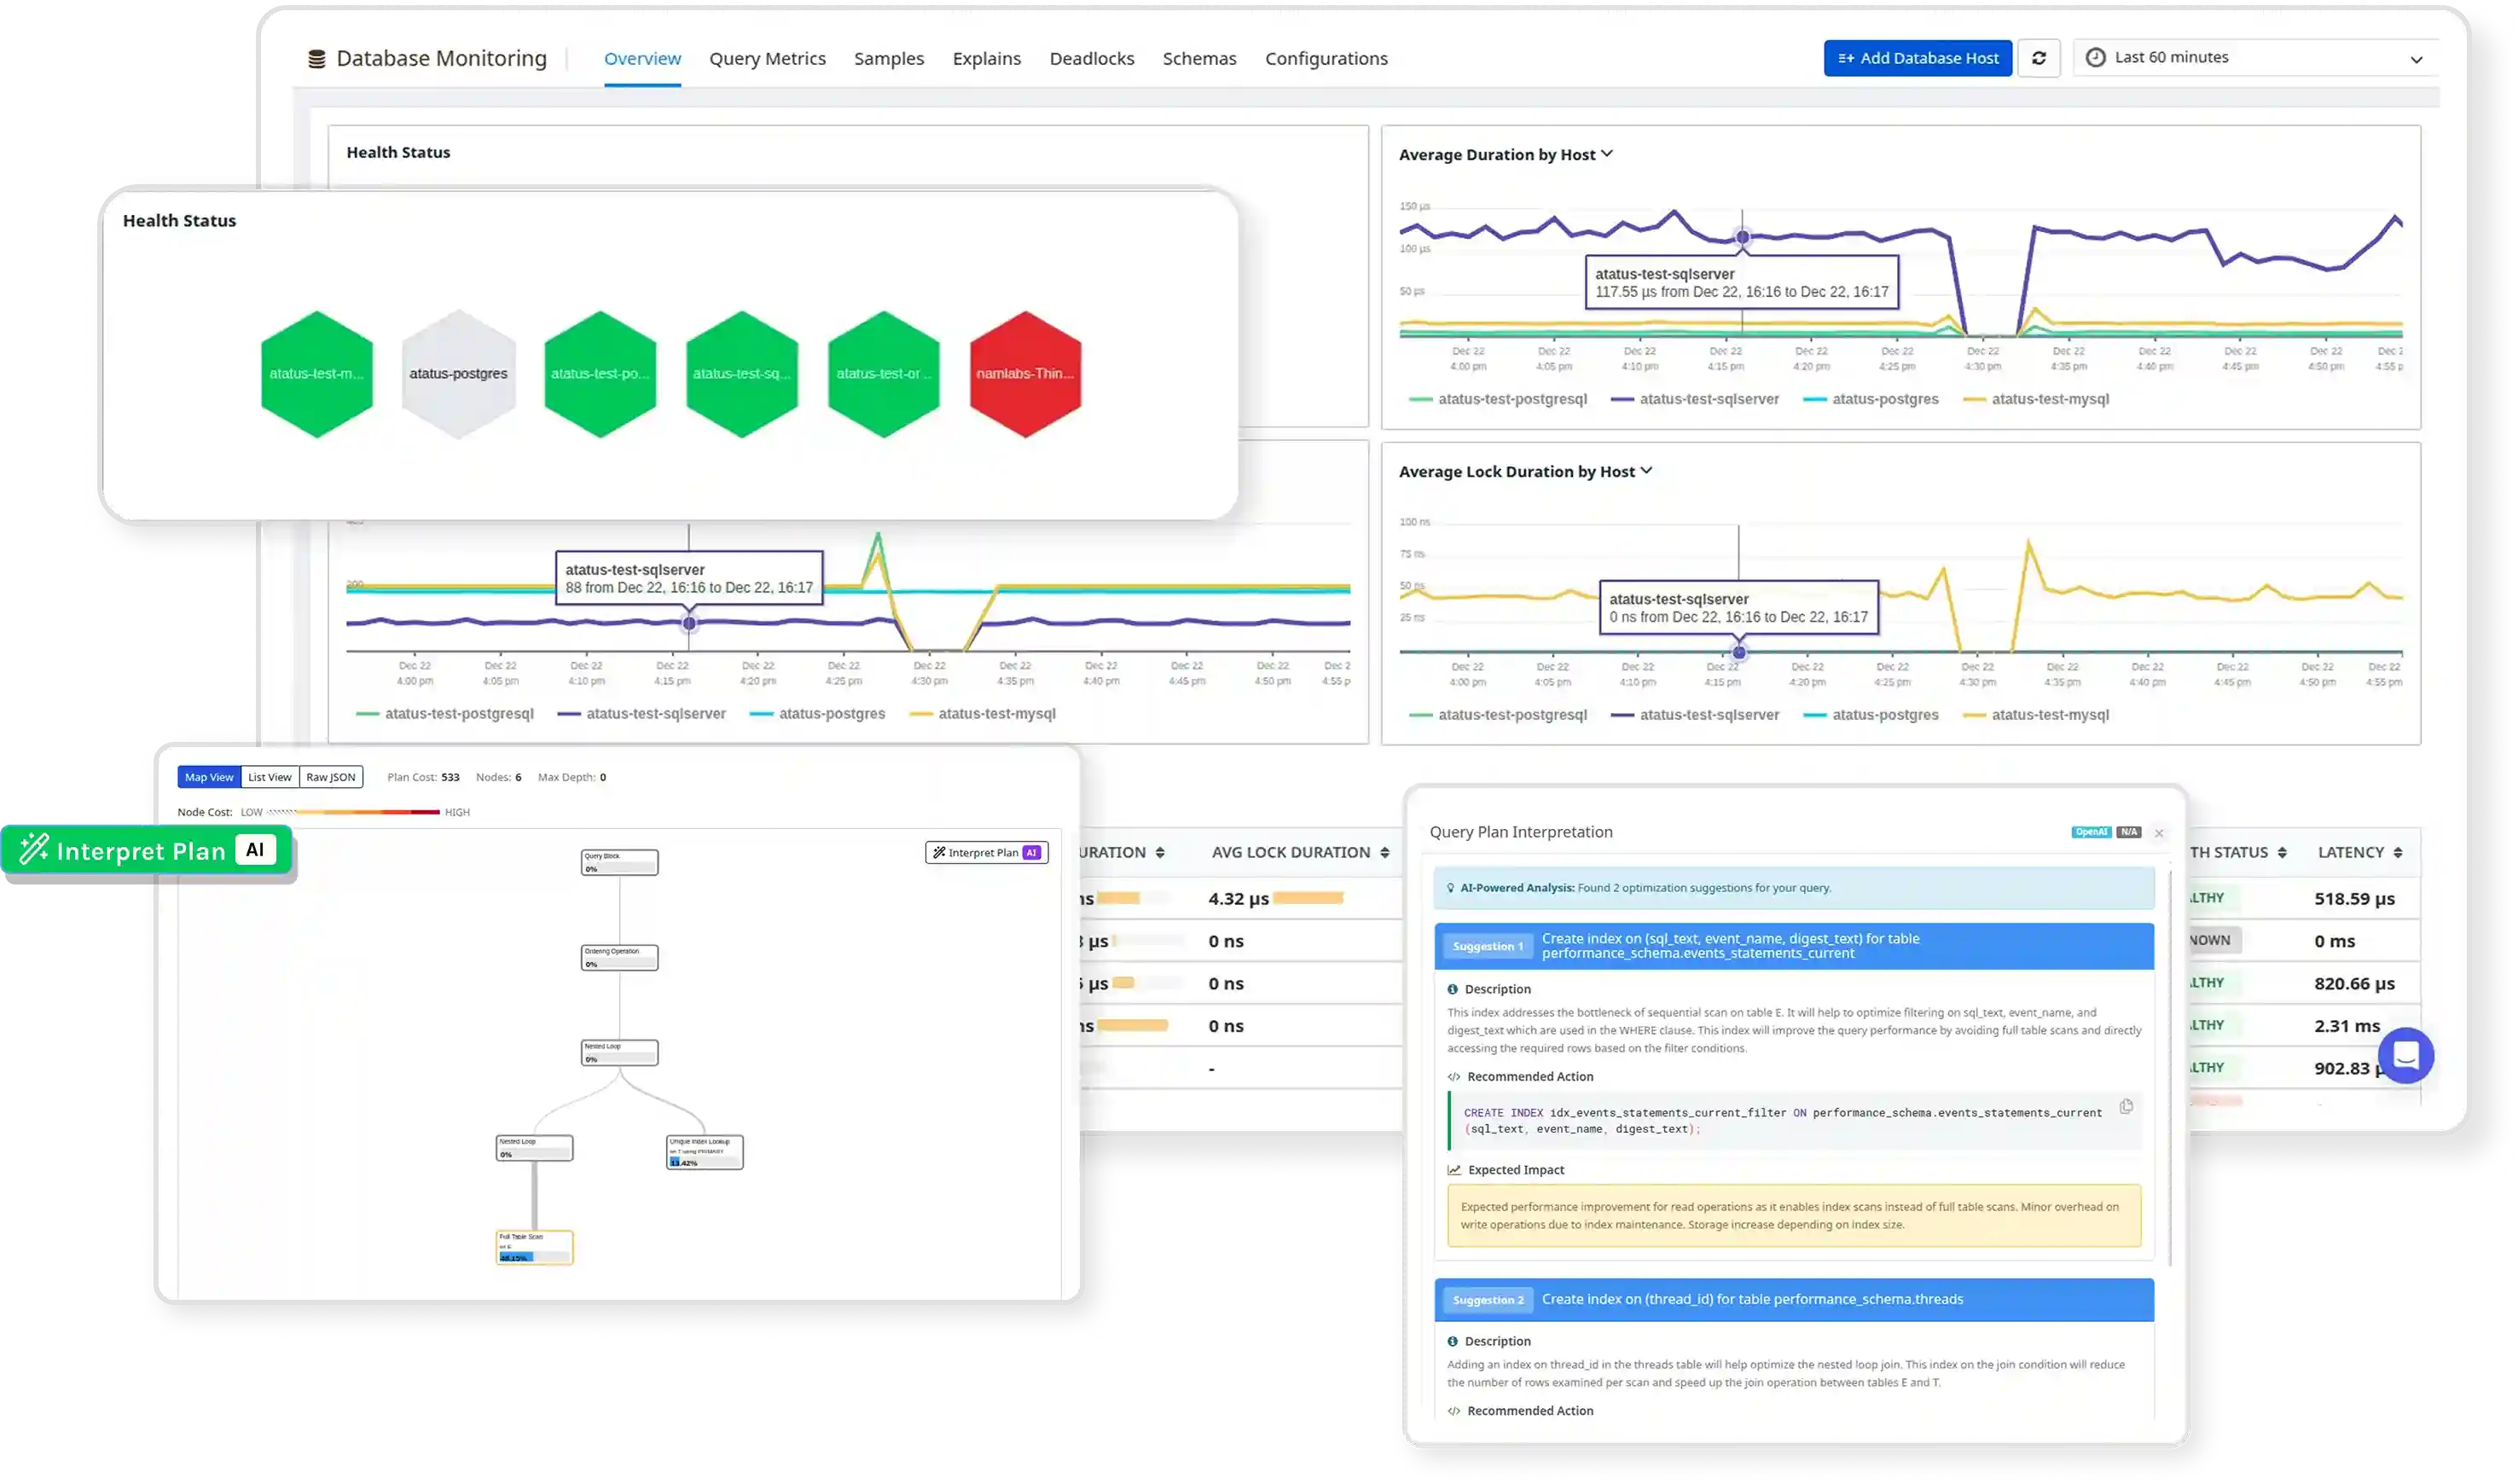
AI-Powered Database Monitoring
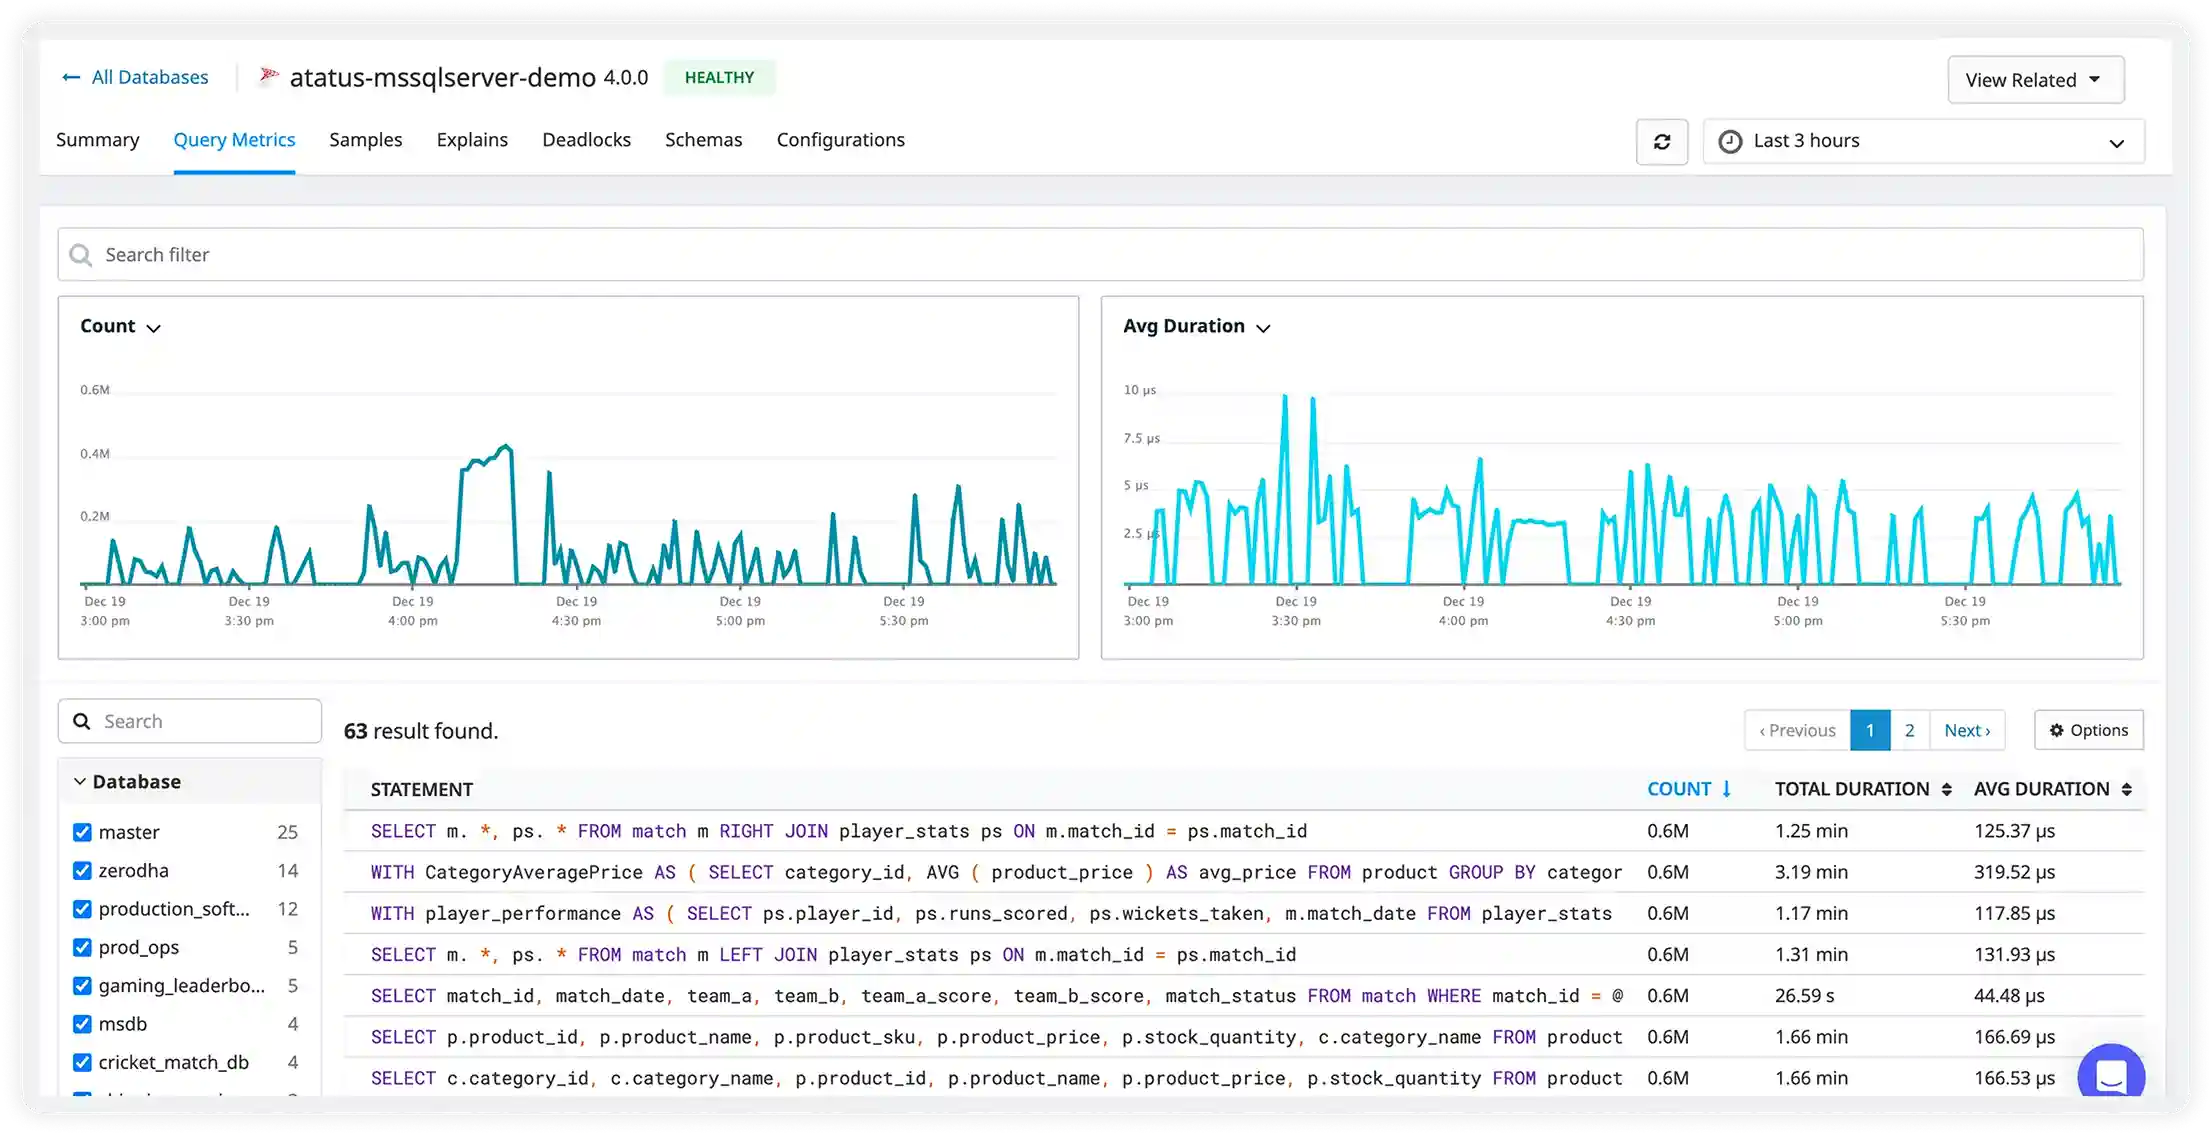
Your worst queries, ranked.
Sort by time or calls. Open one to see its plan and a suggested fix.
Normalized query signatures · sample data
Catch the deadlock. See who blocked whom.
SQL Server deadlocks with the victim, the survivor and every lock they fought over.
- Database type
- sqlserver
- DB host
- mssql-prod-1
- Victim process
- process2129d330ca8
- Survivor process
- process2128c403088
- Database
- orders_db
- Table
- orders
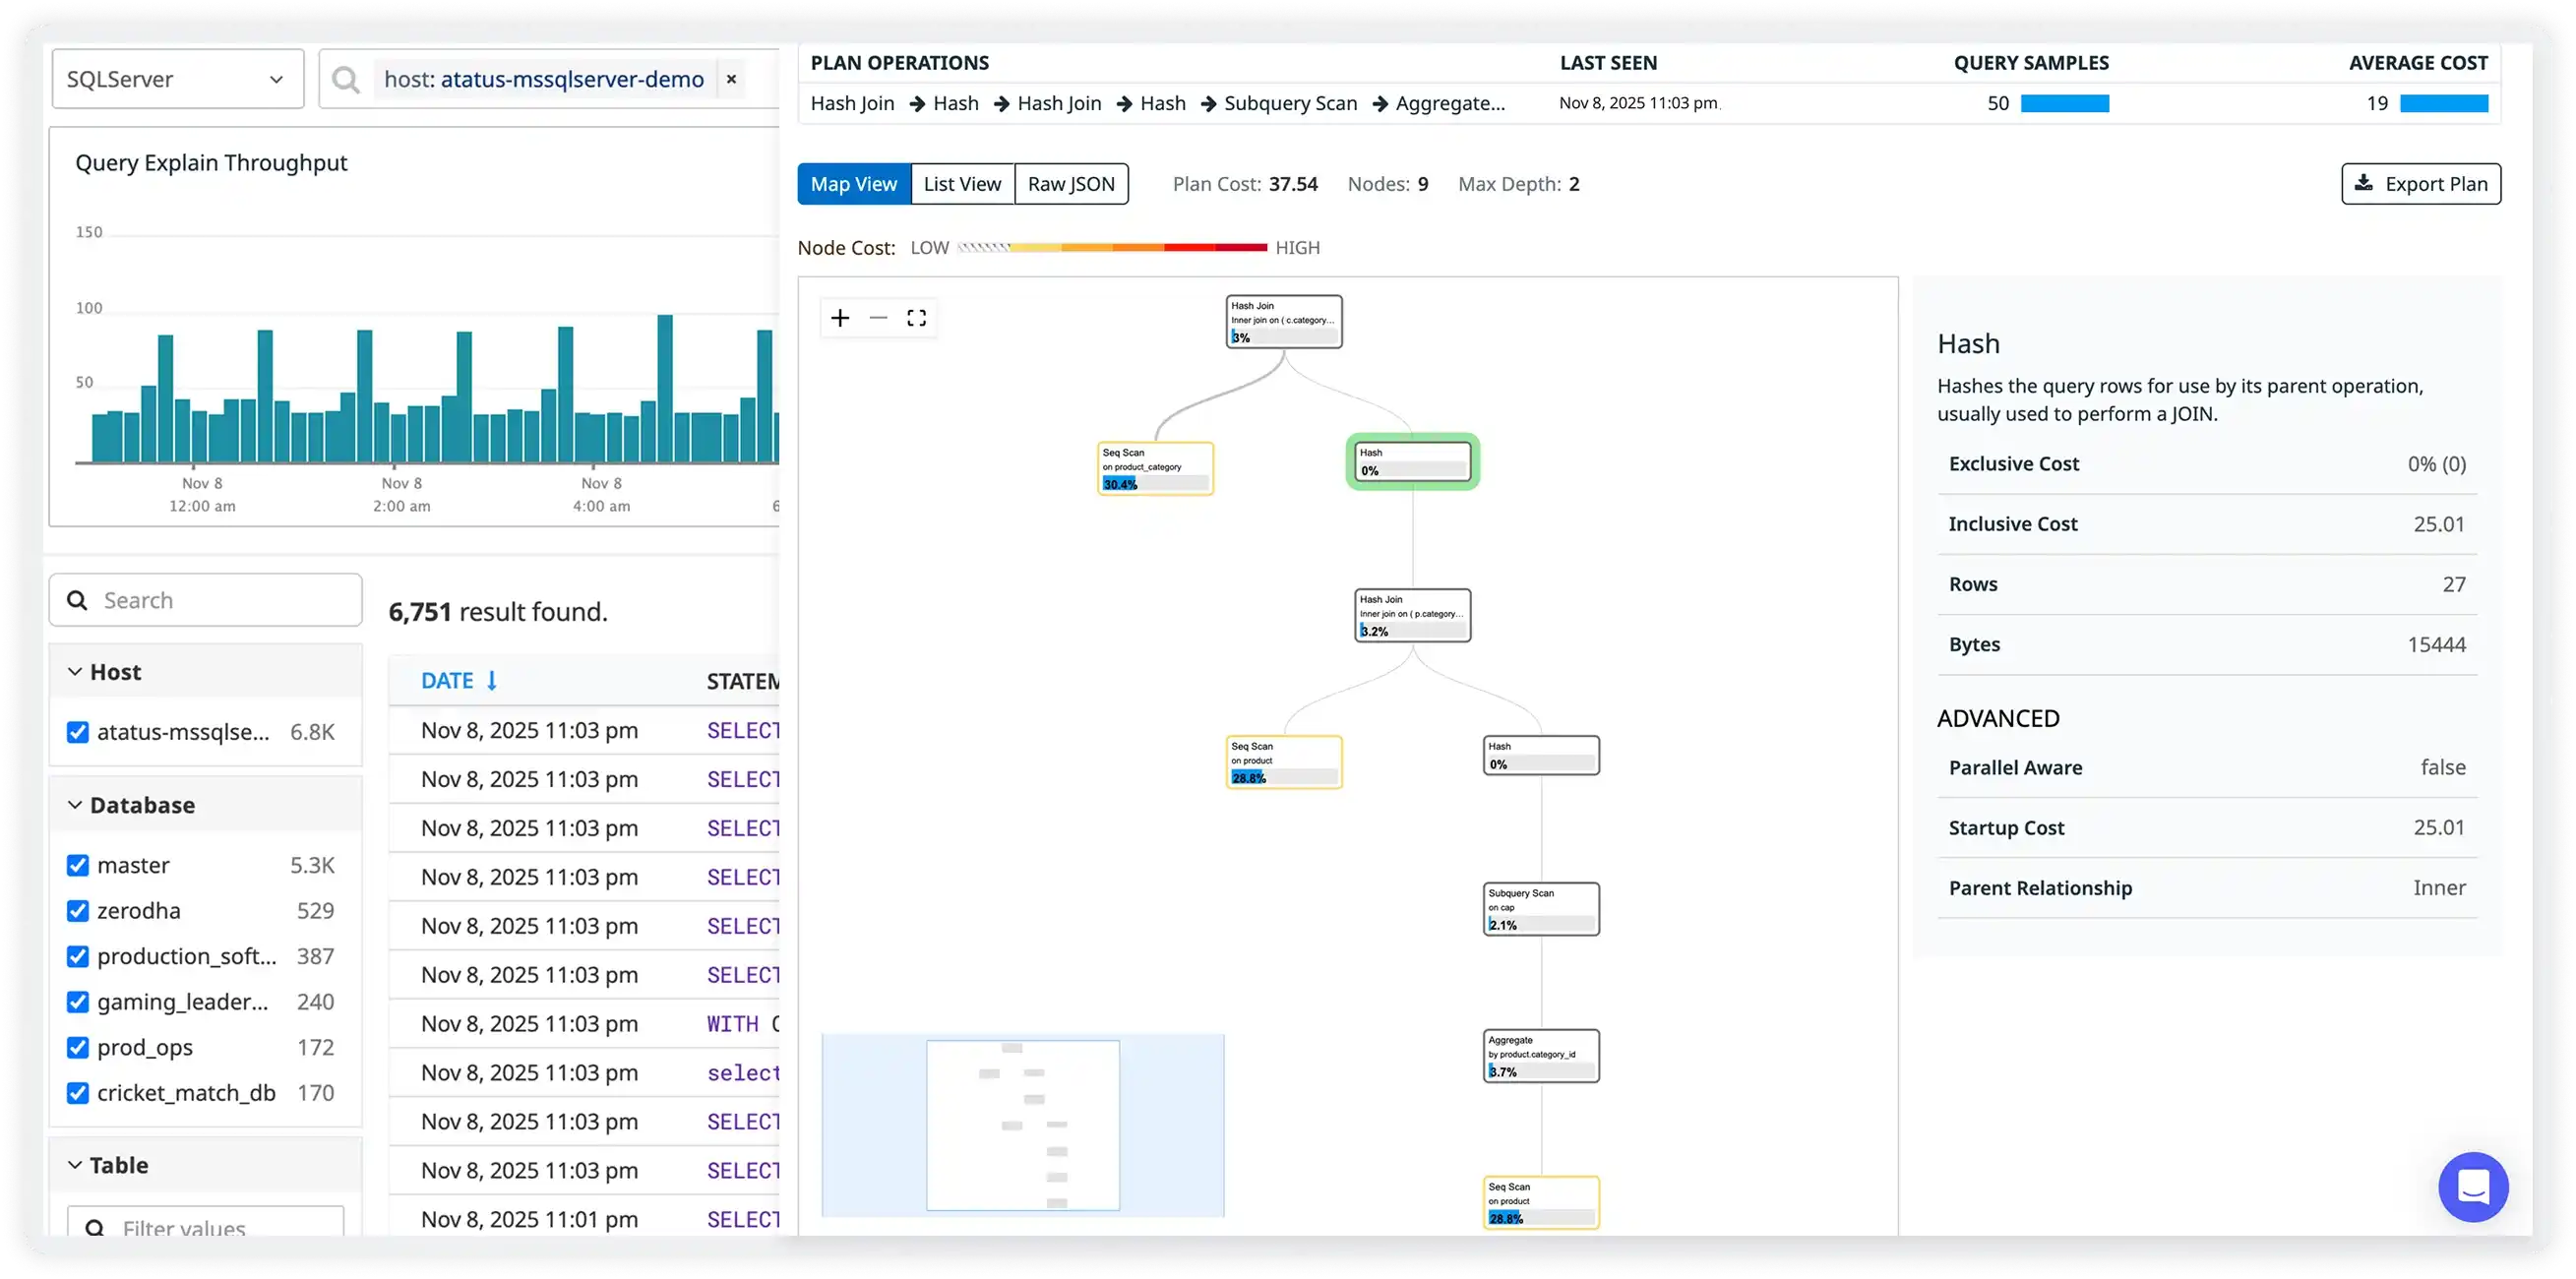
Read an explain plan in seconds.
Know what needs a restart.
Pick an engine. For PostgreSQL, check the settings the agent needs and see which ones restart your database.
SHOW shared_preload_libraries; SHOW track_activity_query_size; …shared_preload_librariesRequired. Without it there are no query metrics.pg_stat_statementsnot checkedstatictrack_activity_query_sizeLonger SQL is cut off and cannot be explained.4096not checkedstaticpg_stat_statements.trackIncludes statements run inside functions.allnot checkeddynamicpg_stat_statements.maxKeeps more normalized queries on a busy database.10000not checkeddynamicpg_stat_statements.track_utilitySkips PREPARE and EXPLAIN noise.offnot checkeddynamictrack_io_timingOptional. Adds block read and write timings.onnot checkeddynamicStatic settings only take effect after the database restarts. Dynamic ones apply on the next parameter group refresh.
IAM database authentication is a dynamic change and needs no reboot. --apply-immediately also applies every other pending change.
Sample values from one RDS instance
Database Monitoring, screen by screen.
Real screens from the Atatus app.
Powering better performance for modern teams
"Solid Product even better support." The integration path is incredibly simple/easy and the overall interface is very intuitive. That said, I had a handful of odd use cases that the support team was incredibly responsive in helping me work through.
Questions about database monitoring
Pricing, deployment, data and the agent. If something is missing, a person will answer it on a demo call.
The Atatus Infrastructure Agent collects database telemetry by connecting to your database as a read-only user. It reads query statistics the database already keeps, such as pg_stat_statements in PostgreSQL, and requests explain plans through a function you create for it. Nothing runs inside your application.
Atatus uses AI to read query execution plans and point out expensive operations such as full scans or inefficient joins, with index guidance. It explains what to change and does not make changes to your database.
Database monitoring is priced per database host, and each host keeps up to 200 normalized queries. Retention is configurable by tier, so you decide how long query data is kept.
Yes. Atatus shows SQL Server deadlocks with the victim and survivor process, their queries and the locks they held and waited for. Query samples show lock waits, and replication metrics are collected for MySQL, PostgreSQL and SQL Server.
Install the Atatus Infrastructure Agent, create a read-only database user for it, and enable the settings it reads from. For PostgreSQL that means loading pg_stat_statements; some of these settings only take effect after a restart, so check them before you plan any downtime. Then point the agent at your database. Each engine and hosting option, from self-hosted to RDS, Aurora, Cloud SQL and Azure, has its own guide.
Yes. Atatus correlates database queries with application traces, logs and infrastructure metrics. APM shows the queries your code runs, and database monitoring shows the database's own side, with query samples, explain plans and locks.
Teams typically reduce time spent diagnosing database issues and improve performance through targeted query optimization. Results vary by workload, so a short pilot is recommended to measure impact.
By centralizing query behavior, execution context, and related application data, Atatus helps teams troubleshoot issues faster without switching between tools.