API Slowness Causes Timeouts
“Our mobile app times out randomly, but we don't know which API endpoint is slow or why it's happening.”
When APIs fail, your entire app suffers. Track endpoint performance, monitor third-party service reliability, and catch rate limits before they hit, so your users never see a 500 error or loading spinner that never ends.
Real problems experienced by teams like yours every day
“Our mobile app times out randomly, but we don't know which API endpoint is slow or why it's happening.”
“Payment gateways, authentication services, or data providers fail, and we only find out when customers can't complete actions.”
“We have dozens of microservices calling each other, and when something breaks, we waste hours finding the root cause.”
“We see 500 errors in logs but have no idea what user action triggered them, making debugging a nightmare.”
Measurable improvements across your DevOps workflows and business metrics
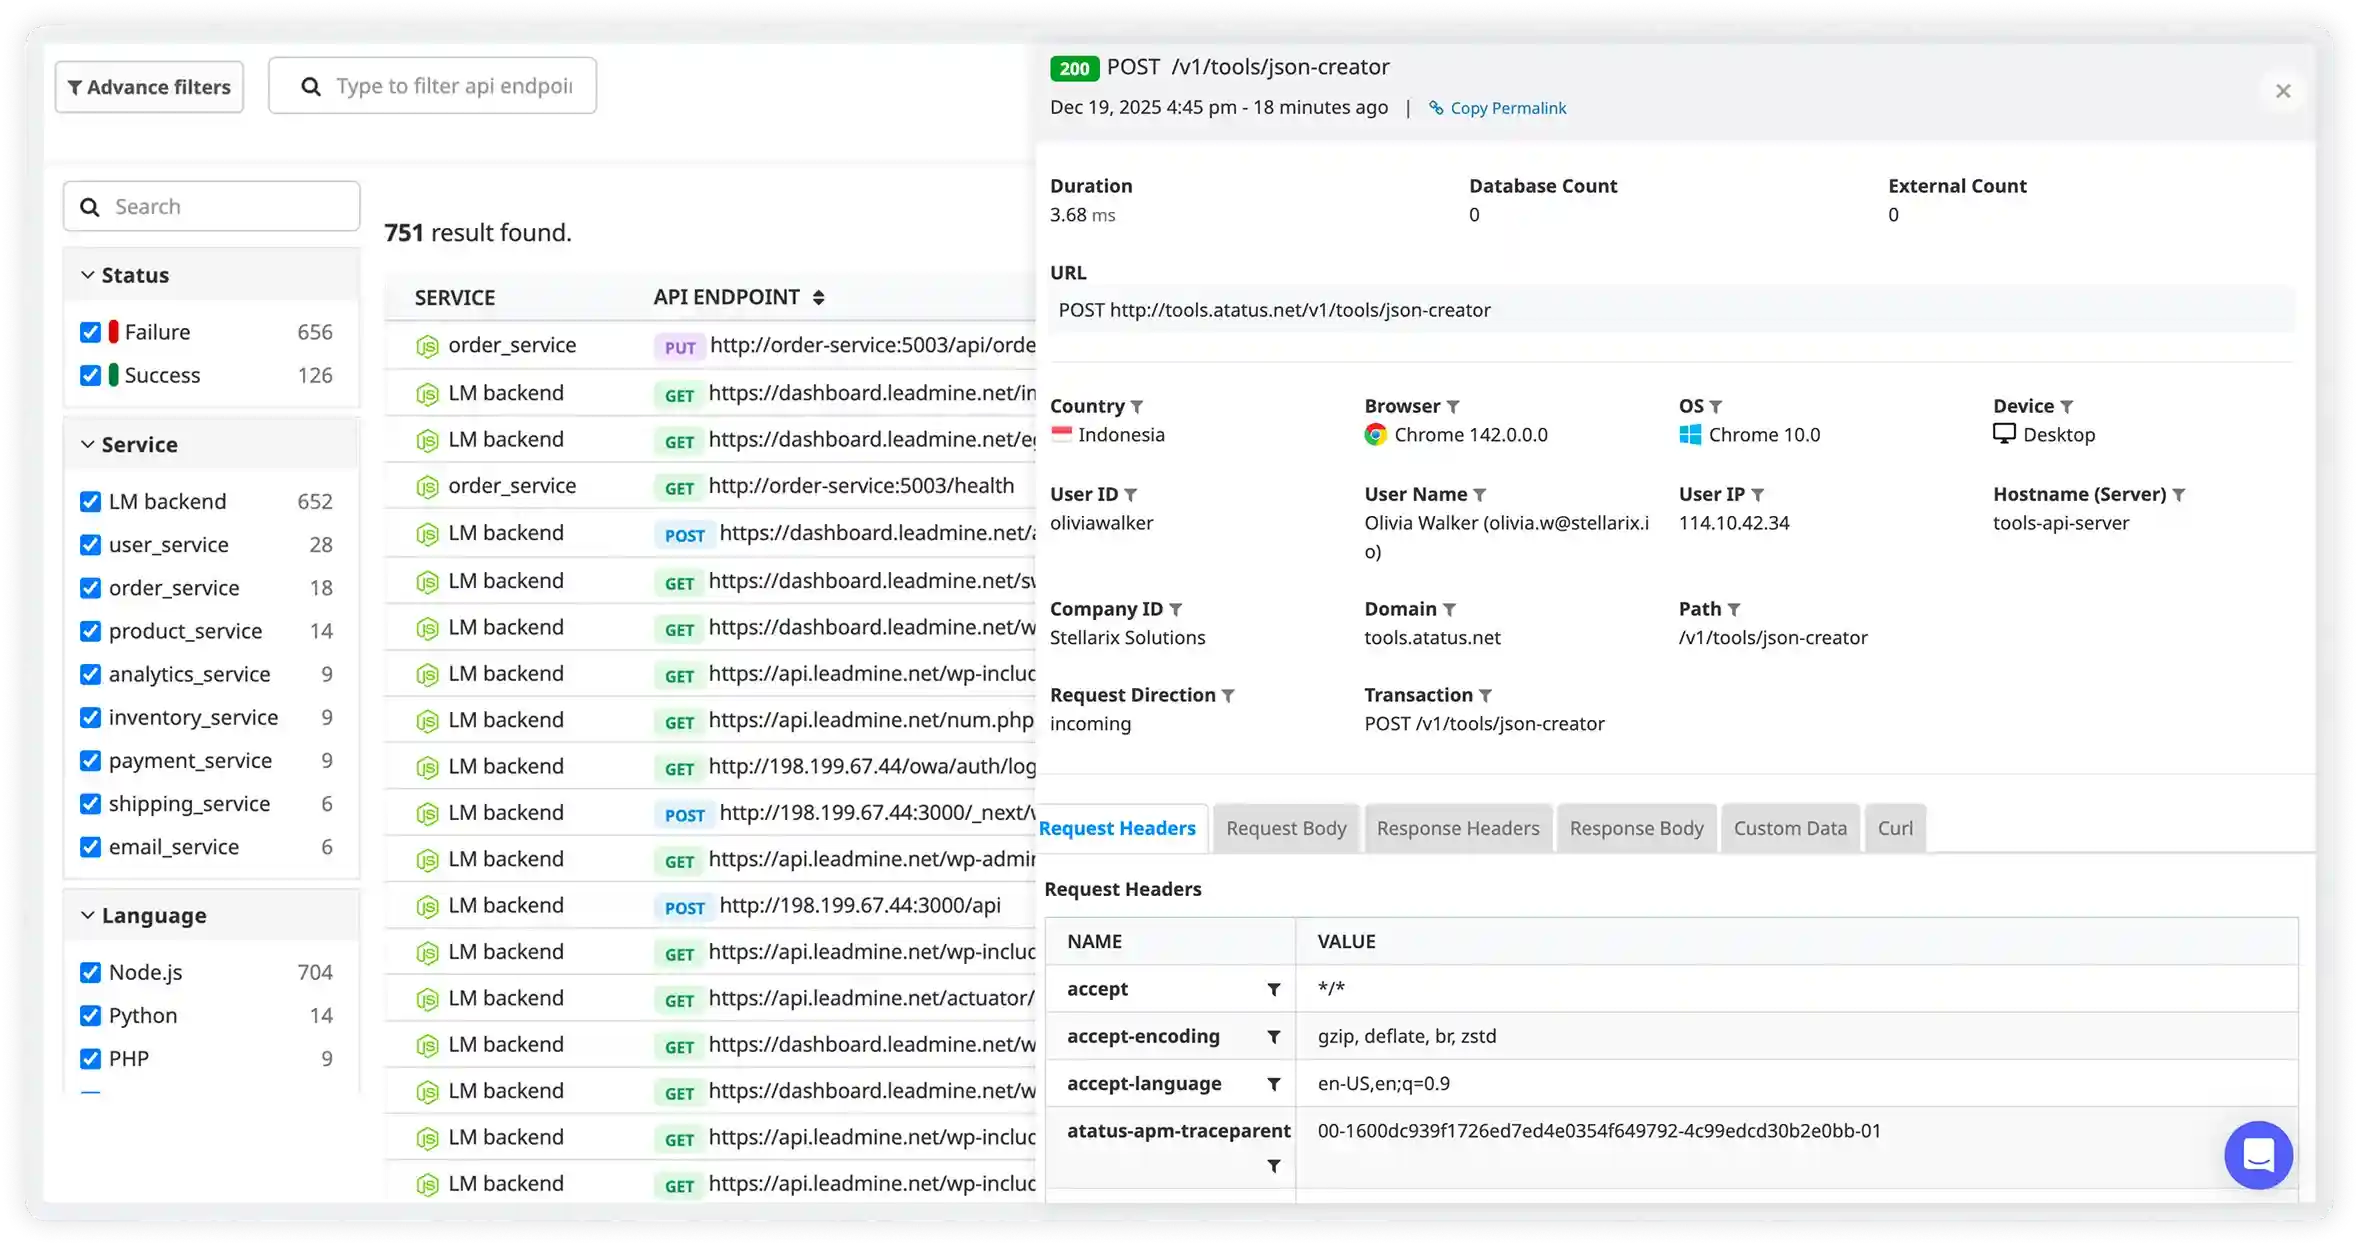
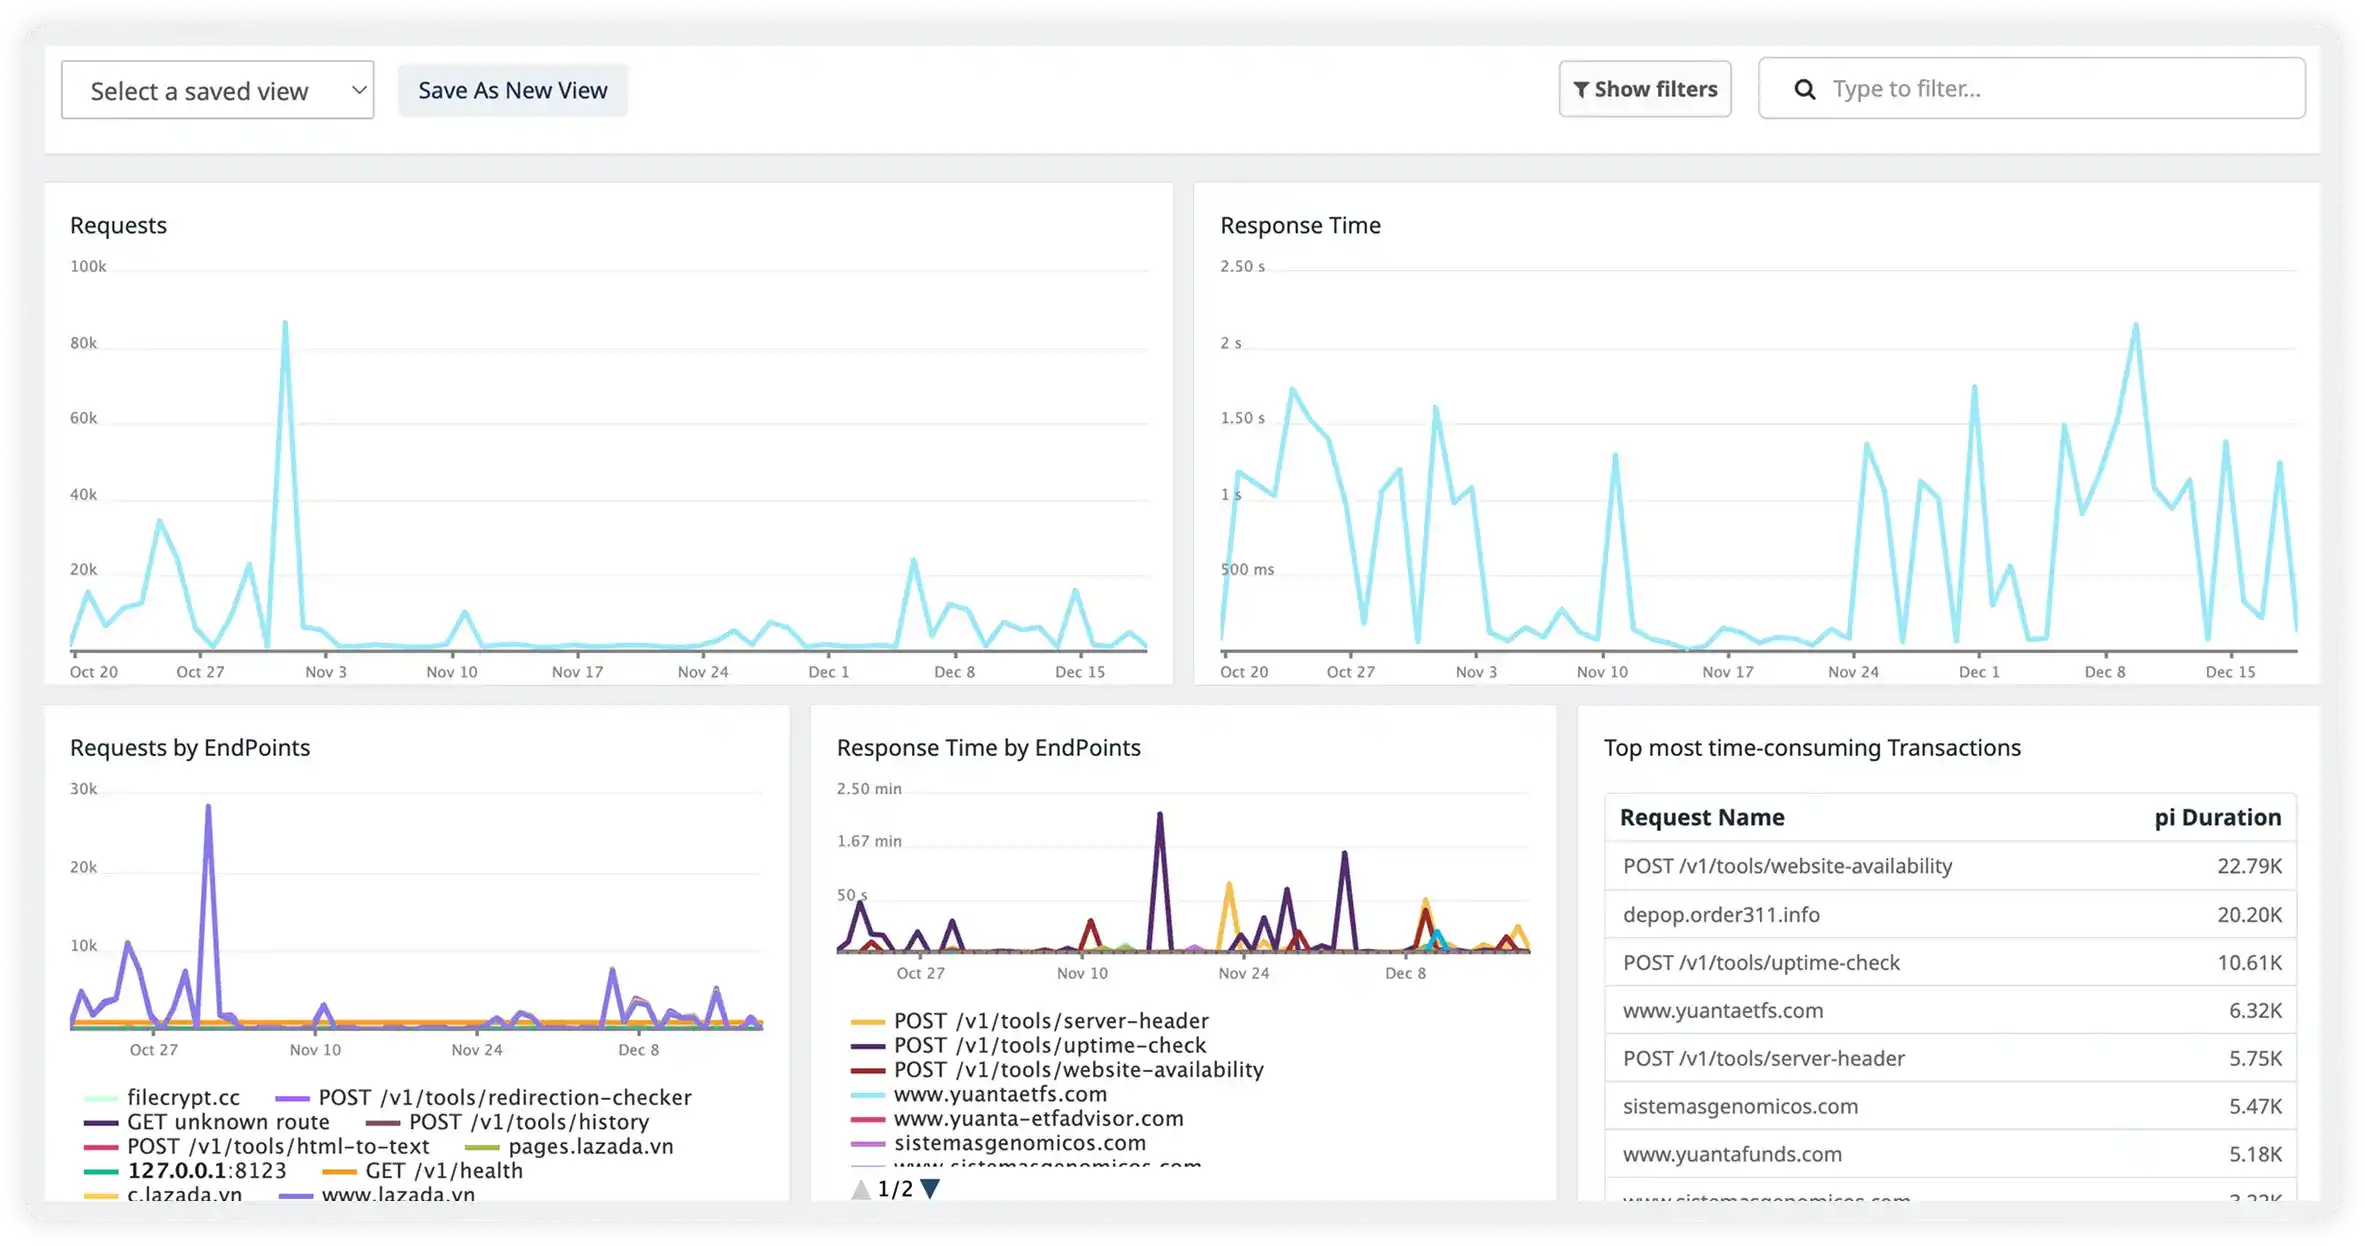
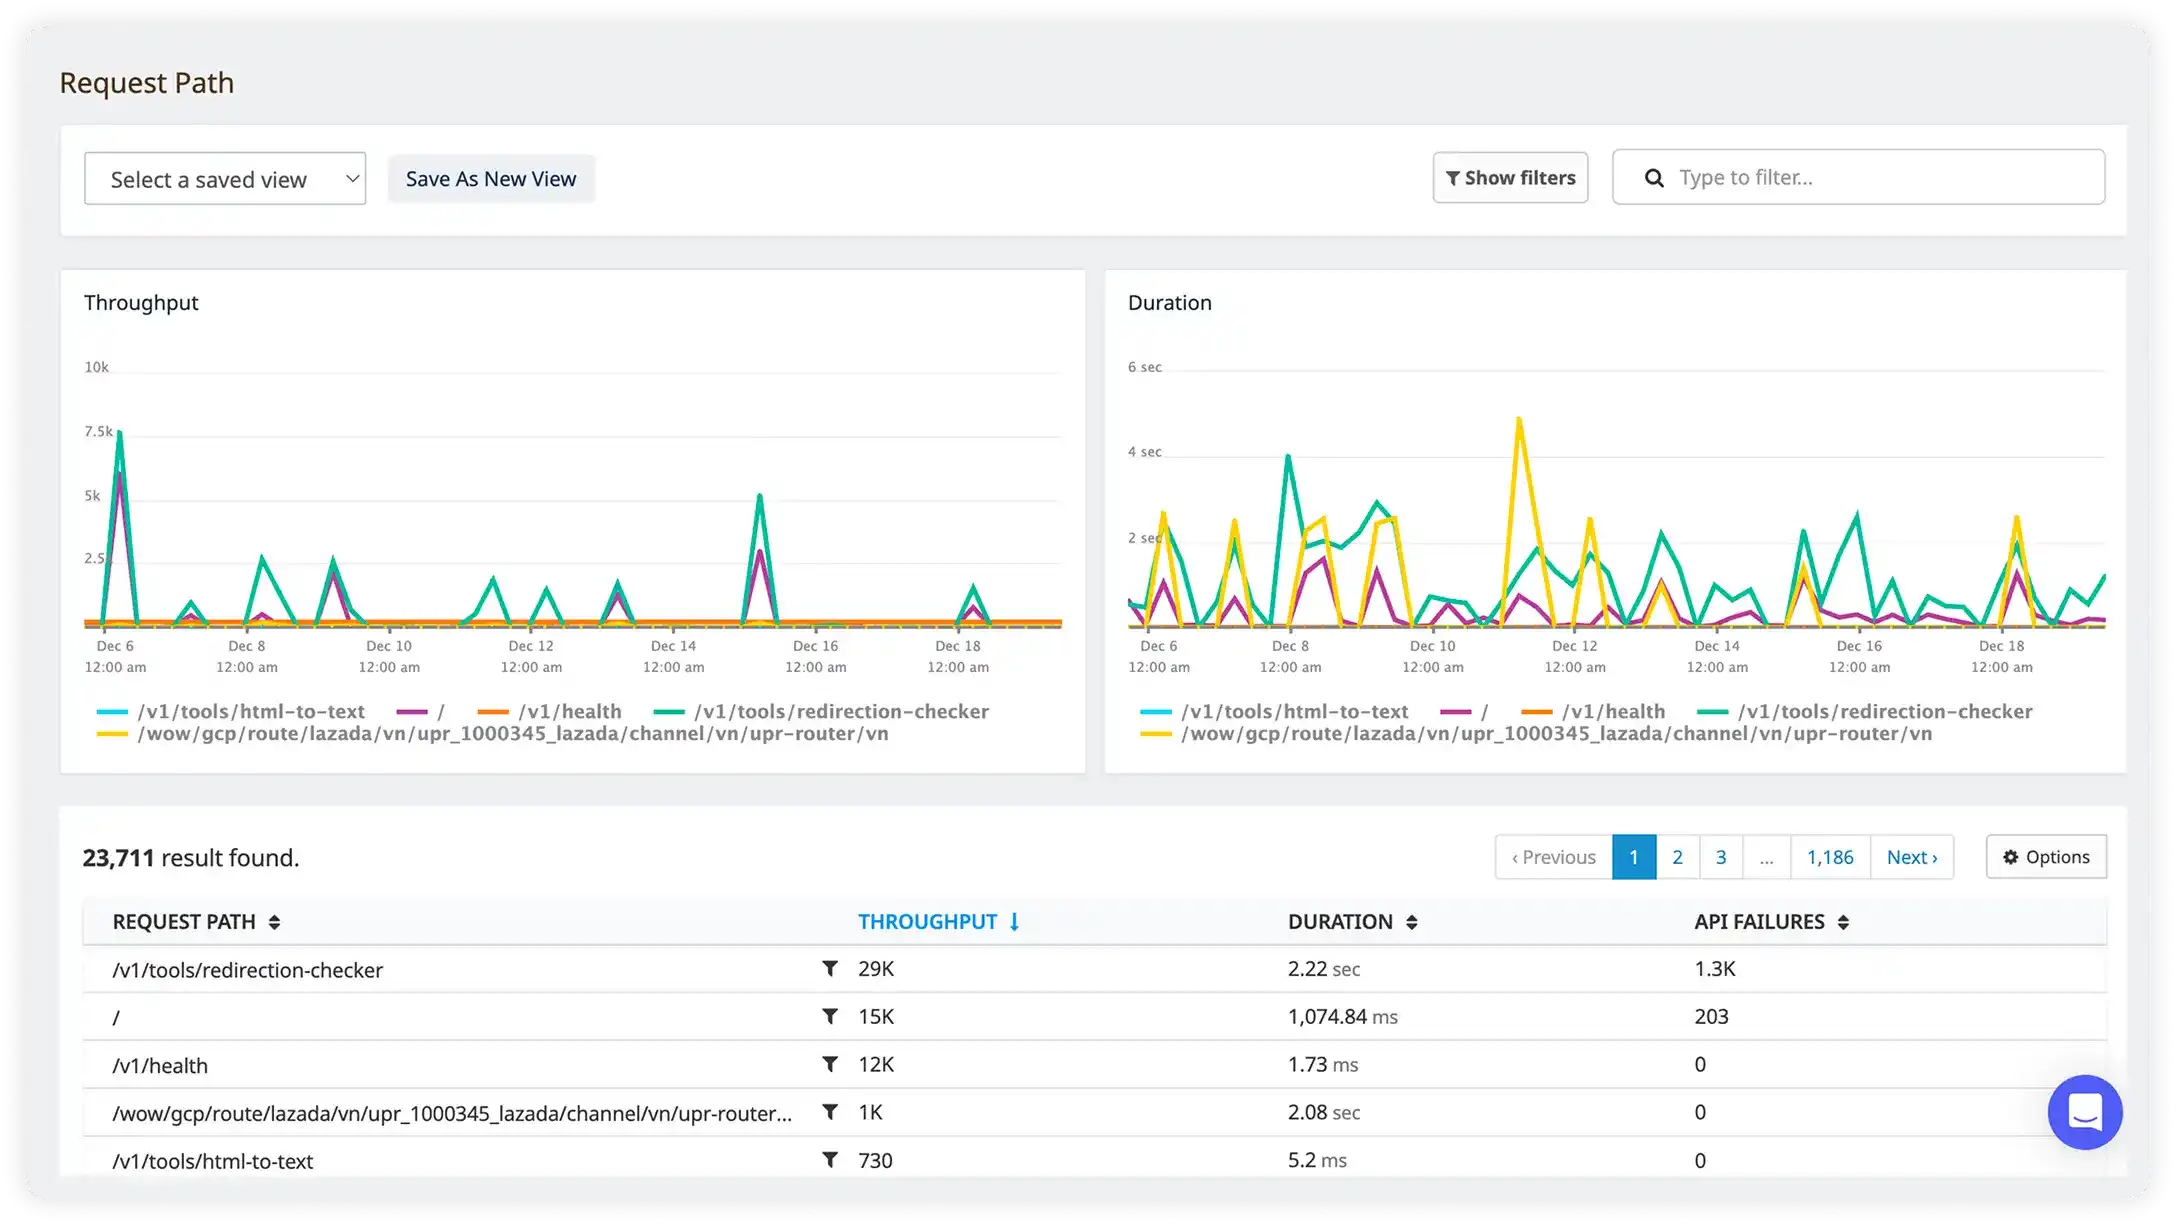
Distributed tracing shows the complete journey of each API call through your microservices with latency breakdown.
Track response times, error rates, and availability of external APIs you depend on with automatic alerts.
Capture request payloads, headers, user IDs, and custom metadata to debug issues without guessing.
Atatus adapts to how engineering teams work across development, operations, and reliability.
Debug errors and slow paths with the full context of what happened.
Atatus for developersTrack deployments and see how each release affects stability.
Atatus for DevOpsWatch latency and error rates to ship with less production risk.
Atatus for release engineers"Solid Product even better support." The integration path is incredibly simple/easy and the overall interface is very intuitive. That said, I had a handful of odd use cases that the support team was incredibly responsive in helping me work through.
Pricing, deployment, data and the agent. If something is missing, a person will answer it on a demo call.
API timeouts happen when backend services take too long to respond - often due to slow database queries, external API dependencies timing out, or servers hitting resource limits. Atatus shows you exactly which dependency is causing delays.
Distributed tracing visualizes the entire request flow. See if timeouts come from your database (slow joins on large tables), third-party APIs (payment processors, geolocation services), or overloaded microservices. Fix the slowest component first to restore performance.
Atatus tracks all external API calls (payment gateways, shipping APIs, authentication providers) and shows their response times, error rates, and reliability. Compare third-party API performance side-by-side.
See which vendors consistently have high latency or frequent failures. Set SLA-based alerts when third-party APIs exceed acceptable response times (e.g., Stripe payment API > 2s). Make informed decisions about which providers to use or when to implement fallbacks.
Yes, Atatus provides detailed API usage analytics. See request counts, unique users, and traffic patterns for each endpoint. Identify your most critical APIs that need the most reliability.
Track endpoint popularity over time. See if certain features are growing in usage. Prioritize performance optimizations for high-traffic endpoints. Make data-driven decisions about which APIs to deprecate or invest more resources in.
Monitor your API request rates in real-time and set alerts before hitting rate limits. Track requests per minute/hour for each client or API key. See usage patterns that approach your limits.
Identify which clients or features are consuming the most quota. Implement client-side throttling or caching based on actual usage data. Get alerts when approaching 80% of rate limits so you can proactively adjust before users get errors.
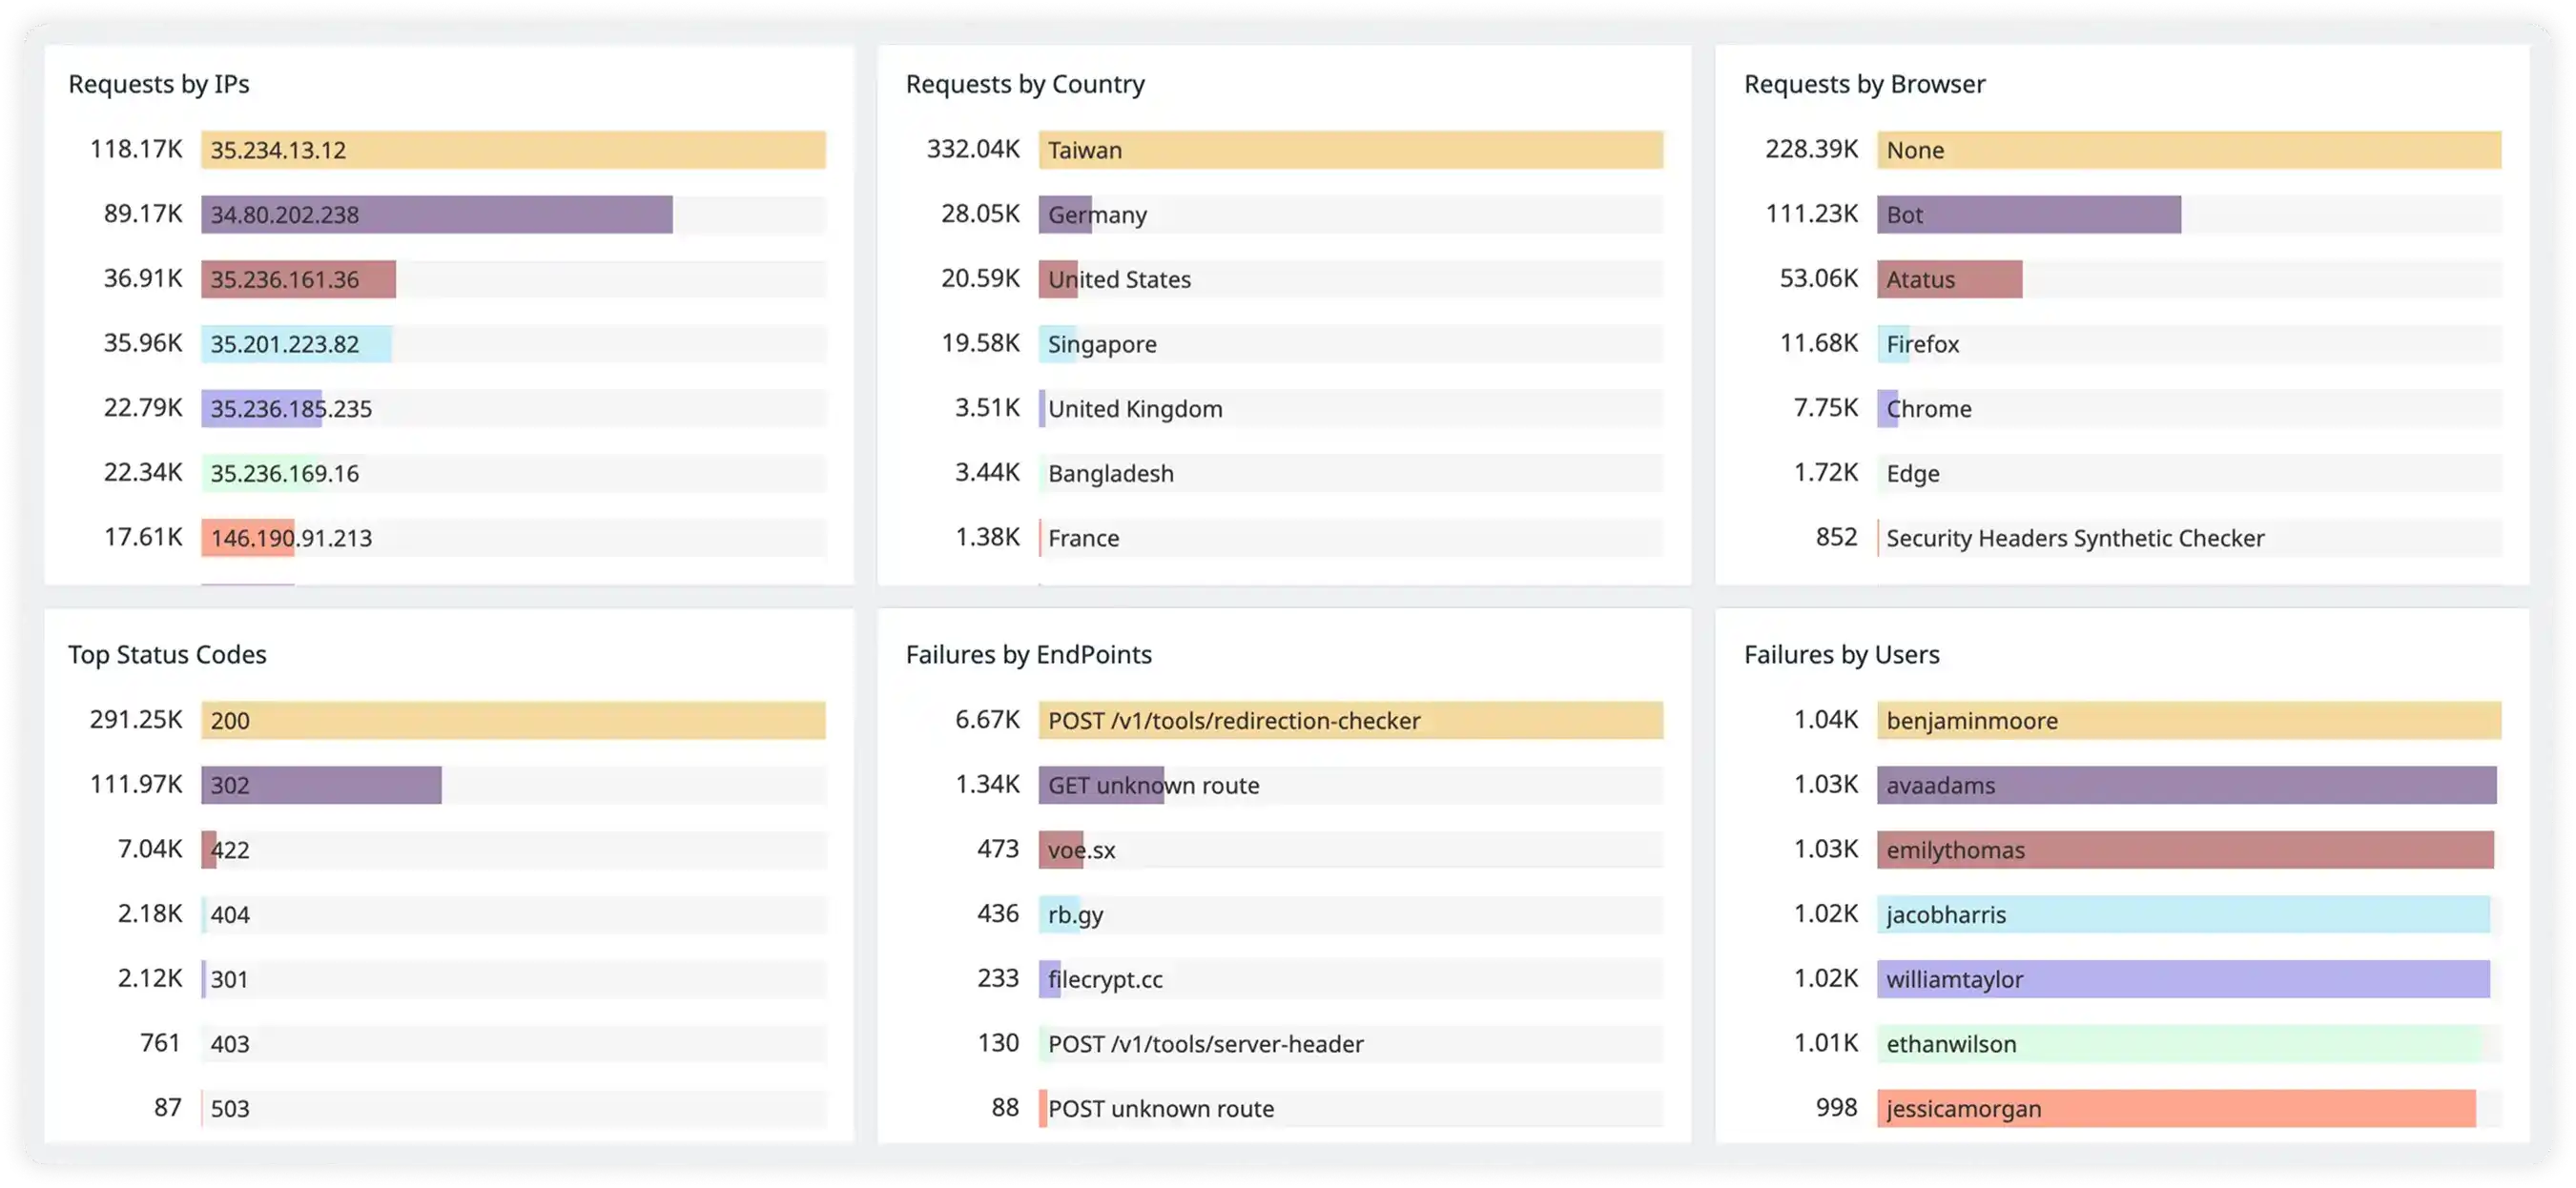
Intermittent 500 errors usually stem from race conditions, resource exhaustion, or flaky dependencies. Atatus captures every error with full context: request payload, user, timestamp, and stack trace.
See patterns in when errors occur (high traffic periods, specific endpoints, certain user types). Track error rates over time to detect if issues are getting worse. Distributed tracing shows exactly which service in your stack is throwing the error.
Yes, Atatus shows API latency broken down by geographic region. See if users in certain locations experience slower response times due to network distance or regional infrastructure issues.
Compare API performance across US, EU, Asia-Pacific, etc. Identify if you need regional CDNs or database replicas. Make informed decisions about where to deploy new infrastructure to serve global customers better.
Atatus uses lightweight, asynchronous instrumentation that adds negligible overhead (typically < 5ms). Monitoring data is batched and sent to Atatus in the background, not in the request path.
Our SDKs are optimized for production use. No impact on your API response times. Sampling options let you monitor a percentage of traffic for high-volume APIs if needed. Get full observability without sacrificing performance.
Start free and send your first trace with OpenTelemetry or the Atatus agents. APM, logs, RUM, infrastructure and SIEM, all on one timeline.