Can't Find Where Requests Are Slowing Down
“Requests touch 10+ microservices. We see the total latency but have no idea which service is causing the bottleneck.”
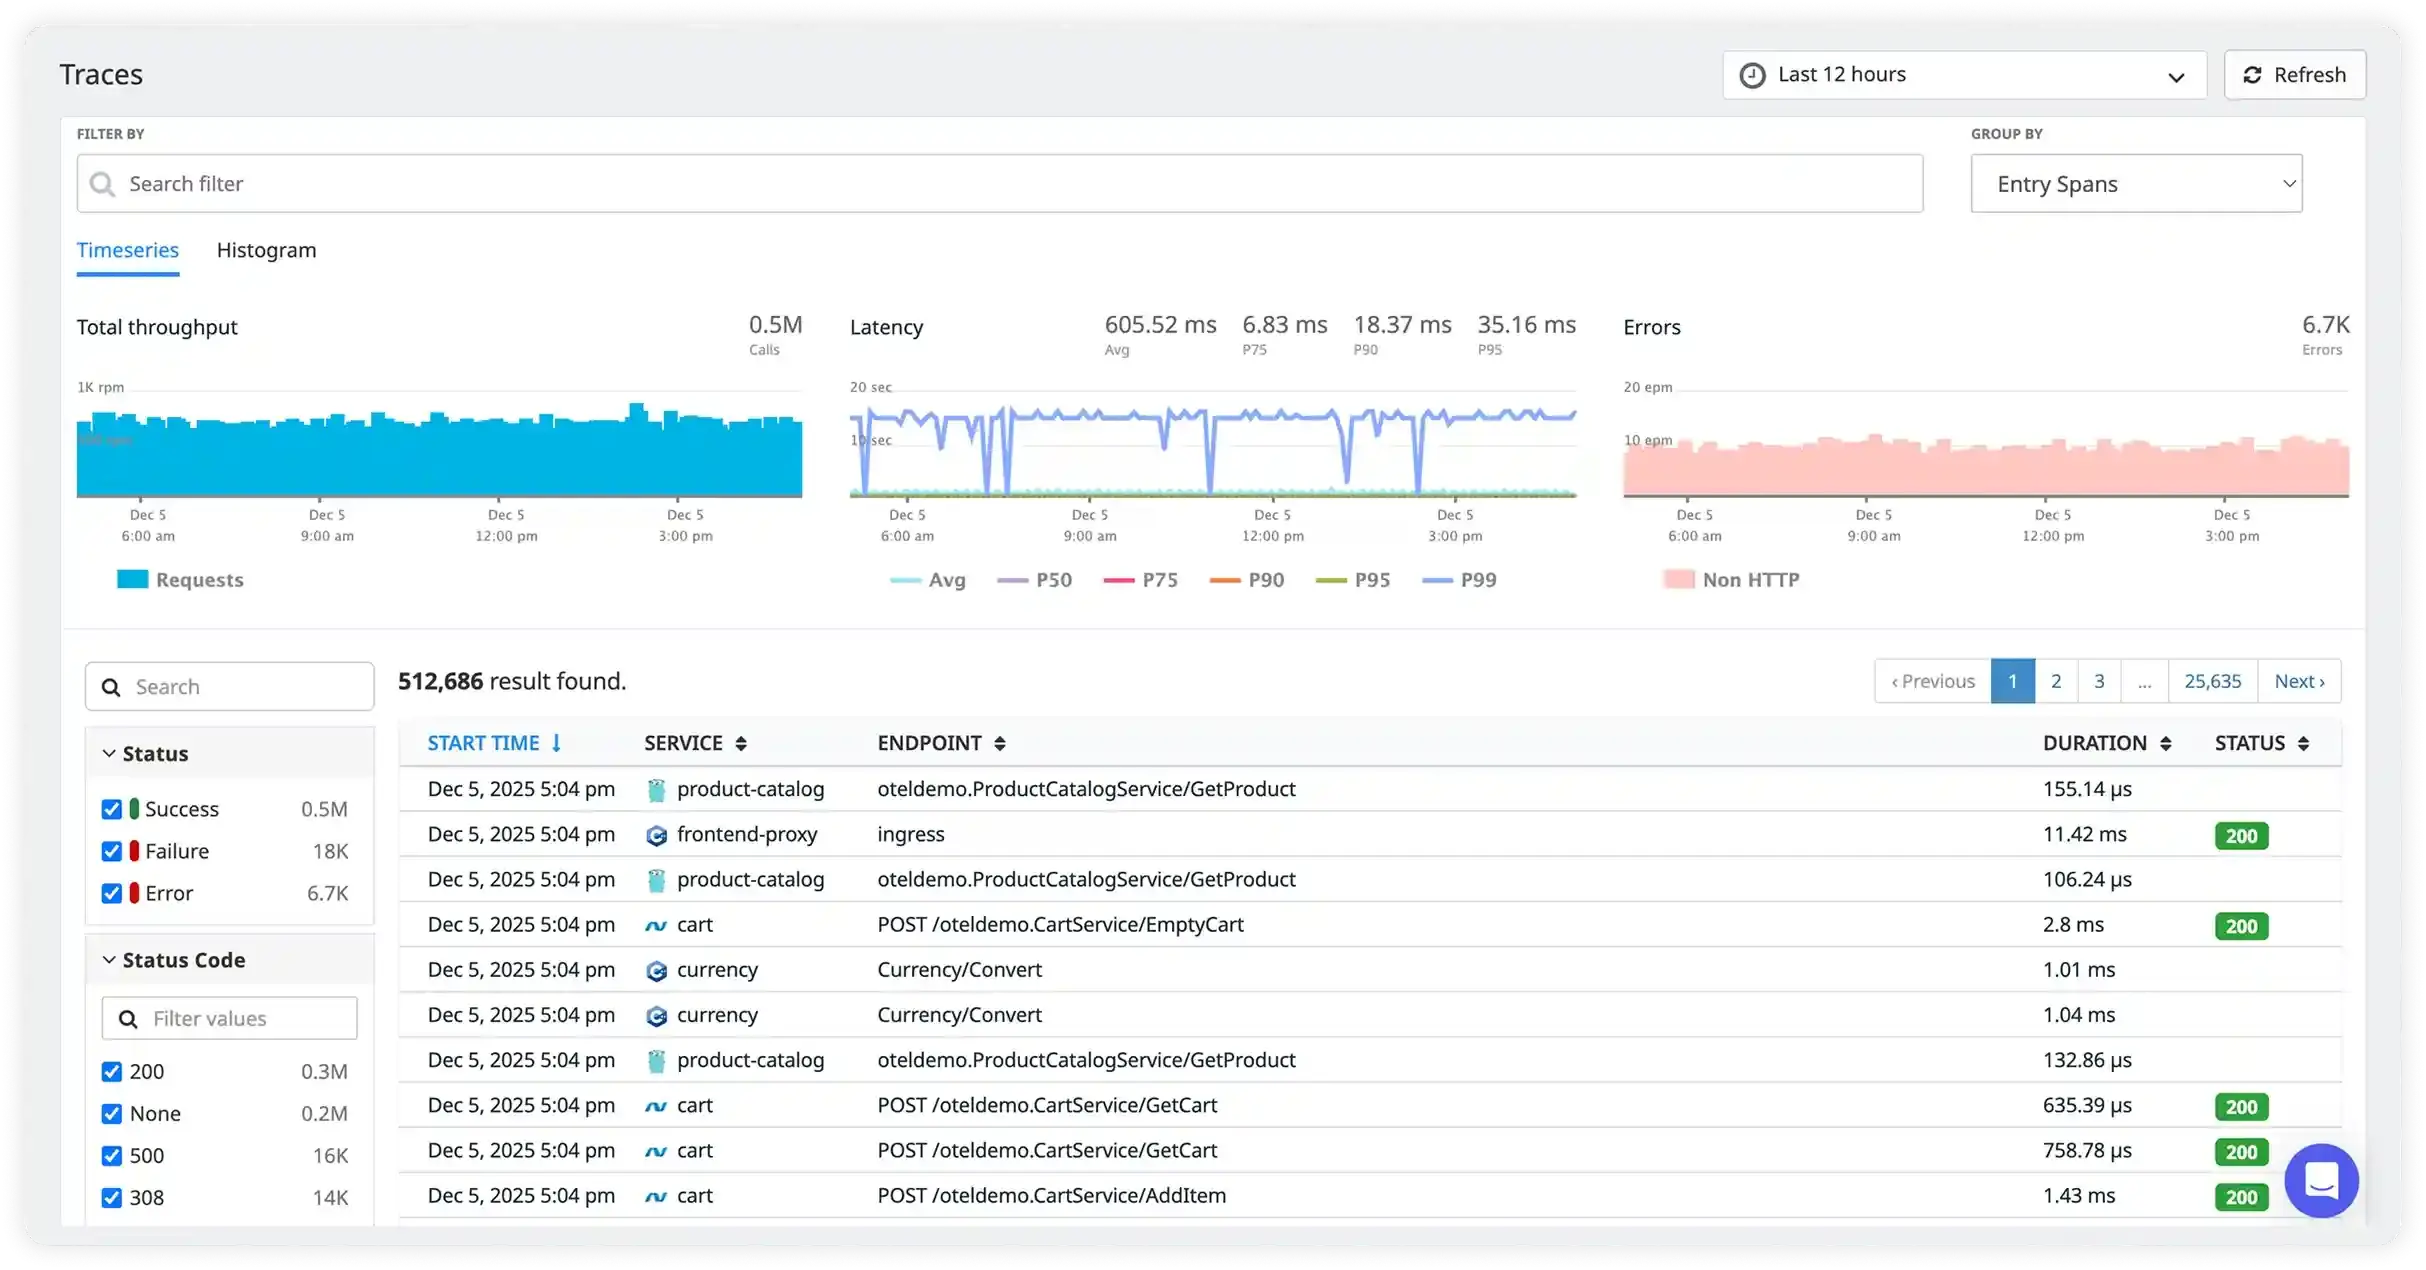
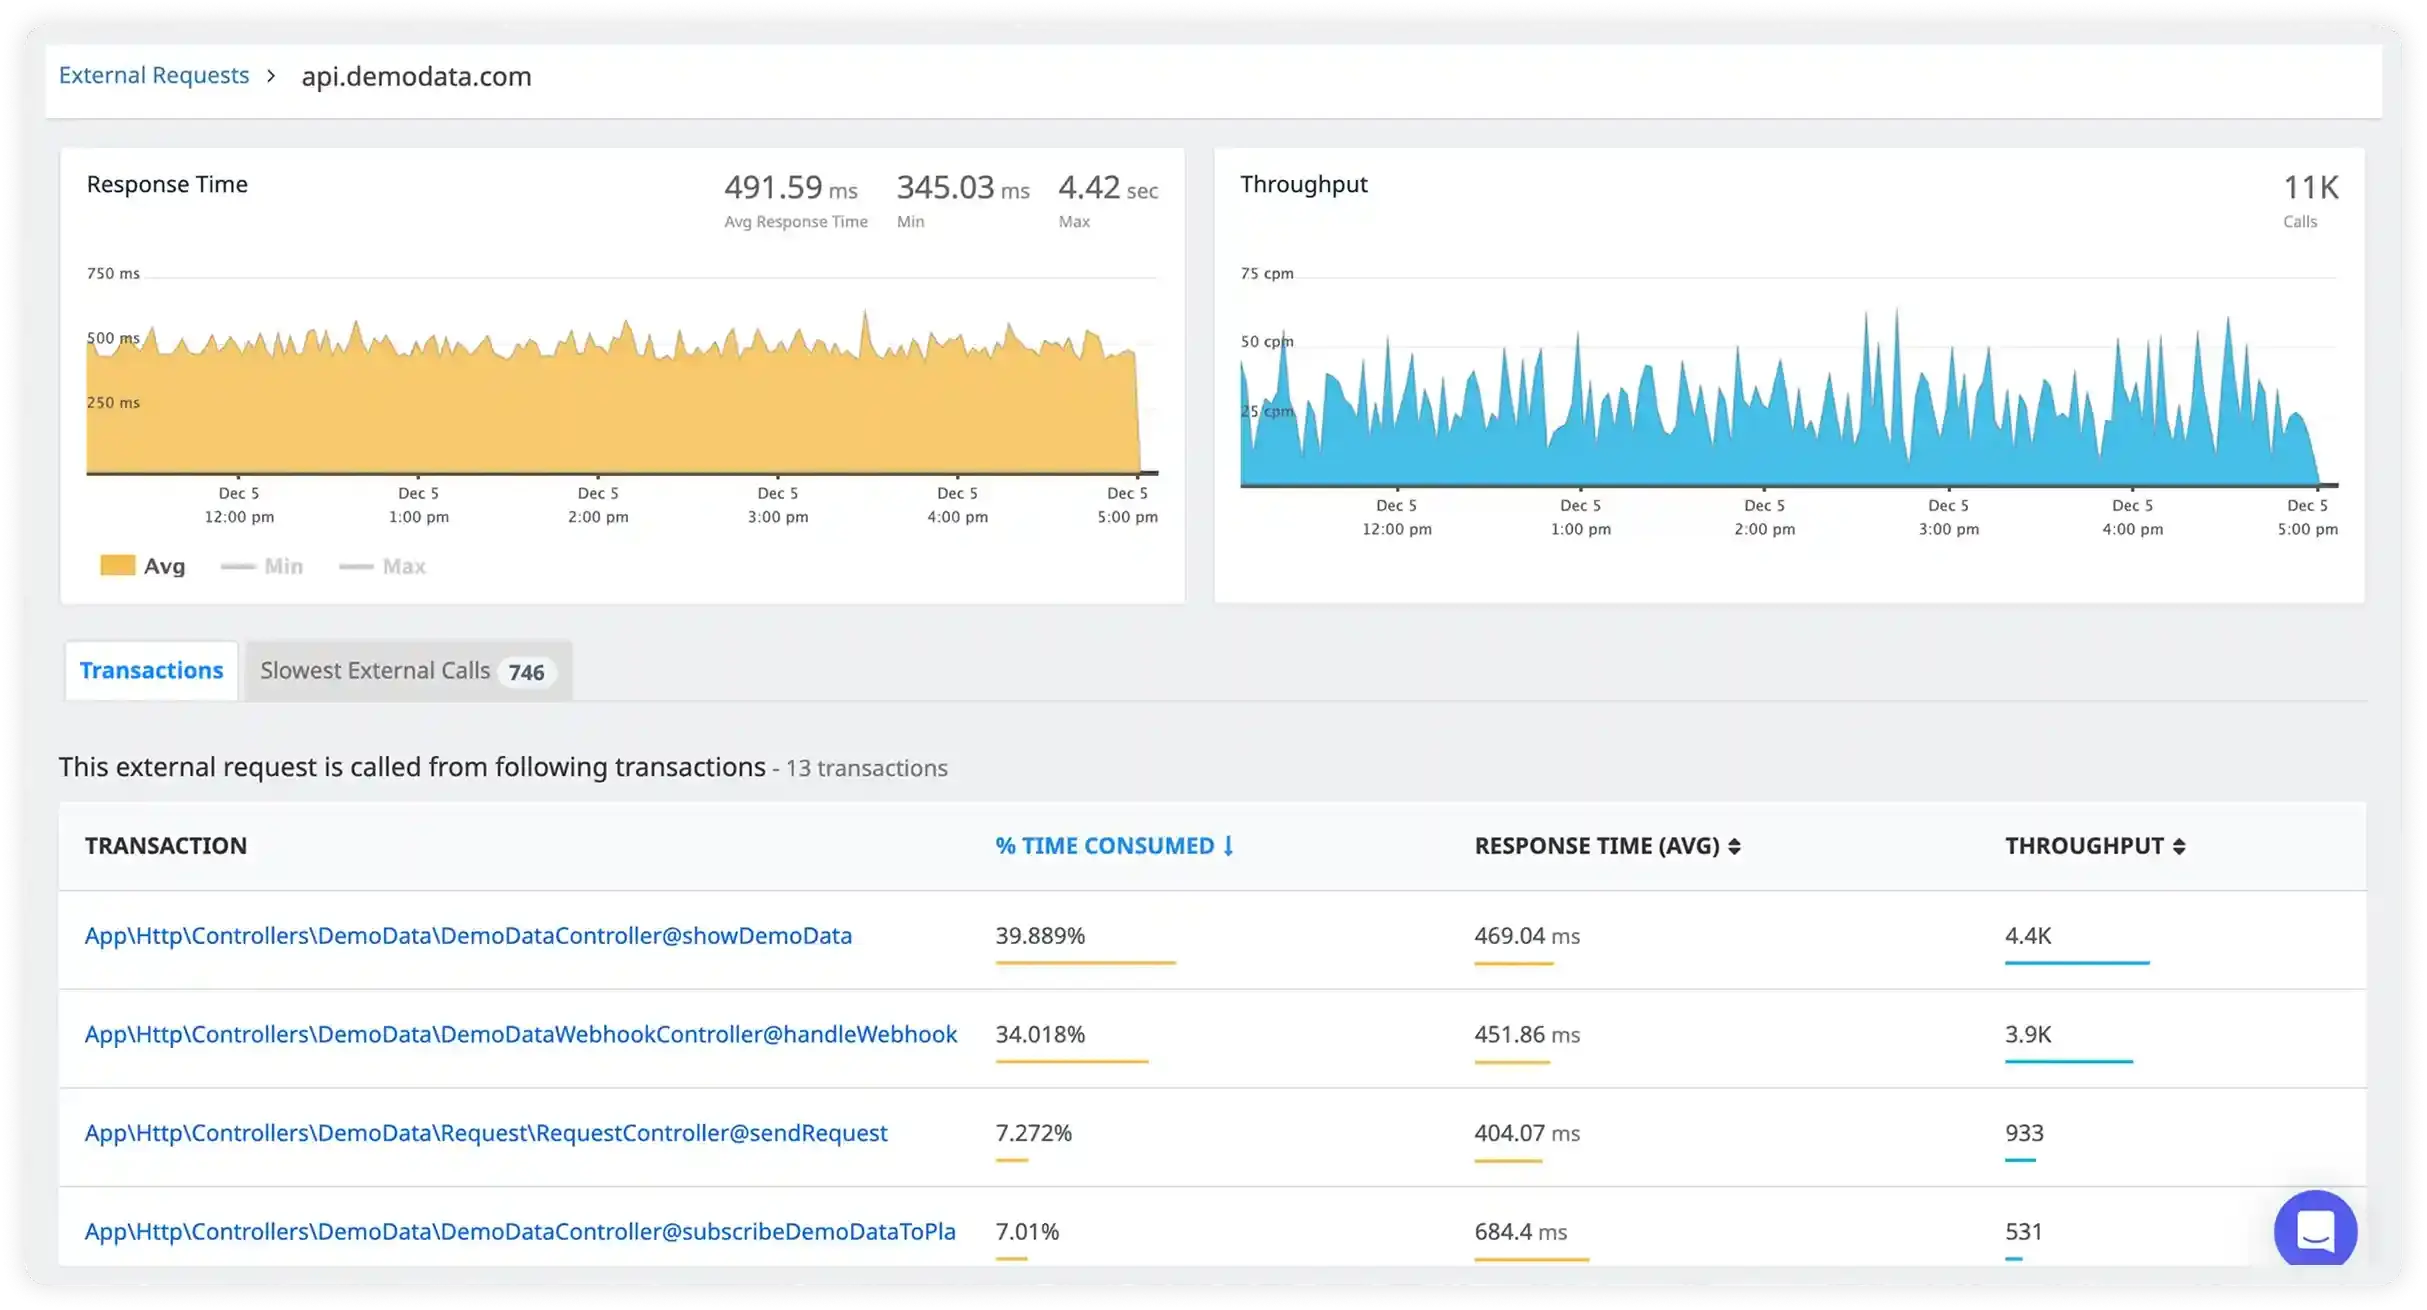
Collects and aggregates trace data from various endpoints to provide a comprehensive view of request flows from frontend devices to backend services and databases, including detailed timing information, service dependencies, and contextual logs.
Real problems experienced by teams like yours every day
“Requests touch 10+ microservices. We see the total latency but have no idea which service is causing the bottleneck.”
“An error shows up in Service E, but the root cause is actually in Service A. We waste hours debugging the wrong service.”
“We know a service is slow, but we can't see which database queries, external APIs, or internal calls are causing the delay.”
“Customer reports slow performance, but we can't trace their specific request through the system to see what went wrong.”
Measurable improvements across your DevOps workflows and business metrics
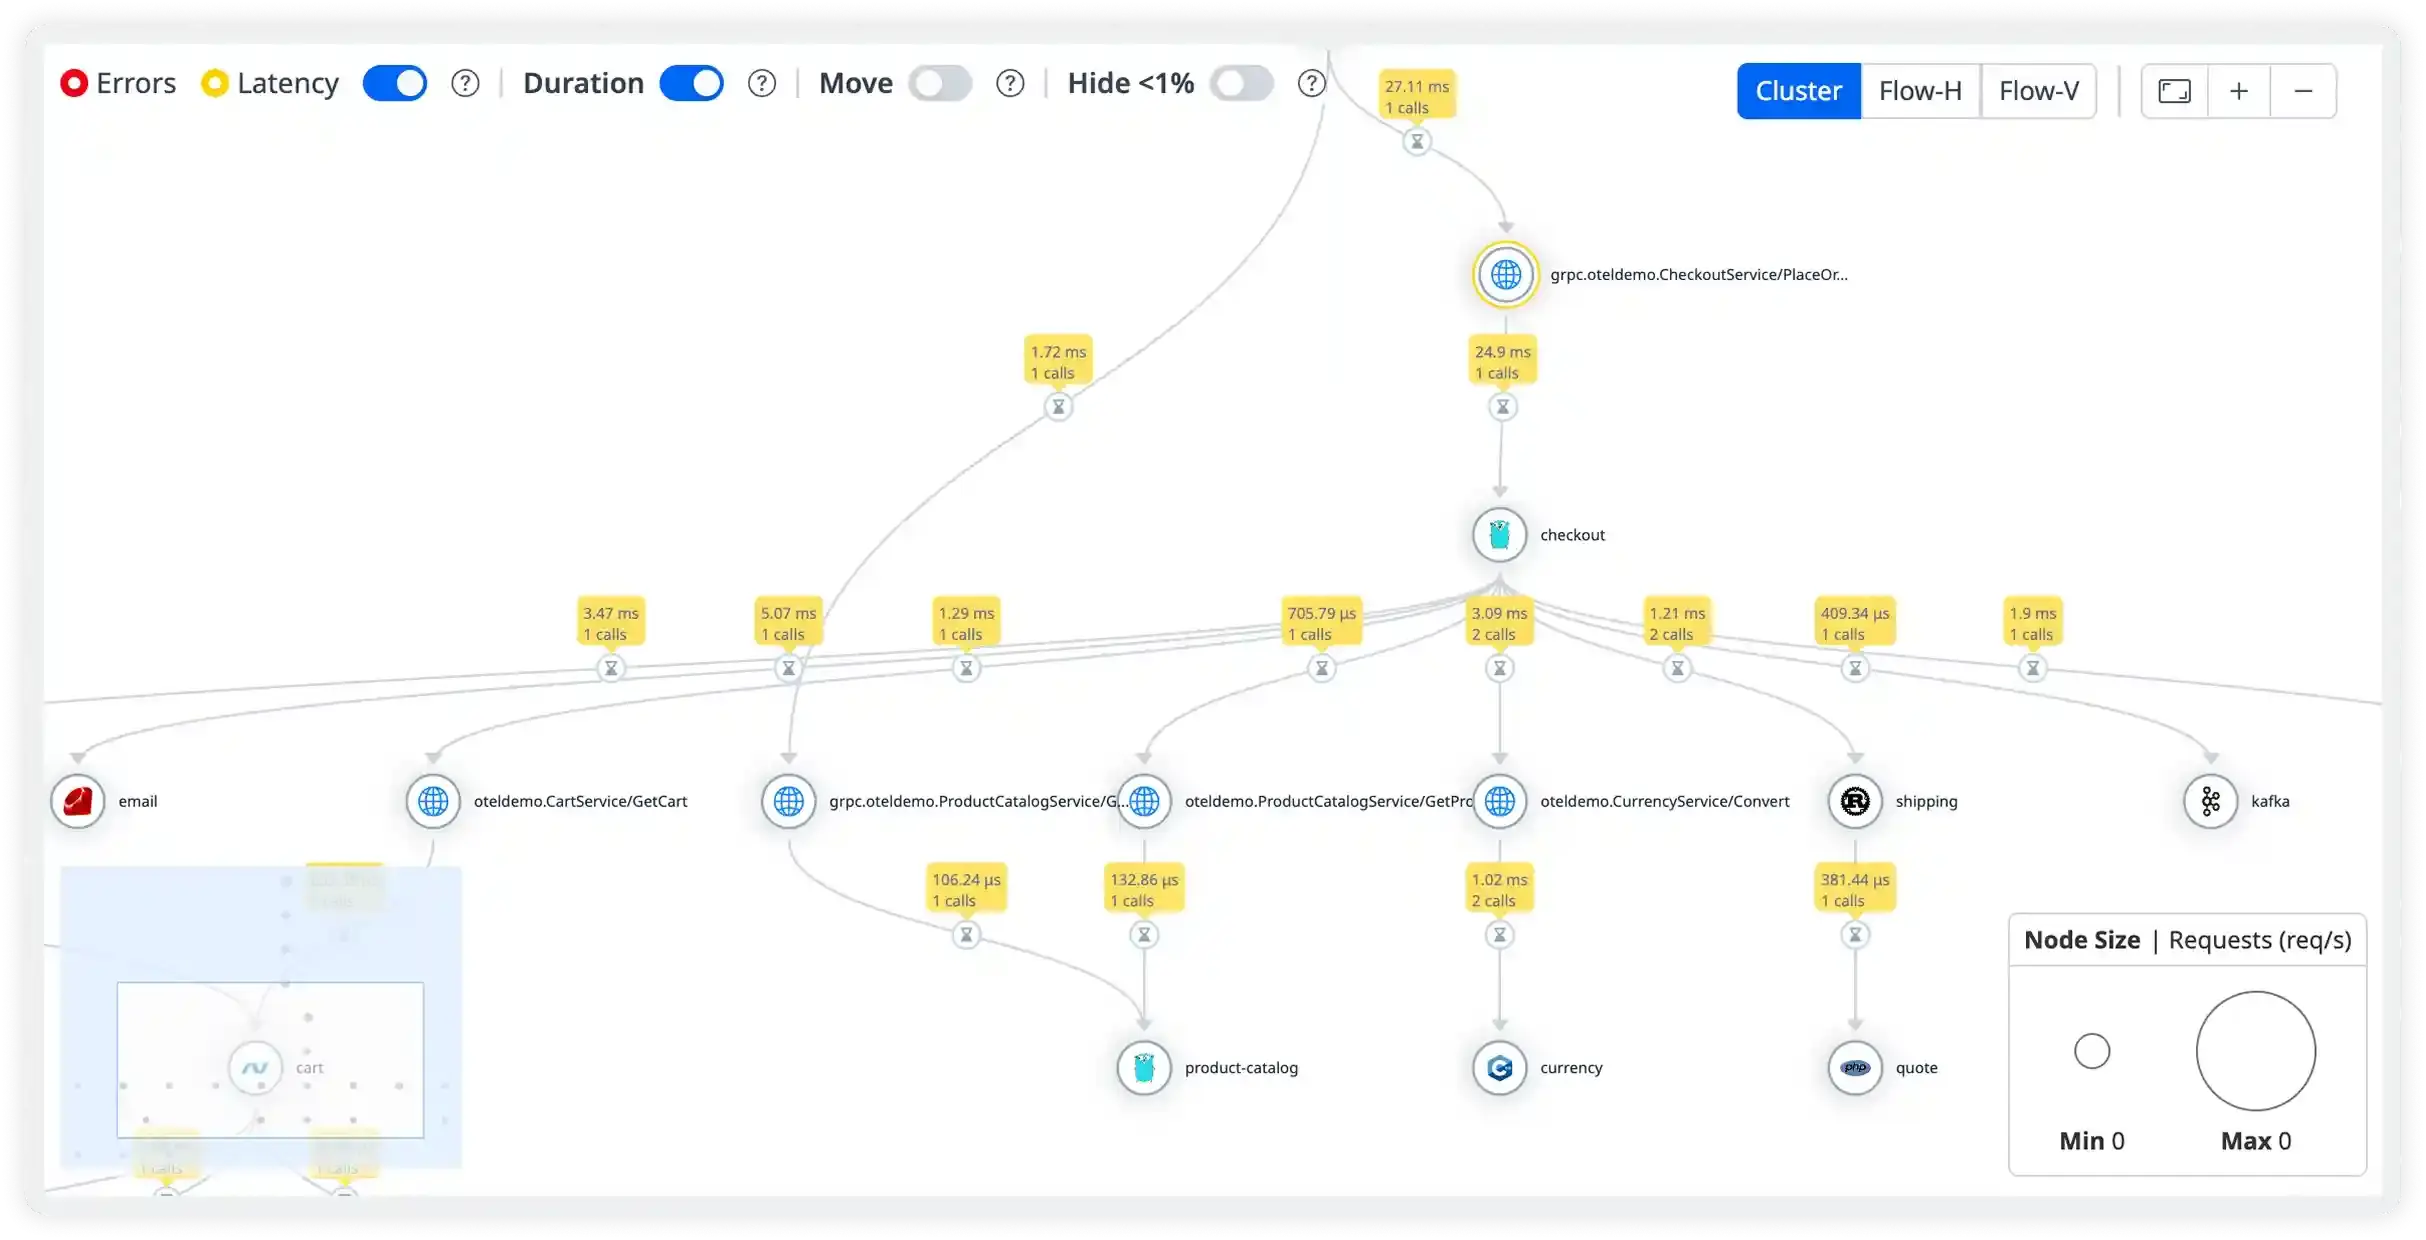
Visual service maps show request flow with latency breakdown for each hop in the chain.
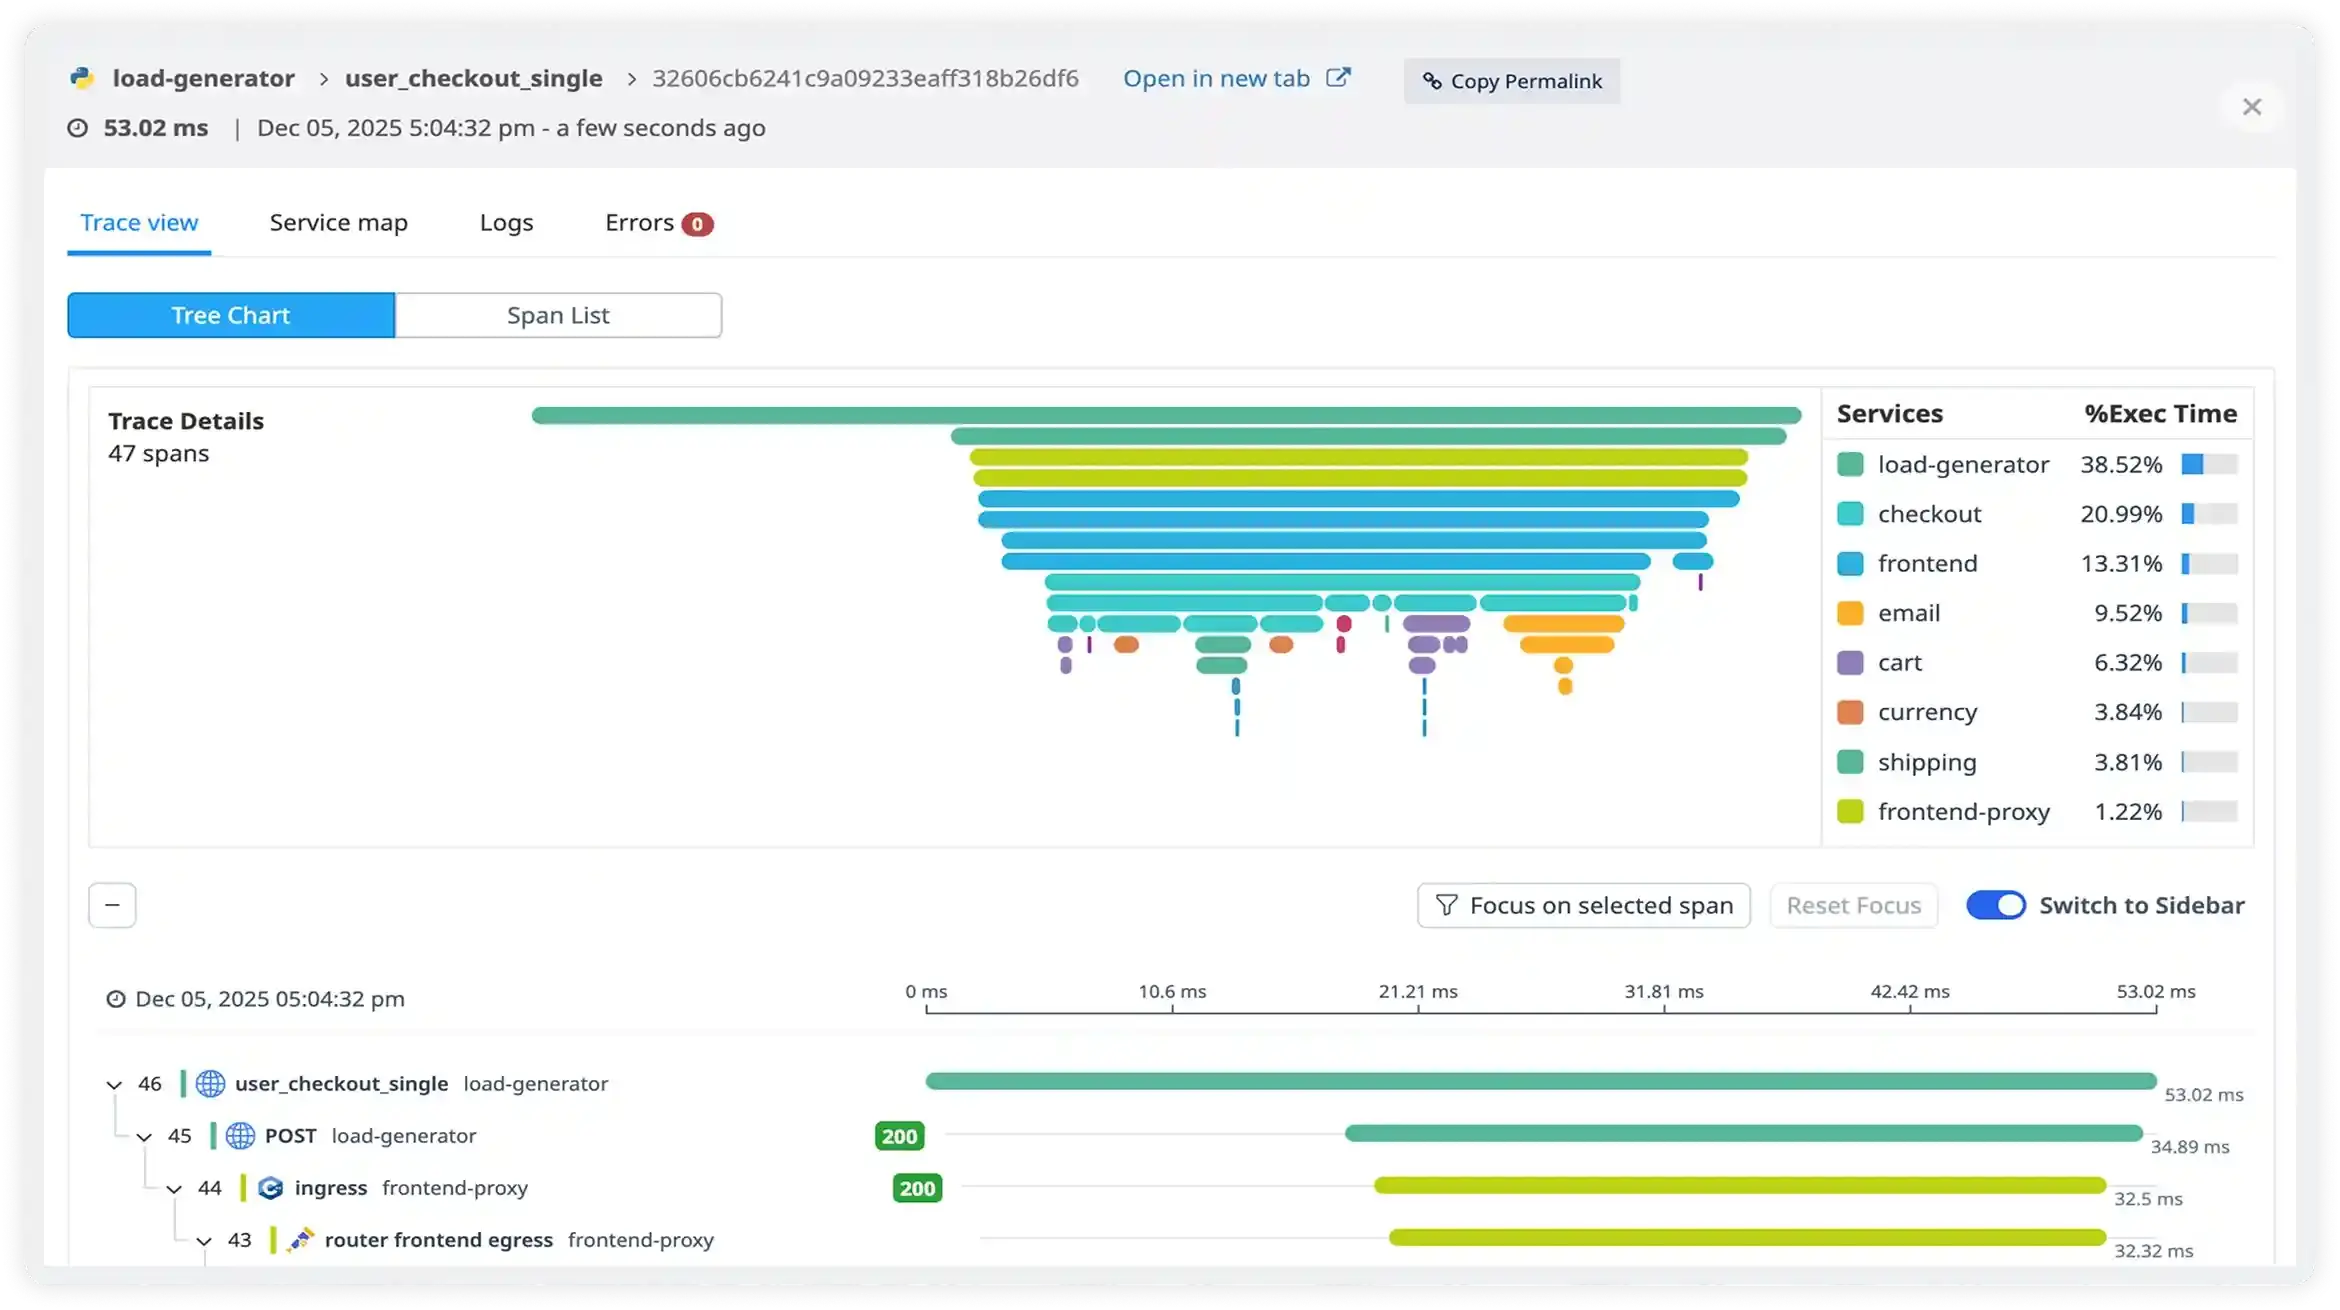
See where errors started and how they propagated through your service mesh with full stack traces.
Search for specific user requests and see the complete journey through all services with timing and errors.
Atatus adapts to how engineering teams work across development, operations, and reliability.
Debug errors and slow paths with the full context of what happened.
Atatus for developersTrack deployments and see how each release affects stability.
Atatus for DevOpsWatch latency and error rates to ship with less production risk.
Atatus for release engineers"Solid Product even better support." The integration path is incredibly simple/easy and the overall interface is very intuitive. That said, I had a handful of odd use cases that the support team was incredibly responsive in helping me work through.
Pricing, deployment, data and the agent. If something is missing, a person will answer it on a demo call.
Distributed Tracing is a method for monitoring and profiling applications, especially those built using a microservices architecture. It allows you to track a request as it travels through various services in your application, providing insights into the performance and behavior of each service involved.
Traces represent the entire journey of a request through your application. Spans, on the other hand, represent individual operations within the request, such as database queries, HTTP requests, or function calls. Spans are organized hierarchically to represent the flow of execution within your application.
Distributed tracing offers several benefits for understanding and troubleshooting complex systems in distributed environments:
Atatus ensures minimal overhead with Distributed Tracing instrumentation through techniques like intelligent sampling to reduce data volume, efficient data collection methods to minimize resource usage, and asynchronous processing for batching data transmission, all aimed at minimizing impact on application performance while still providing comprehensive tracing capabilities.
Distributed tracing provides end-to-end visibility into requests as they traverse through various microservices. It captures detailed information about each transaction, including latency, errors, and dependencies. By analyzing distributed traces, enterprises can pinpoint performance bottlenecks, understand the flow of requests across services, and optimize resource utilization to improve overall system performance.
Yes, Atatus allows you to customize traces and spans according to your specific requirements. You can add custom tags, metadata, and annotations to traces and spans to provide additional context and insights into your application's behavior.
Atatus uses various propagation mechanisms, such as HTTP headers (e.g., Trace Context headers), to propagate trace and span context between different services. This ensures that the entire trace is correlated and aggregated correctly, even as requests traverse multiple services.
Atatus uses standard context propagation mechanisms like HTTP headers (e.g., Trace Context headers) or messaging protocols (e.g., AMQP, Kafka) to propagate trace and span context between services.
When a request enters a service, it extracts trace context from incoming requests and injects it into outgoing requests to ensure continuity of the trace across service boundaries. This allows Atatus to correlate and aggregate data from multiple services into a single trace.
Yes, Atatus allows you to correlate distributed traces with logs and metrics collected from your applications and infrastructure. By tagging logs and metrics with trace identifiers or other contextual information, you can easily navigate between different data sources to troubleshoot and diagnose issues across your distributed system.
Atatus supports a wide range of products across various domains to help organizations monitor and optimize their systems and applications.
Start free and send your first trace with OpenTelemetry or the Atatus agents. APM, logs, RUM, infrastructure and SIEM, all on one timeline.