Slow Growth Due to Performance
“Our product is great, but slow page loads and bugs are hurting our growth metrics and word-of-mouth.”
Startups can't afford downtime or runaway cloud costs. Monitor your entire stack with startup-friendly pricing, catch issues before users report them, and optimize infrastructure spend while your lean team focuses on growth.
Real problems experienced by teams like yours every day
“Our product is great, but slow page loads and bugs are hurting our growth metrics and word-of-mouth.”
“We only discover critical bugs when users complain on Twitter or in support tickets, damaging our reputation.”
“Our app crashes during demo calls or when we get featured on Product Hunt because we didn't know our infrastructure limits.”
“Datadog and New Relic cost more than our AWS bill, but we need proper monitoring to compete.”


Measurable improvements across your DevOps workflows and business metrics
Real-time error tracking with full stack traces, user context, and automatic alerting keeps your reputation intact.
Monitor your entire stack for 1/4 the cost of enterprise tools, with transparent pricing that scales with you.
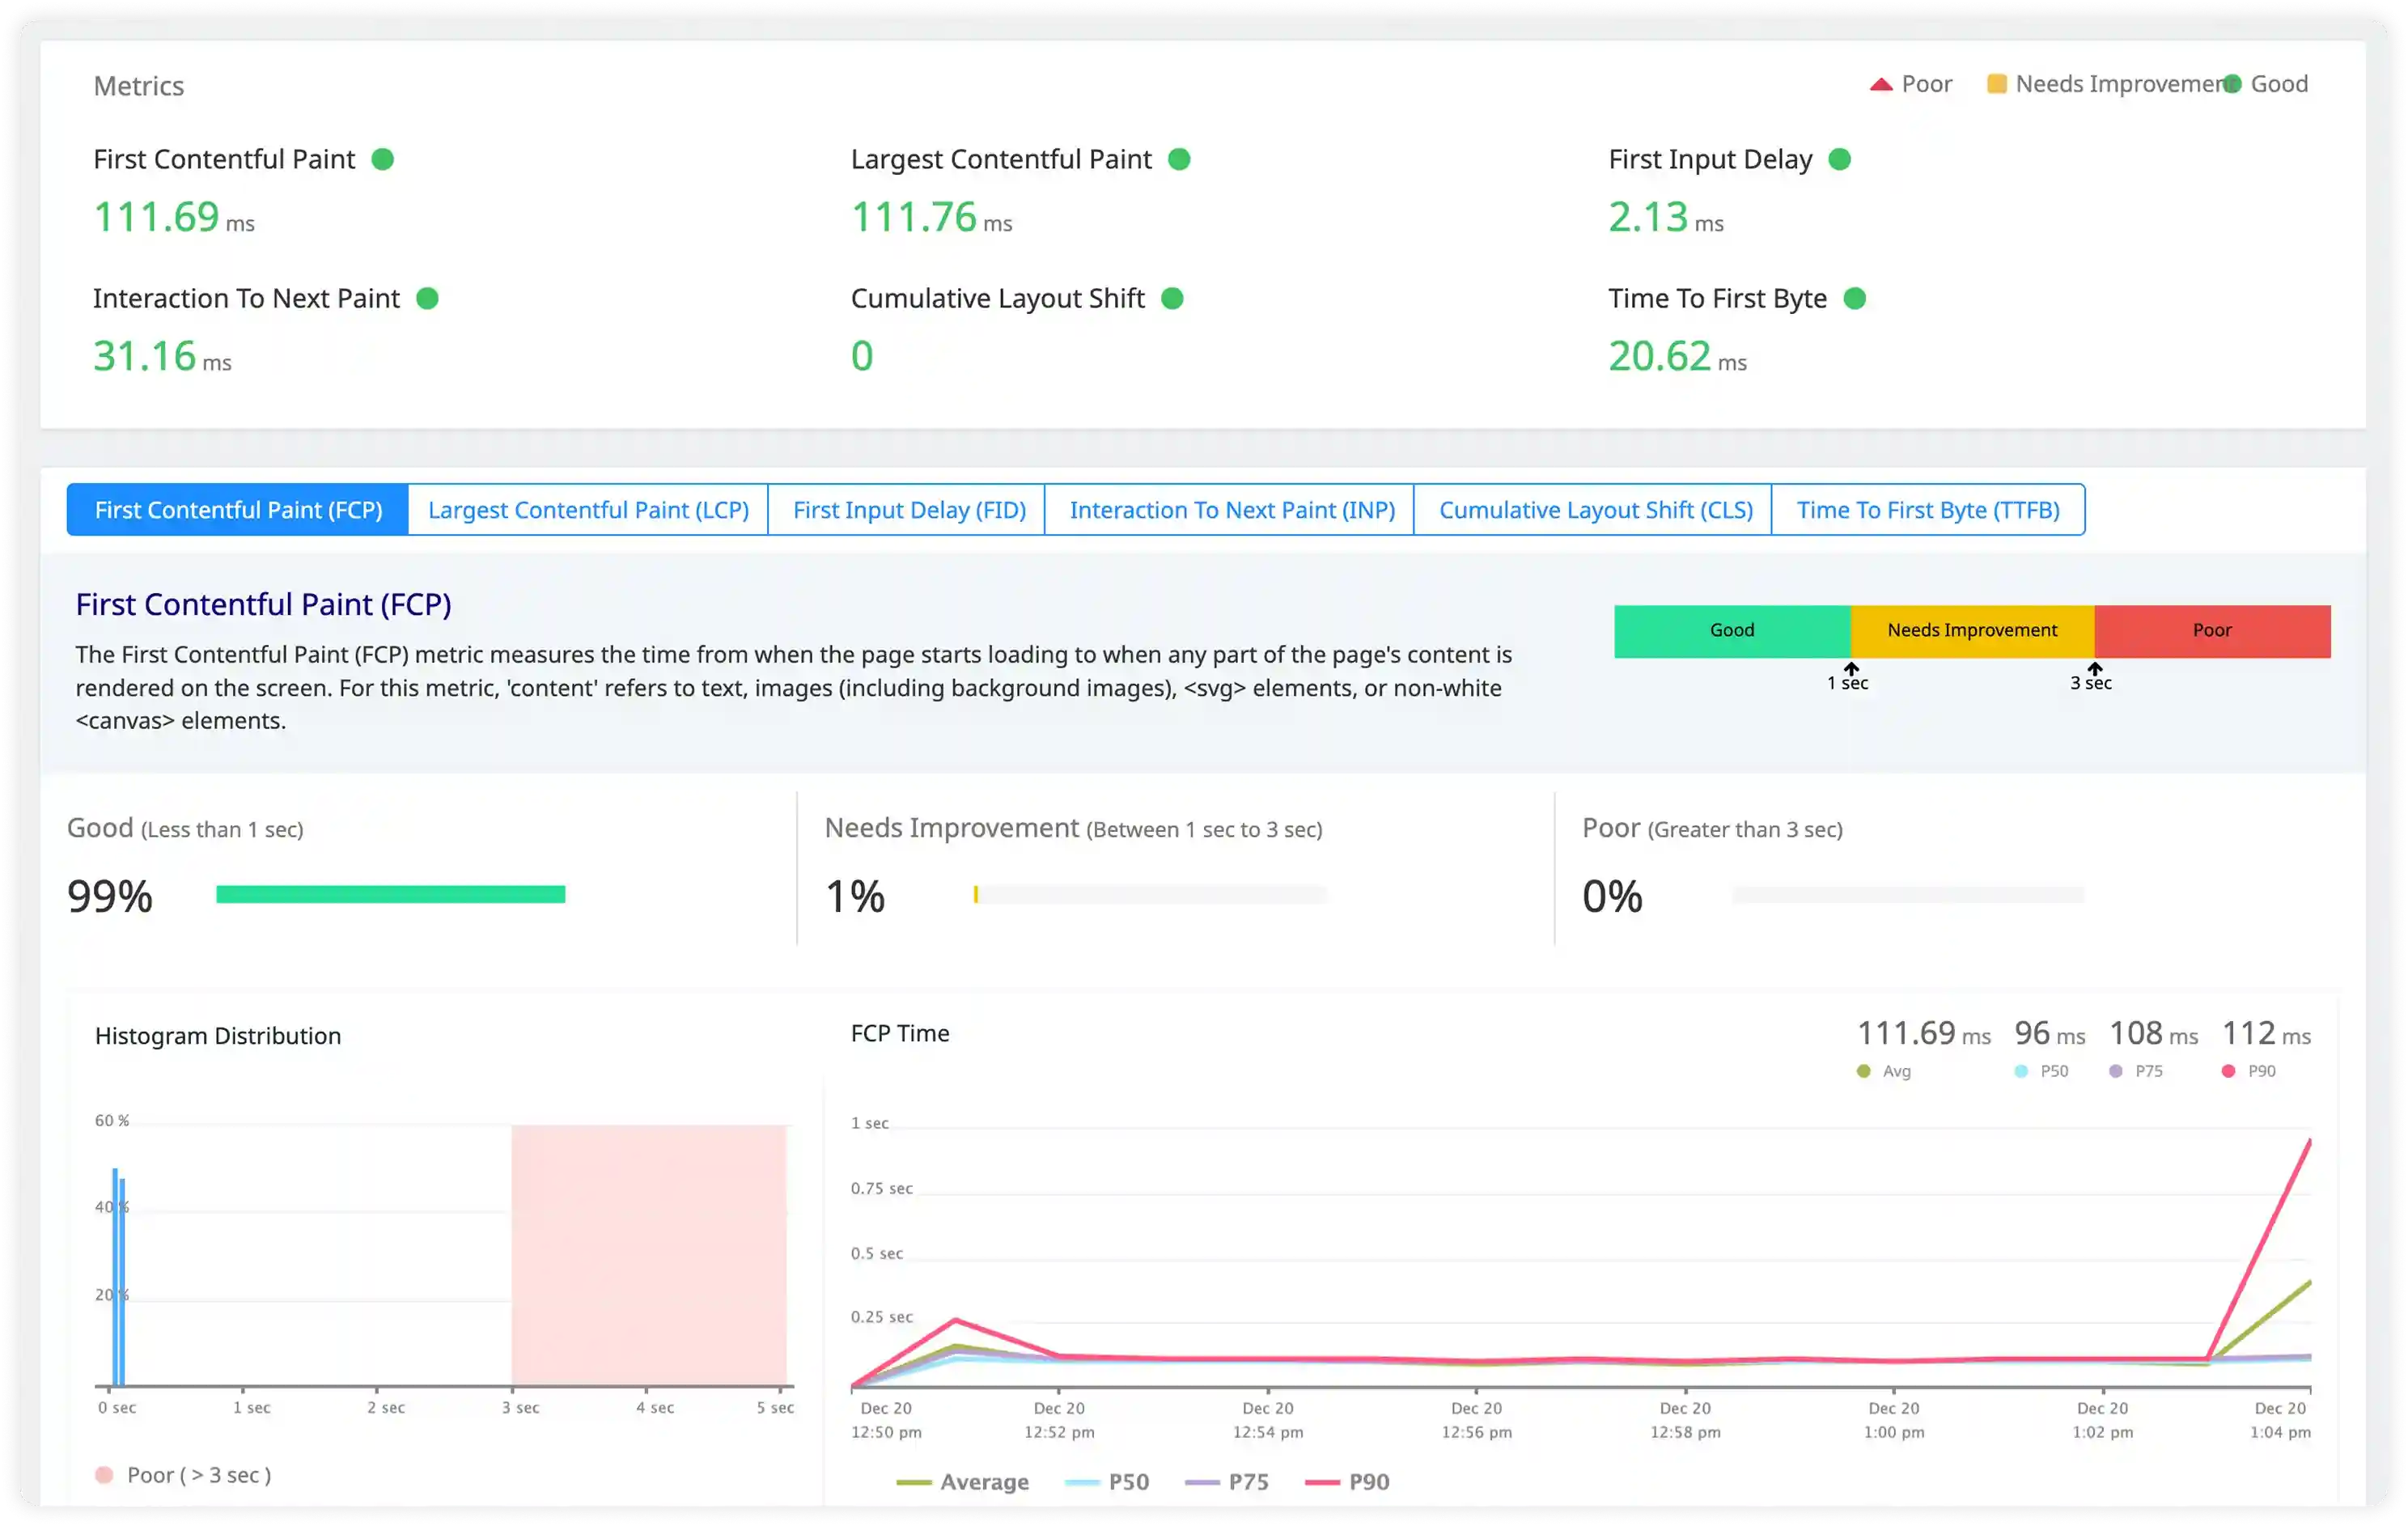
Track Core Web Vitals, API response times, and database performance to deliver experiences users love and share.
Atatus adapts to how engineering teams work across development, operations, and reliability.
Debug errors and slow paths with the full context of what happened.
Atatus for developersTrack deployments and see how each release affects stability.
Atatus for DevOpsWatch latency and error rates to ship with less production risk.
Atatus for release engineers"Solid Product even better support." The integration path is incredibly simple/easy and the overall interface is very intuitive. That said, I had a handful of odd use cases that the support team was incredibly responsive in helping me work through.
Pricing, deployment, data and the agent. If something is missing, a person will answer it on a demo call.
Runaway cloud costs often come from over-provisioned resources, zombie instances, or inefficient database queries hitting your database thousands of times per hour. Atatus shows you exactly where you're wasting money.
Track which services consume the most CPU and memory. See if you're running oversized EC2 instances that could be downsized. Identify database queries that could be optimized or cached. Most startups cut cloud costs by 30-40% within the first month by rightsizing based on Atatus data.
Load test your application and monitor key metrics with Atatus to understand your capacity limits before users hit them. See how response times, error rates, and resource usage change as traffic increases.
Set up synthetic monitoring to simulate user traffic patterns at different scales. Identify bottlenecks (slow API endpoints, database connection limits, memory leaks) that would fail under 10x traffic. Fix scaling issues proactively instead of during a Product Hunt launch.
Yes, Atatus is designed for lean teams. Set up full-stack monitoring in under 30 minutes with our SDKs and auto-instrumentation. No need to hire a dedicated DevOps engineer or spend weeks configuring tools.
Start with our startup-friendly pricing (free tier for early teams, pay-as-you-grow pricing). Get pre-configured dashboards for common tech stacks (Node.js + React + MongoDB, Python + Django + Postgres, etc.). When issues occur, clear alerts tell you exactly what's wrong and where to look.
Focus on metrics that directly impact your users and runway:
Atatus's startup dashboard shows all of these in one place. Add custom business metrics (signups, conversions, active users) as you grow.
Atatus alerts you before issues become outages. Set up smart alerts based on thresholds that matter (error rate spikes, API latency > 2s, CPU > 90%).
Get notified via Slack, PagerDuty, or email when something goes wrong. Alerts include context (which endpoint is failing, exact error message, affected users) so you can fix issues in minutes, not hours. Many startup founders sleep better knowing Atatus is watching their systems 24/7.
Absolutely. Atatus pricing scales with your usage (data volume, number of hosts), not your revenue. Start on the free tier, upgrade as you grow. No surprise bills or enterprise-only features locked behind paywalls.
Many startups that started with Atatus at seed stage still use it as Series B companies monitoring thousands of servers. You won't outgrow it, and you won't pay for features you don't need.
No, Atatus is built for full-stack developers, not just infrastructure experts. If you can deploy code to production, you can set up Atatus.
Install our agent with a few lines of code (npm install for Node.js, pip install for Python, etc.). Auto-instrumentation captures 80% of what you need to monitor without code changes. The dashboard explains metrics in plain English. When you do hire a DevOps engineer later, they'll appreciate that monitoring is already in place.
Start free and send your first trace with OpenTelemetry or the Atatus agents. APM, logs, RUM, infrastructure and SIEM, all on one timeline.