Deployment Tracking
Automatic detection and tracking of every release. Correlate commits, containers, and code changes.
Monitor every deployment in real time. Detect issues instantly. Understand impact before your customers do.
Every deployment carries risk. Without real-time visibility, you're flying blind.
Uncertainty After Release You deploy to production and wait. Minutes feel like hours wondering if something broke.
Impossible Root Cause Analysis Which deployment caused the spike in latency? Was it your code, infrastructure, or a third-party API?
Slow Incident Response By the time you identify the problematic release, your customers are already impacted.
Risky Rollback Decisions Should you rollback? You don't have enough data to decide confidently.
Track each release, see its impact on errors and performance, and catch problems early before they pile up
Atatus is the observability platform built for engineering teams that care about releases. We correlate every deployment with performance, errors, and infrastructure changes in real time. See exactly what changed, where it impacted, and whether you need to roll back—all instantly.
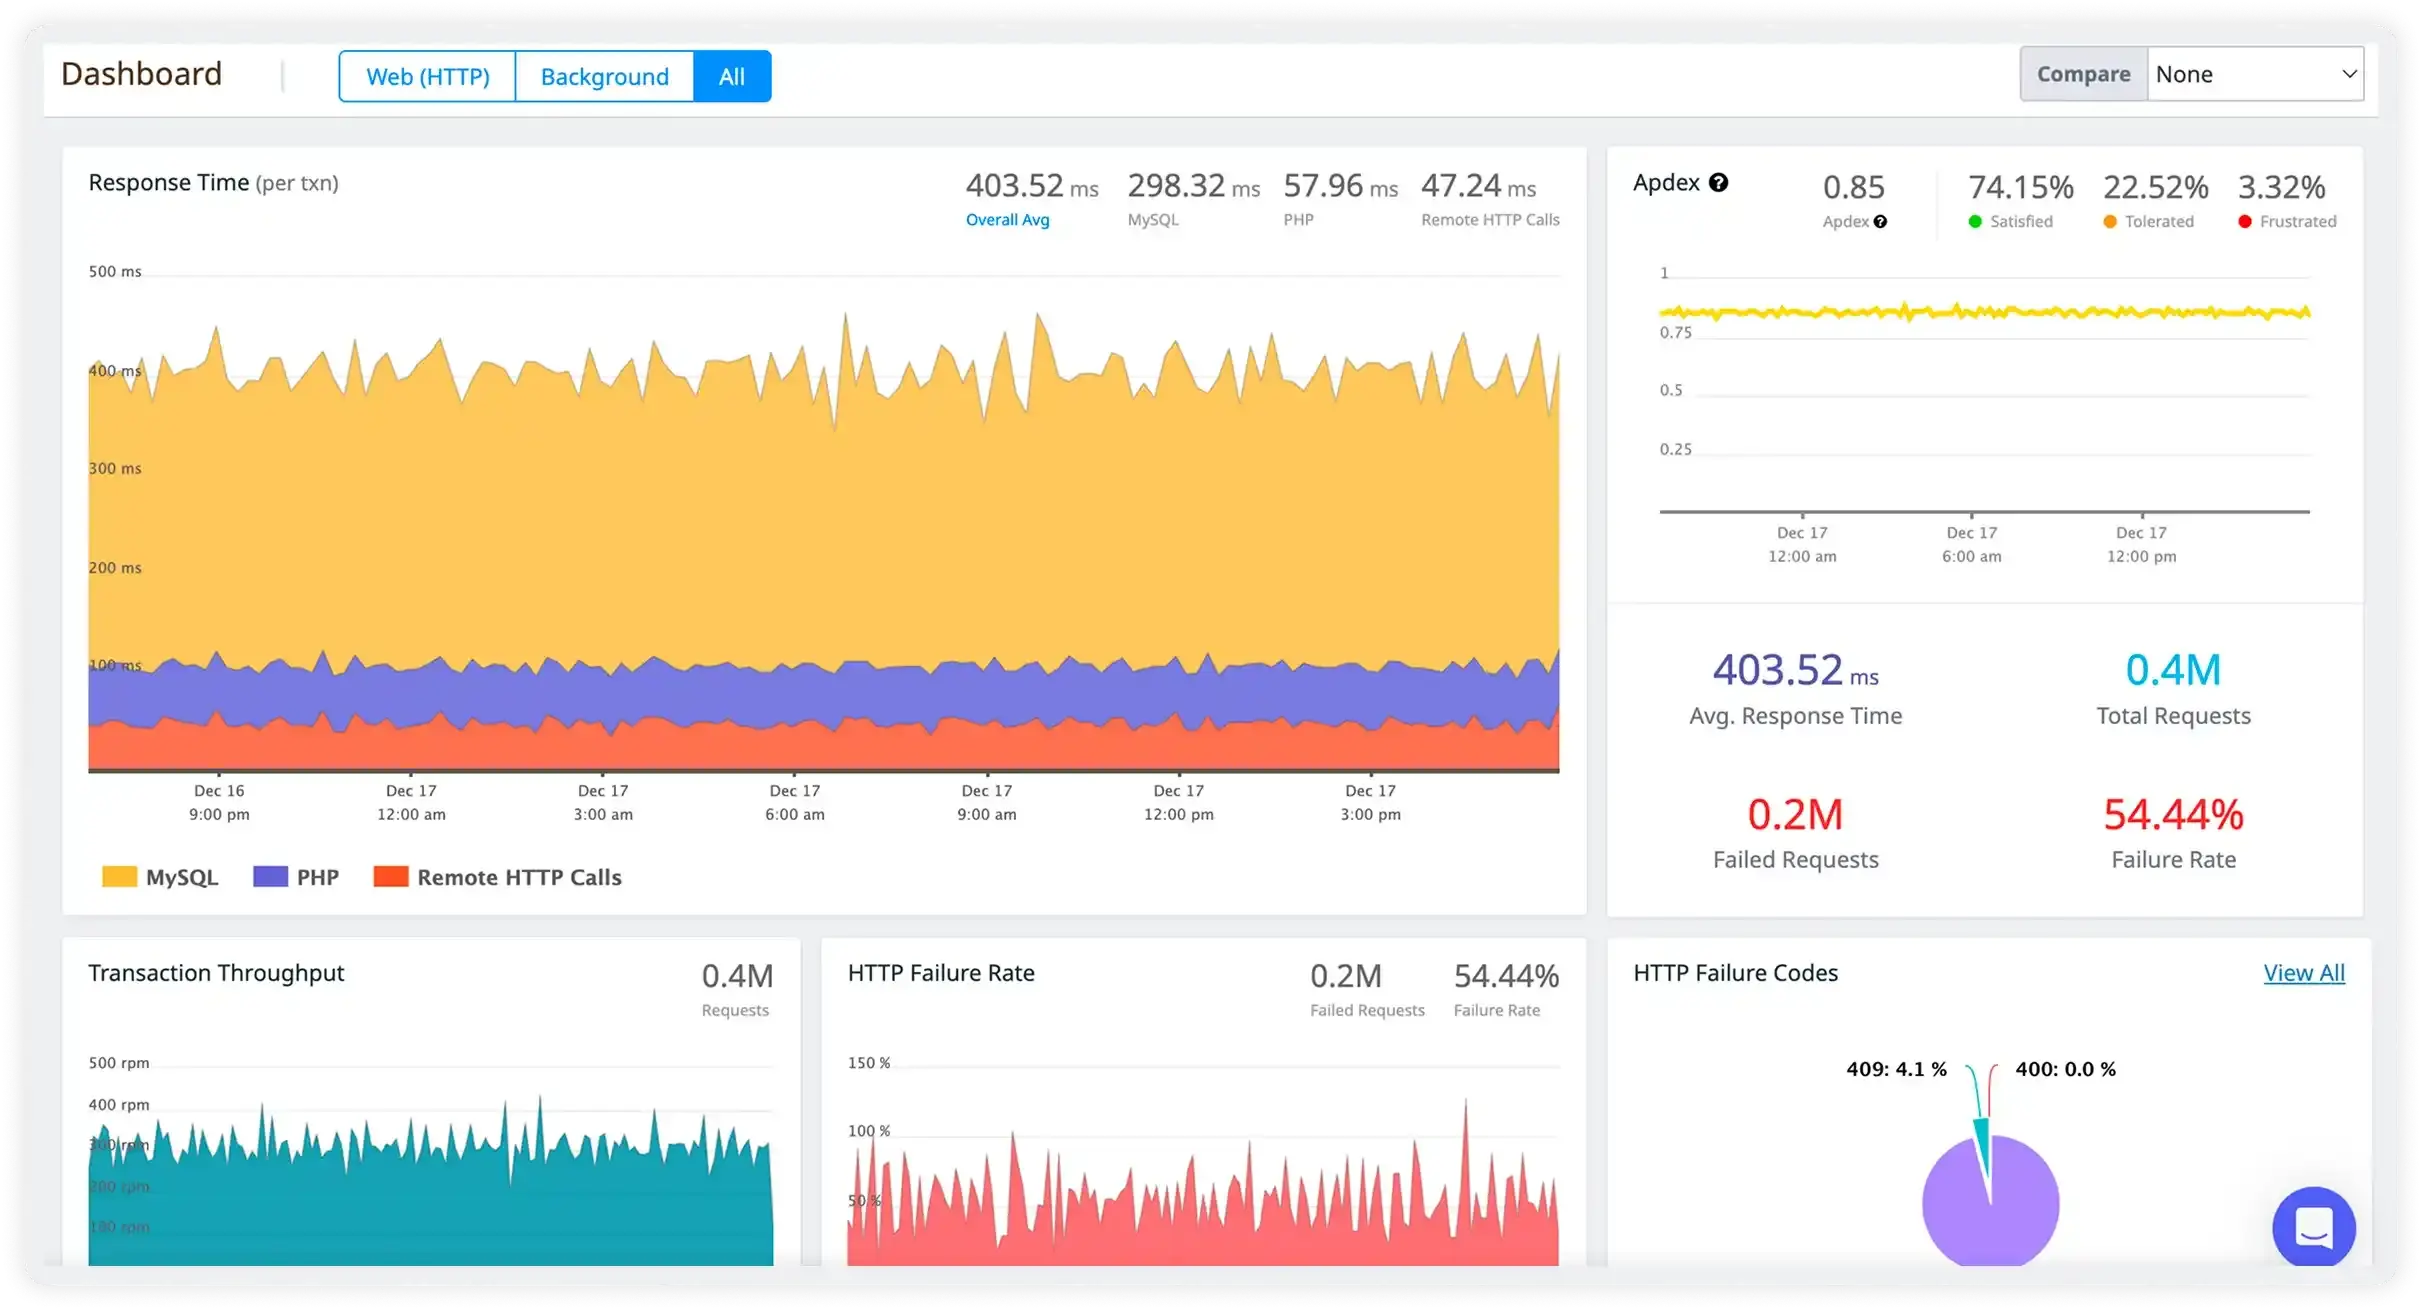
Automatic detection and tracking of every release. Correlate commits, containers, and code changes.
See exactly how each deployment affected response times, errors, throughput, and user experience.
ML-powered detection of performance degradation and errors tied to specific releases.
Instant comparison between current and previous versions. Make rollback decisions in seconds.
Get notified when deployment impacts performance. No more noise, just actionable insights.
Side-by-side performance metrics across releases. Understand what actually improved or degraded.
Validate every deployment with real-time performance data before rolling out to 100%.
Don't guess. Know exactly whether to rollback in 30 seconds or less.
See deployment health alongside build times, test coverage, and code changes.
Canary deployments, gradual rollouts, and instant rollback with data-driven confidence.
Atatus adapts to how engineering teams work across development, operations, and reliability.
Debug errors and slow paths with the full context of what happened.
Atatus for developersTrack deployments and see how each release affects stability.
Atatus for DevOpsWatch latency and error rates to ship with less production risk.
Atatus for release engineers"Solid Product even better support." The integration path is incredibly simple/easy and the overall interface is very intuitive. That said, I had a handful of odd use cases that the support team was incredibly responsive in helping me work through.
Pricing, deployment, data and the agent. If something is missing, a person will answer it on a demo call.
Observability refers to the capability of understanding a system's internal state and behavior based on its external outputs. In the context of software systems, observability encompasses the ability to monitor, trace, and analyze various aspects of the system's operation, such as logs, metrics, and traces.
It allows developers and operators to gain insights into how the system is performing, identify potential issues or anomalies, and troubleshoot problems effectively. Observability plays a crucial role in ensuring the reliability, availability, and performance of complex software applications and infrastructure.
Release teams require an observability platform to ensure smooth deployments, identify and troubleshoot issues quickly, and continuously improve the reliability and performance of their applications.
Atatus provides a comprehensive observability platform that aggregates and visualizes data from across your infrastructure, applications, and services. It offers features such as log management, infrastructure monitoring, APM (Application Performance Monitoring), and distributed tracing.
Some benefits include:
Atatus enables rapid incident response by providing real-time visibility into system performance and health. Teams can quickly pinpoint the root cause of incidents using features such as distributed tracing and log correlation, leading to faster resolution times.
Yes, Atatus's observability platform is highly scalable and can accommodate large and complex environments with ease. It is designed to handle massive volumes of data, making it suitable for organizations of all sizes, from startups to enterprise-level deployments.
Atatus takes data security and compliance seriously. It encrypts data in transit and at rest, follows industry best practices for access control, and complies with relevant regulations such as GDPR and HIPAA. Users can also configure data retention policies to meet their compliance requirements.
Release teams can sign up for a Atatus account, install the Atatus agent on their servers or containers, and configure integrations to start collecting and visualizing data. Atatus also offers documentation, and support resources to assist with onboarding and adoption.
Atatus supports a wide range of products across various domains to help organizations monitor and optimize their systems and applications.
Start free and send your first trace with OpenTelemetry or the Atatus agents. APM, logs, RUM, infrastructure and SIEM, all on one timeline.