Multiple Teams, Fragmented Tools
“Each team uses different monitoring tools. We can't get a holistic view of system health or track dependencies across teams.”
Enterprise-scale systems demand enterprise-grade observability. Unified monitoring across multi-cloud environments, SOC 2 compliant, with automated service discovery and intelligent alerting, so your teams can focus on innovation, not firefighting.
Real problems experienced by teams like yours every day
“Each team uses different monitoring tools. We can't get a holistic view of system health or track dependencies across teams.”
“We need SOC 2, HIPAA, and GDPR compliance, role-based access control, and audit logs, which most tools don't support properly.”
“Our microservices generate millions of unique metric combinations. Most tools either crash or charge us insane amounts.”
“We run on AWS, Azure, and on-prem. Managing monitoring across environments is a nightmare with fragmented visibility.”
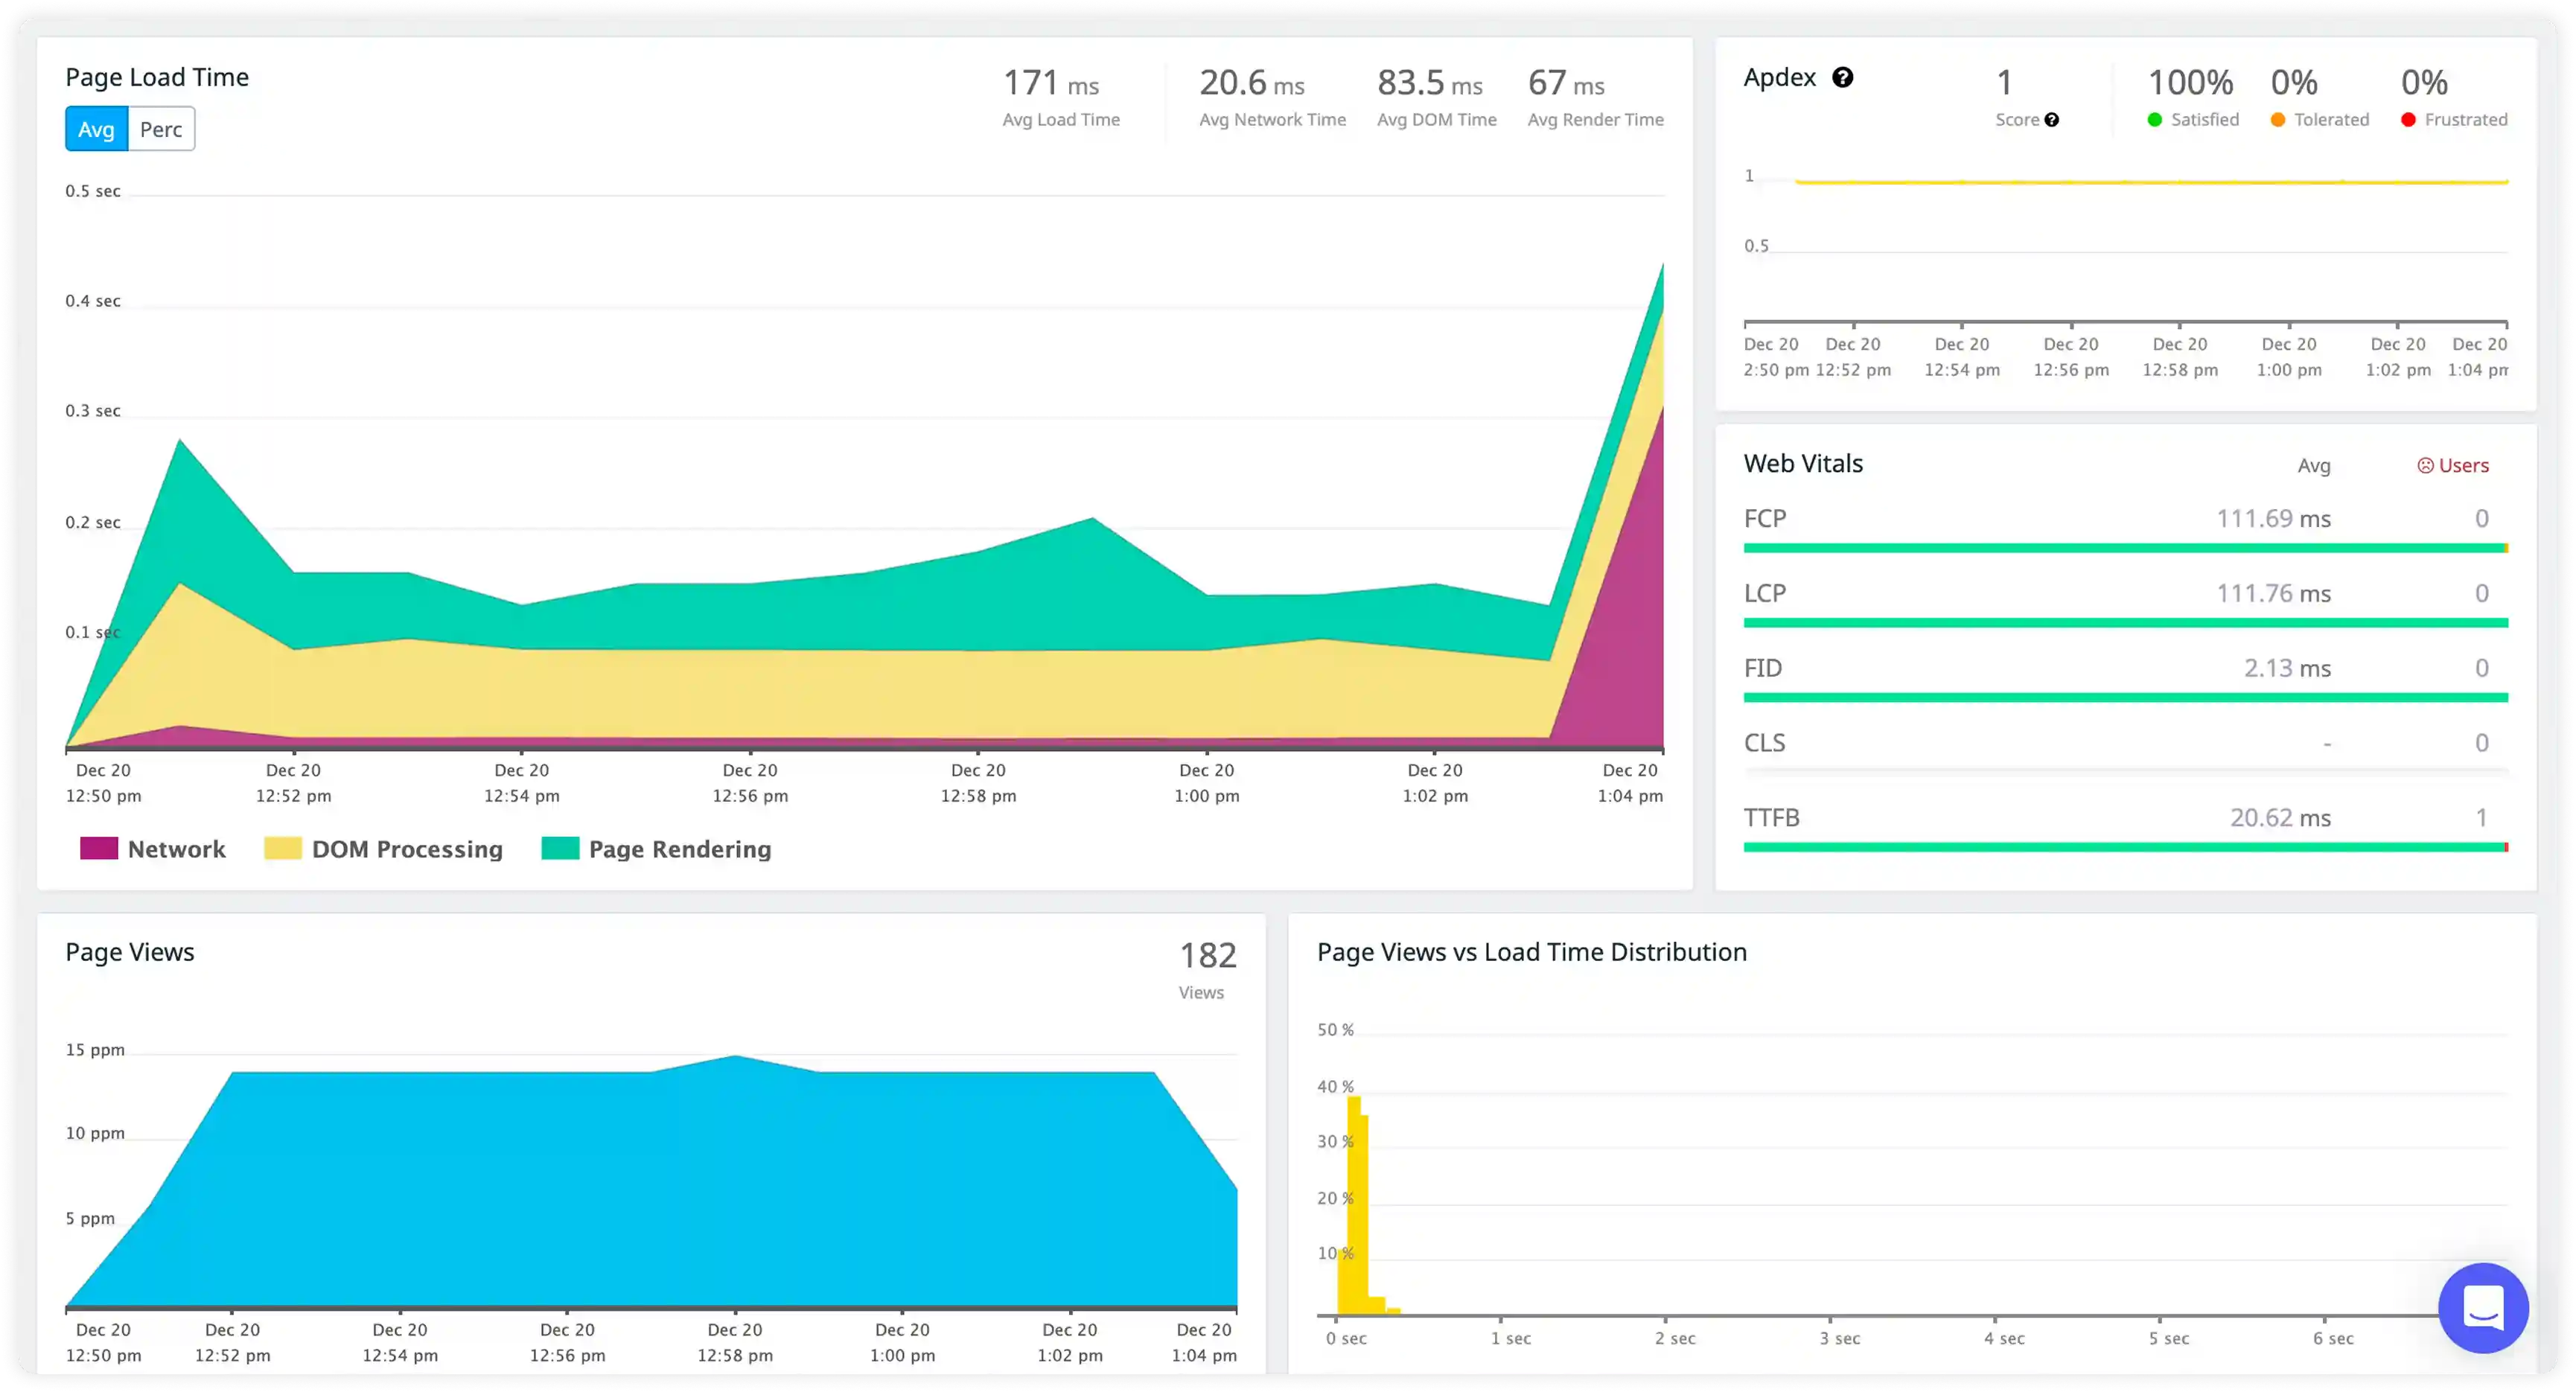


Measurable improvements across your DevOps workflows and business metrics
Centralize monitoring across all teams, services, and environments with role-based access and team-specific dashboards.
SOC 2 Type II, HIPAA, GDPR compliant with SSO, RBAC, audit logs, and on-premises deployment options.
Purpose-built for enterprise scale with efficient indexing that handles millions of unique time series without breaking.
Atatus adapts to how engineering teams work across development, operations, and reliability.
Debug errors and slow paths with the full context of what happened.
Atatus for developersTrack deployments and see how each release affects stability.
Atatus for DevOpsWatch latency and error rates to ship with less production risk.
Atatus for release engineers"Solid Product even better support." The integration path is incredibly simple/easy and the overall interface is very intuitive. That said, I had a handful of odd use cases that the support team was incredibly responsive in helping me work through.
Pricing, deployment, data and the agent. If something is missing, a person will answer it on a demo call.
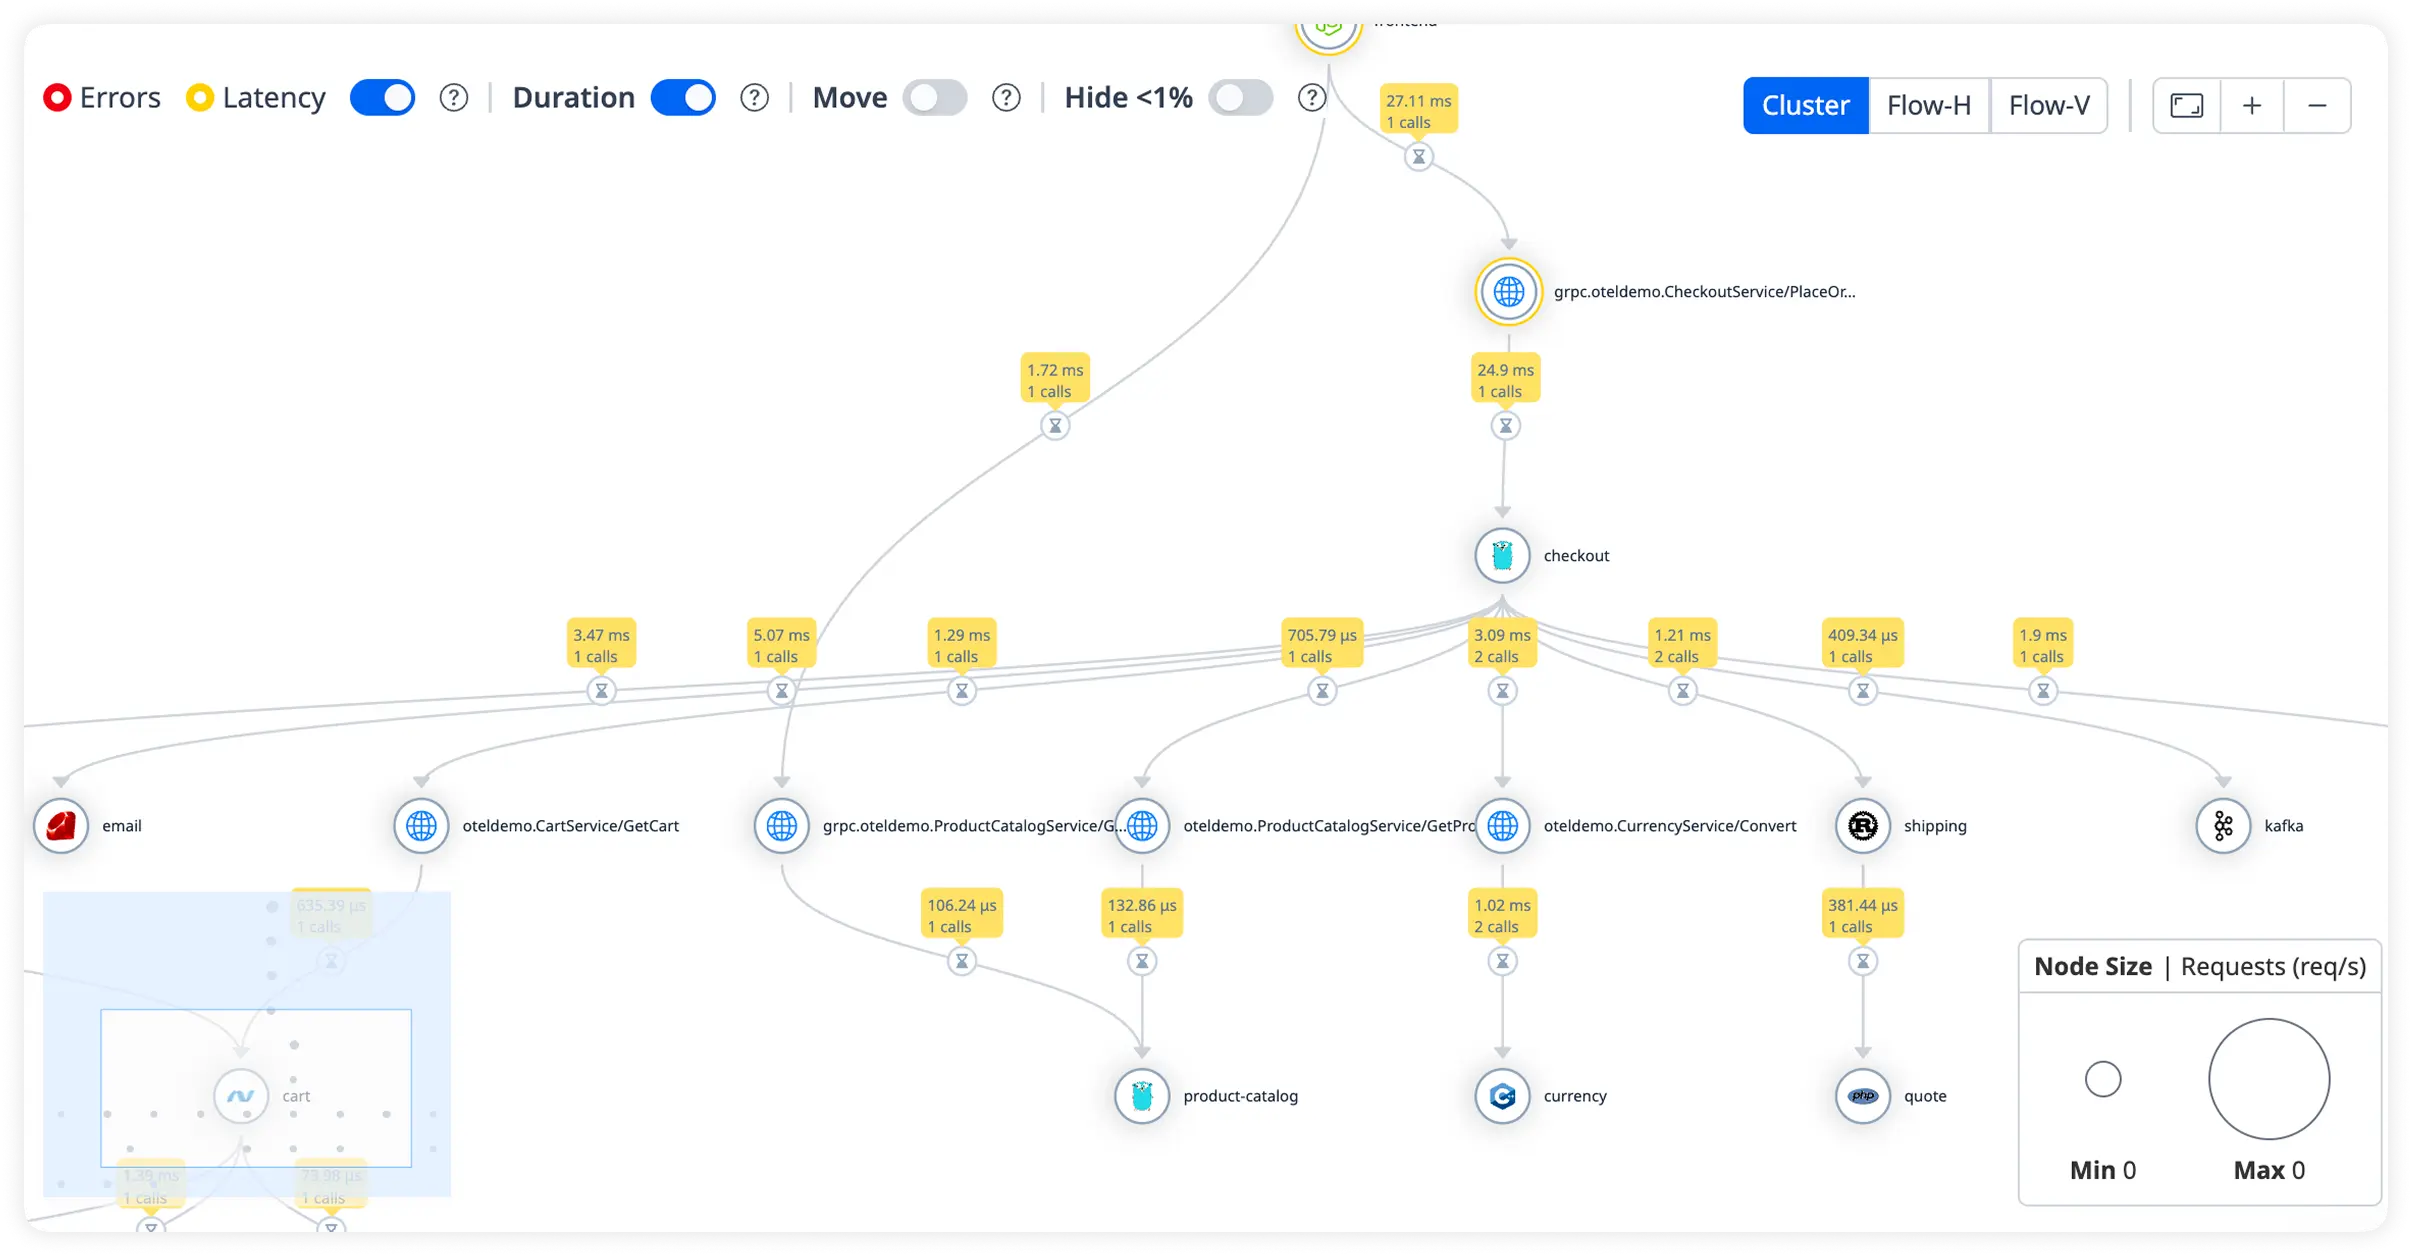
At enterprise scale, manual monitoring breaks down. Atatus provides automated service discovery, dependency mapping, and intelligent grouping to make sense of complex architectures.
Service maps automatically visualize your microservices topology, showing dependencies and communication flows. Distributed tracing tracks requests across all services without manual instrumentation. Smart alerts use machine learning to detect anomalies across services, not just individual threshold violations. Enterprise customers monitor 5,000+ services in a single platform.
Yes, Atatus provides executive dashboards that translate technical metrics into business impact. Show uptime SLAs, cost of downtime, and performance improvements in dollars, not just error rates.
Track SLOs (Service Level Objectives) against business KPIs. Generate monthly reports showing 'Prevented $2M in revenue loss by catching issues before customers.' Compare reliability across product lines or regions. Make data-driven decisions about infrastructure investments with total cost of ownership (TCO) analysis.
Atatus is SOC 2 Type II, HIPAA, and GDPR compliant. We provide audit trails, access logs, and data retention policies required for compliance frameworks.
Role-based access control (RBAC) ensures only authorized personnel see sensitive data. Data encryption in transit and at rest meets security requirements. Automated compliance reports for auditors show who accessed what data and when. Sensitive data masking prevents PII exposure in logs and traces.
Enterprise customers typically see 10x ROI within the first year through reduced downtime, faster incident response, and infrastructure optimization.
Average benefits: 60% reduction in mean time to resolution (MTTR), 40% fewer production incidents, 30% cloud cost savings from rightsizing, and 50% decrease in developer time spent debugging. One hour of downtime at enterprise scale can cost millions - preventing a single major outage pays for Atatus for years.
Atatus provides a single pane of glass for AWS, Azure, GCP, and on-premise infrastructure. Stop context-switching between vendor-specific tools.
Unified dashboards show metrics from all cloud providers in one view. Correlate issues across clouds (e.g., AWS Lambda calling Azure services). Standardize alerting and incident response regardless of where workloads run. Most enterprise teams reduce monitoring tool sprawl from 8+ tools to one platform.
Yes, Atatus supports multi-tenancy with team-based isolation and cross-team collaboration. Each team gets their own workspace, dashboards, and alerts, while maintaining visibility into shared services.
Set up teams for Platform, Security, Product, and DevOps with different permissions. Teams can share dashboards and create cross-functional incident response workflows. Billing and usage tracking per team helps with chargeback models. No data silos - teams can query and correlate data across boundaries when needed.
Atatus architecture is built for enterprise scale. Our customers monitor 50,000+ hosts, ingesting terabytes of data daily with sub-second query performance.
Auto-scaling data ingestion handles traffic spikes without configuration changes. Time-series database optimizations keep dashboards fast at any scale. Data retention policies and tiered storage (hot/cold) manage costs as volume grows. No need to re-architect monitoring as you scale - Atatus grows with you.
Start free and send your first trace with OpenTelemetry or the Atatus agents. APM, logs, RUM, infrastructure and SIEM, all on one timeline.