Smart Crash Detection for Developers Who Ship Fast
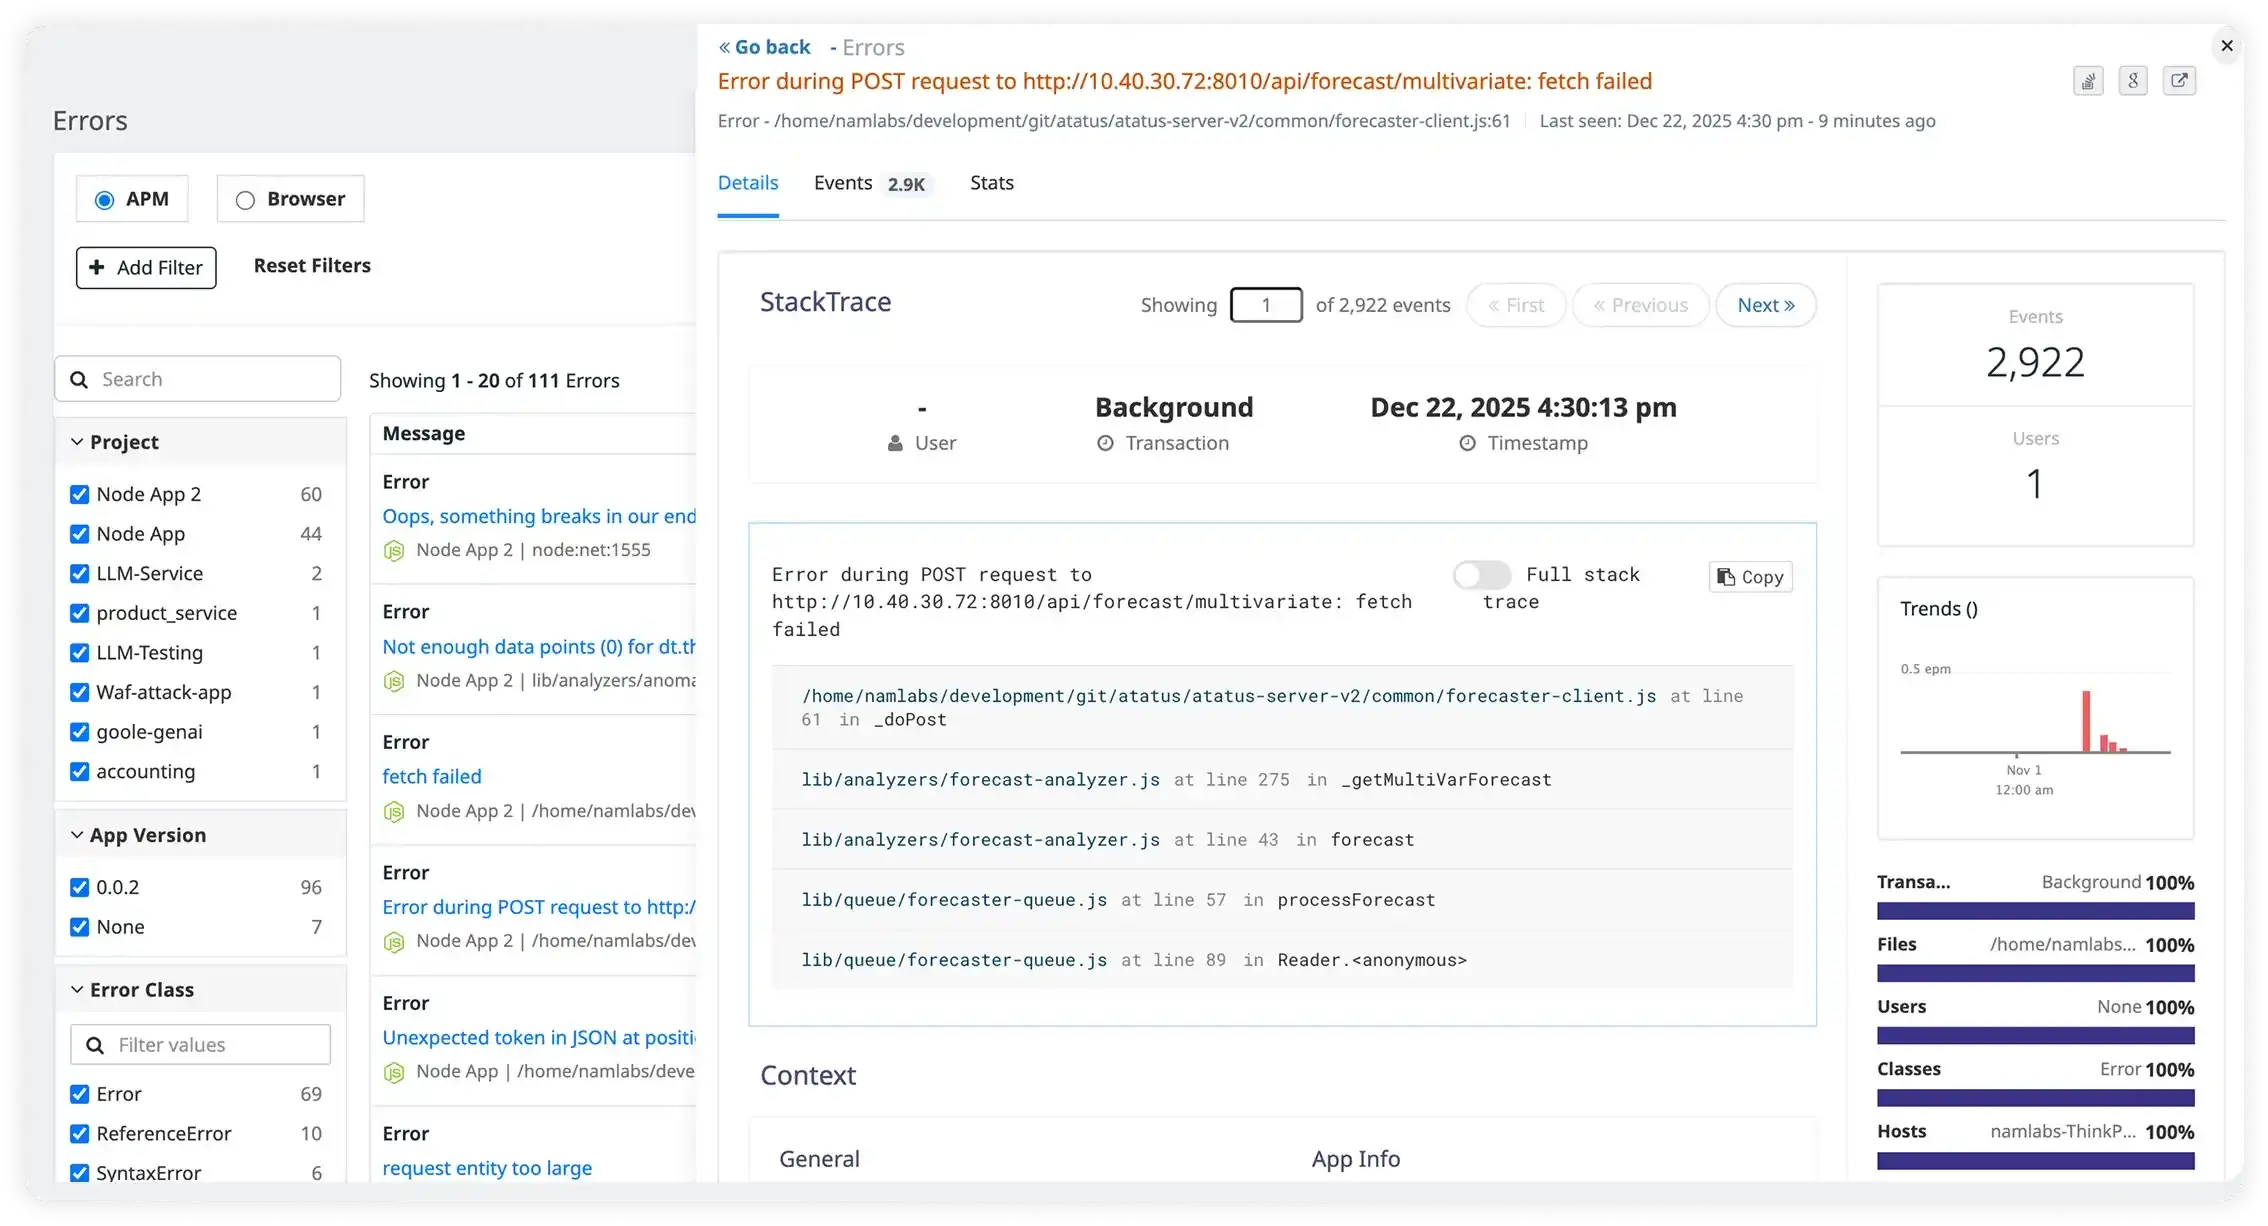
Atatus groups exceptions from your servers and browsers, shows the exact line with its stack trace, and tells you which users, versions and browsers each error hit.
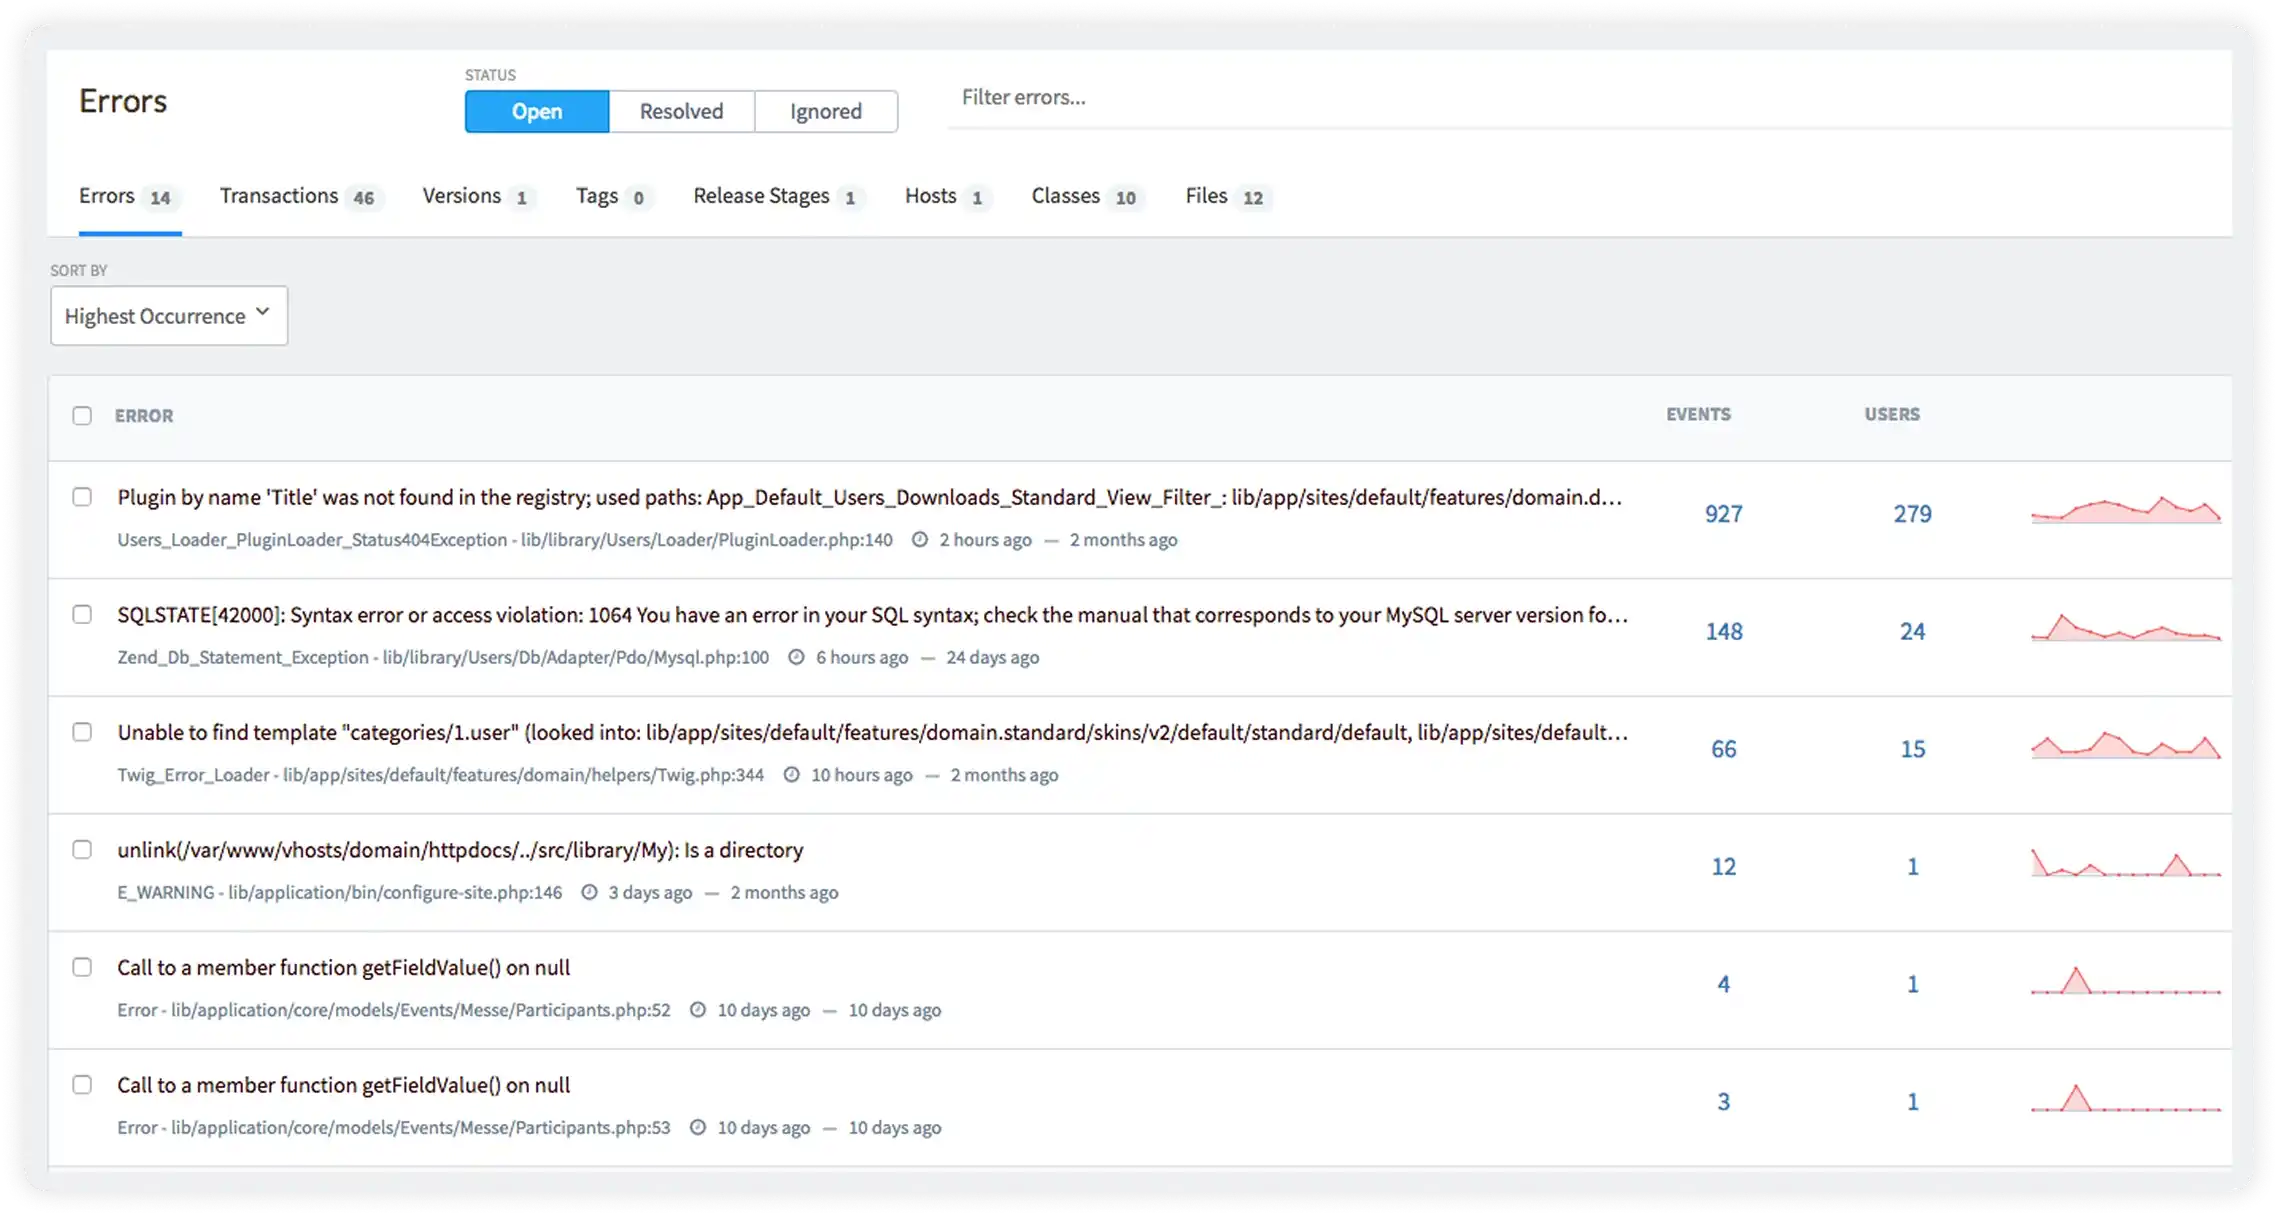
Grouped errors. Ranked by impact.
Repeats are grouped, with events and users counted for each.
- TypeError: Cannot read properties of undefined (reading 'total')src/cart/total.ts:42927 events279 users
- SQLSTATE[42000]: Syntax error or access violation: 1064app/Models/Report.php:118148 events24 users
- TimeoutError: upstream timeout after 900 mspayment/client.js:8865 events15 users
Try Resolve or Ignore · sample data
Every occurrence. Who it hit.
Step through each event of one error. See its user, browser, version and stack.
- Time
- 14:48
- User
- u_7944
- Browser
- Chrome 141
- OS
- Android 16
- App version
- 2.14.0
- Release stage
- production
- URL
- /cart
calculateTotalsrc/cart/total.ts:42CartSummary.rendersrc/cart/Summary.tsx:18onCheckoutClicksrc/checkout/Button.tsx:27
- Chrome 15
- Safari 6
- Edge 3
- 2.14.0 20
- 2.13.2 4
- production 22
- staging 2
- /checkout 19
- /cart 5
Click a tick or use ← → to move between events · counts cover all 24 events · sample data
Minified in production. Readable in Atatus.
Flip the source map to see the same stack before and after it is mapped.
calculateTotalsrc/cart/total.ts:42:1740export function calculateTotal(cart: Cart) {41 const items = cart.items ?? [];42 return items.reduce((sum, i) => sum + i.price.total, 0);43}
CartSummary.rendersrc/cart/Summary.tsx:18:9renderWithHooksreact-dom.development.js:16305onCheckoutClicksrc/checkout/Button.tsx:27:5HTMLButtonElement.dispatchreact-dom.development.js:4213
// last line of app.3f9a1c.js
//# sourceMappingURL=app.3f9a1c.js.map- The error has a stack trace
- app.3f9a1c.js is publicly reachable
- The map file is publicly reachable
Sample stack
From error to ticket.
Create a Jira issue from the error page, or link one that already exists.
[Atatus] TypeError: Cannot read properties of undefined (reading 'total')calculateTotal · src/cart/total.ts:42
927 events · 279 users · production
https://app.atatus.com/… (link to the error)Error Tracking, screen by screen.
Real screens from the Atatus app.
Questions engineers ask about error tracking
Pricing, deployment, data and the agent. If something is missing, a person will answer it on a demo call.
Error monitoring is the automated process of detecting, capturing, and alerting on runtime exceptions and errors in your production application. Without it, you learn about critical bugs from user complaints, support tickets, or app store reviews, often days after they first appeared. Atatus error monitoring gives engineering teams immediate visibility into every exception, with the full context needed to fix it fast.
Repeats of the same exception are grouped into one error with a count of events and affected users, so thousands of occurrences of the same TypeError show up as one entry you can resolve or ignore. In the browser agent you can also set your own grouping key with setGroupingKeyCallback when you want errors grouped differently.
Yes. Atatus maps minified JavaScript stack traces back to your original files, functions and line numbers. If your source map is publicly reachable and referenced with a sourceMappingURL comment, Atatus downloads it automatically. If you do not want to expose it, upload it with the source map API in your deploy script, tagged with the release version.
Each error event carries its stack trace, the request or page it happened on, the user, the browser or agent, the app version, the release stage, the host and any tags or custom data you send. Browser errors also include a timeline of the user actions before the error, and you can add your own breadcrumbs.
Create an alert rule on Exception Count for your application, either with a fixed threshold or as a baseline alert that fires when errors move away from their usual level. Browser projects can alert on JS error count. Notifications go to email, Slack, Microsoft Teams, PagerDuty, OpsGenie, Jira, webhooks and more.
Backend errors come from the Atatus APM agents for Node.js, Python, Java, .NET, PHP, Go and Ruby. Browser errors come from the real user monitoring agent, which supports plain JavaScript and frameworks such as React, Angular, AngularJS, Vue, Ember and Backbone.
Yes. Each error is Open, Resolved or Ignored. Resolve an error once your fix ships, ignore one you do not plan to fix to stop its notifications, and reopen either at any time. Status changes also work through the Atatus MCP Server, so an assistant or another tool can close out an error.