Production Black Boxes
Once services run on shared platforms, visibility fragments across teams. Platform engineers lose a unified view of how workloads behave under real traffic.
Get out-of-the-box visibility into critical KPIs and business performance with our Java monitoring tools. Analyze database transactions, debug with detailed traces, and visualize your applications and their dependencies for optimal insights and management.
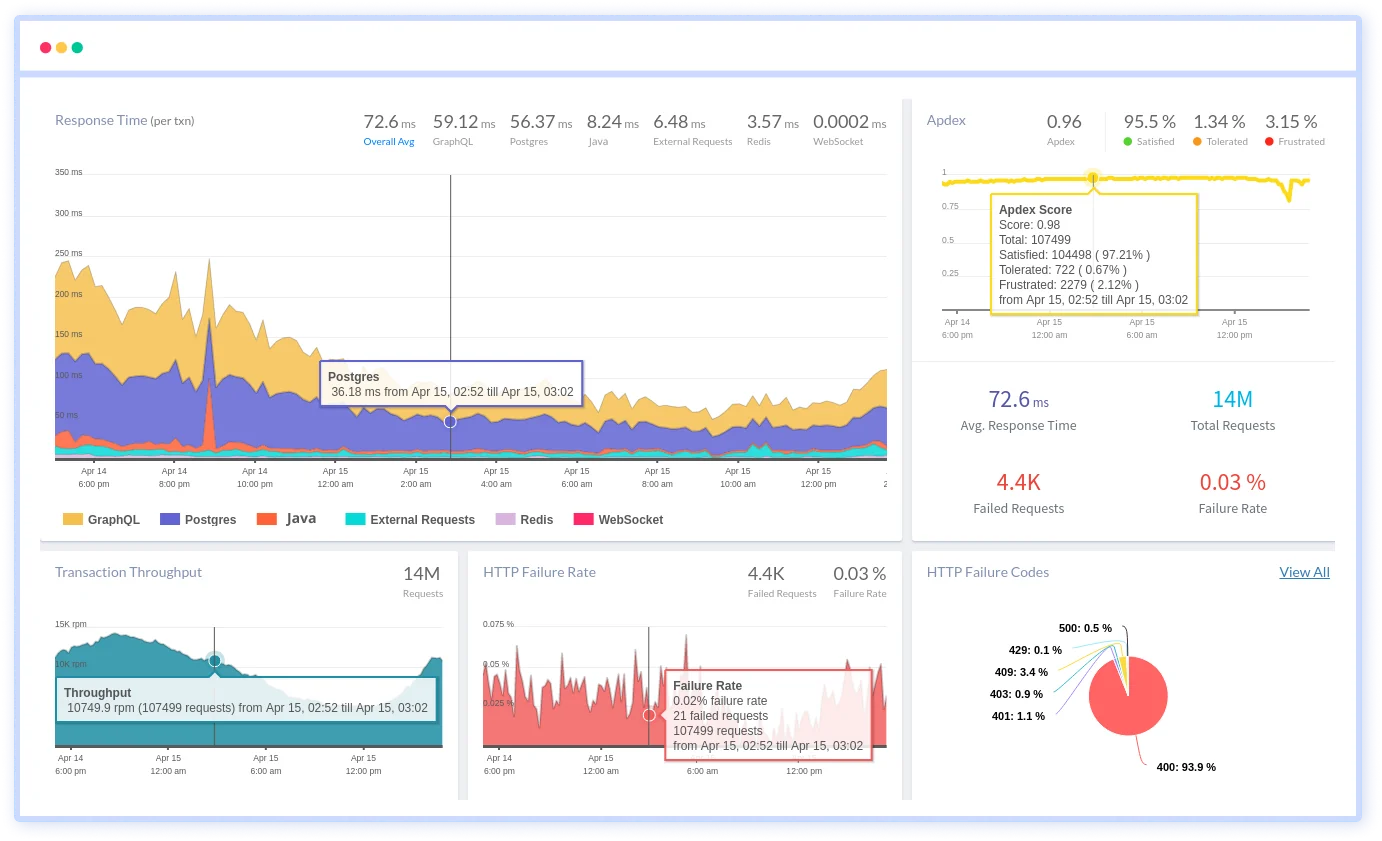
Once services run on shared platforms, visibility fragments across teams. Platform engineers lose a unified view of how workloads behave under real traffic.
Incidents surface as system-wide symptoms, but tracing impact across runtimes, services, and dependencies becomes slow and uncertain.
Platform teams are pulled into investigations without clear signals, spending time correlating data instead of stabilizing the platform.
Issues appear only at peak scale, where platform changes, JVM behavior, and workload patterns intersect in unpredictable ways.
When failures span multiple teams, platforms become the default escalation point, even when the root cause is unclear.
Incremental changes across services degrade platform reliability, but isolating responsibility becomes difficult over time.
Inconsistent signals across environments reduce confidence in platform-wide monitoring standards.
Platform teams shift from enabling teams to firefighting systemic issues without clear causal insight.
End-to-end observability for Java workloads that helps engineering teams maintain speed, stability, and smooth production releases.
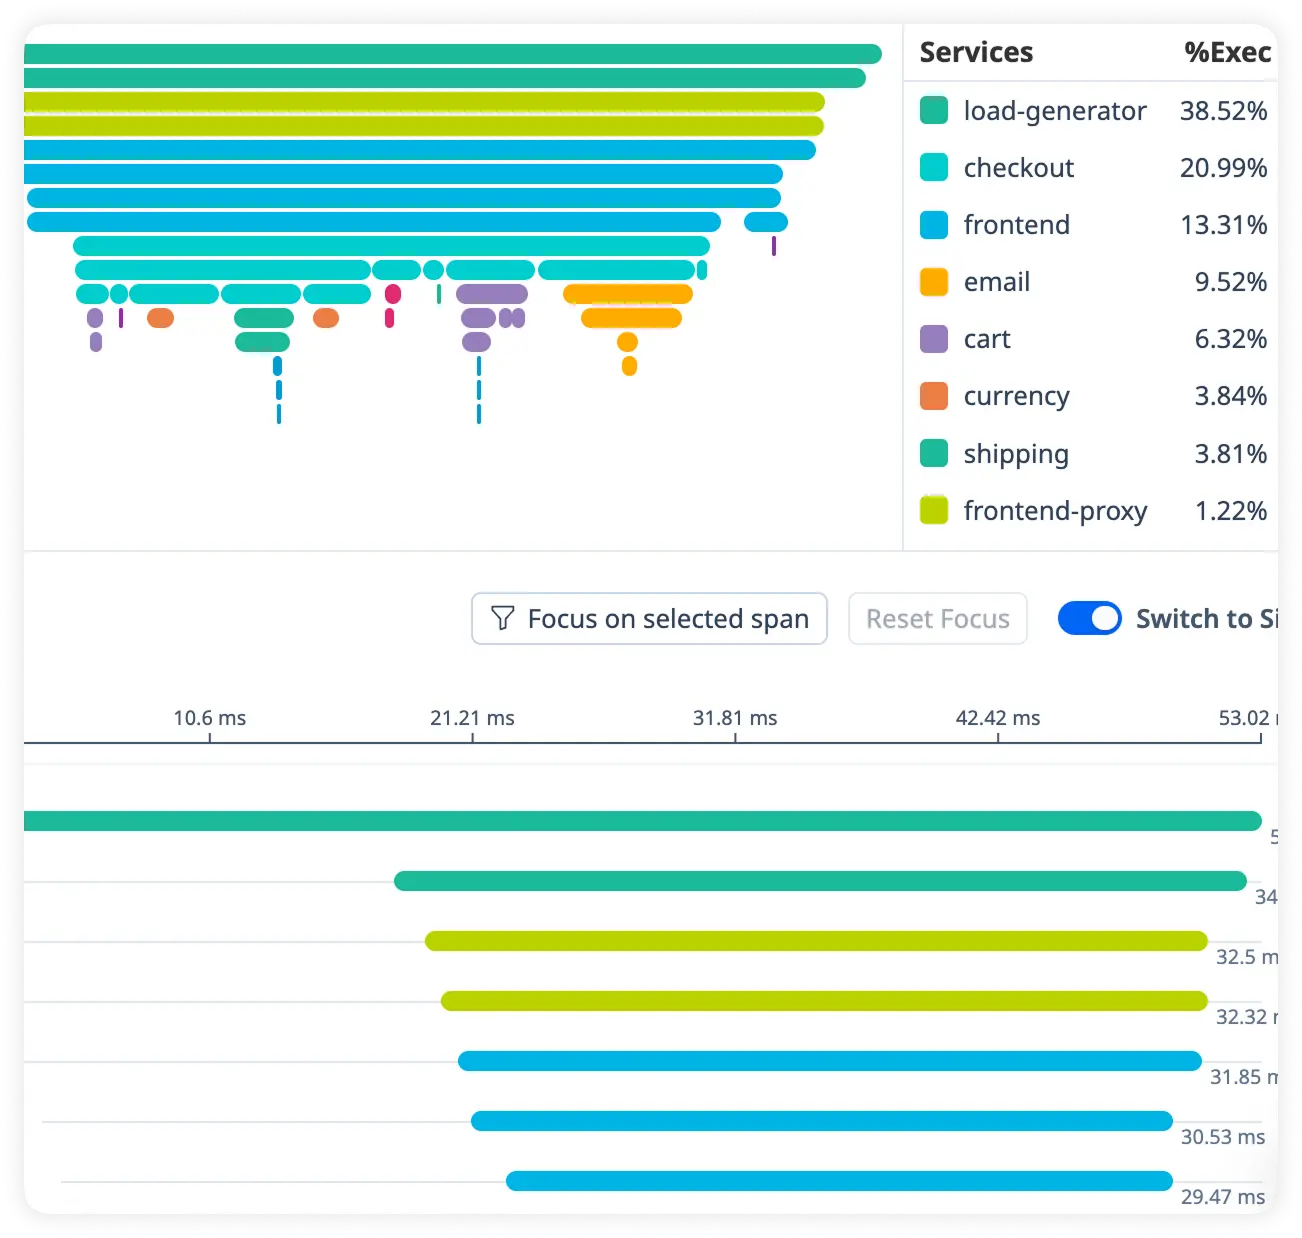
Follow each request across microservices, APIs, databases, and background processes in a single distributed trace. Get deep insight into execution flow, thread activity, and performance behavior across your Java application.
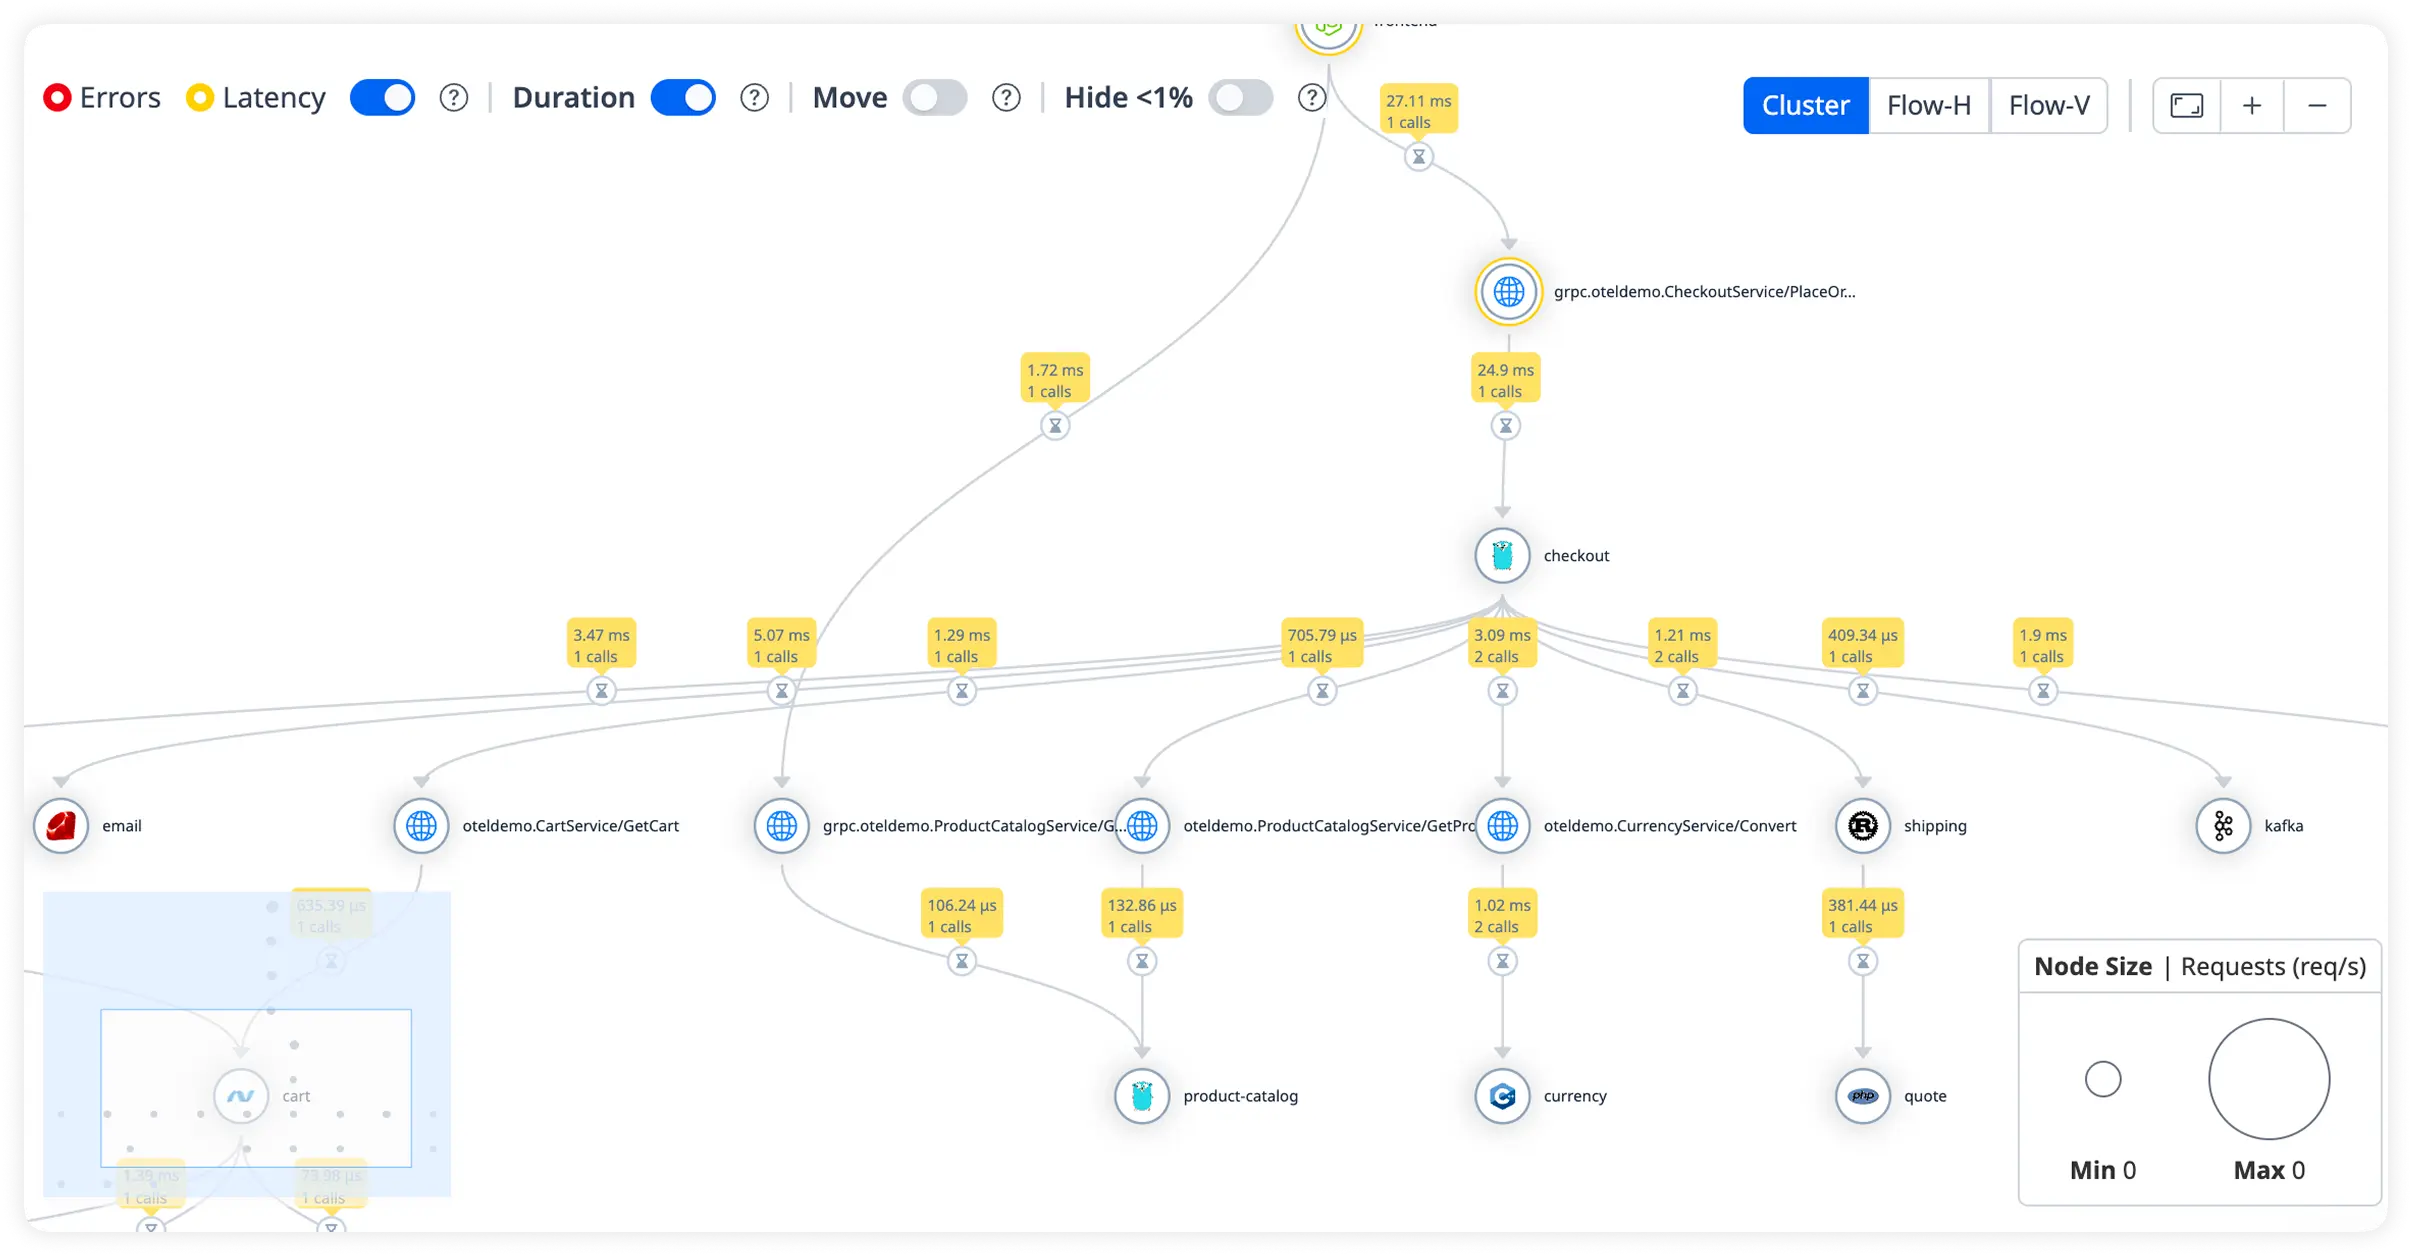
See how Java services communicate with databases, message brokers, caches, and external systems. Quickly identify latency bottlenecks, traffic patterns, and failure hotspots across your architecture.
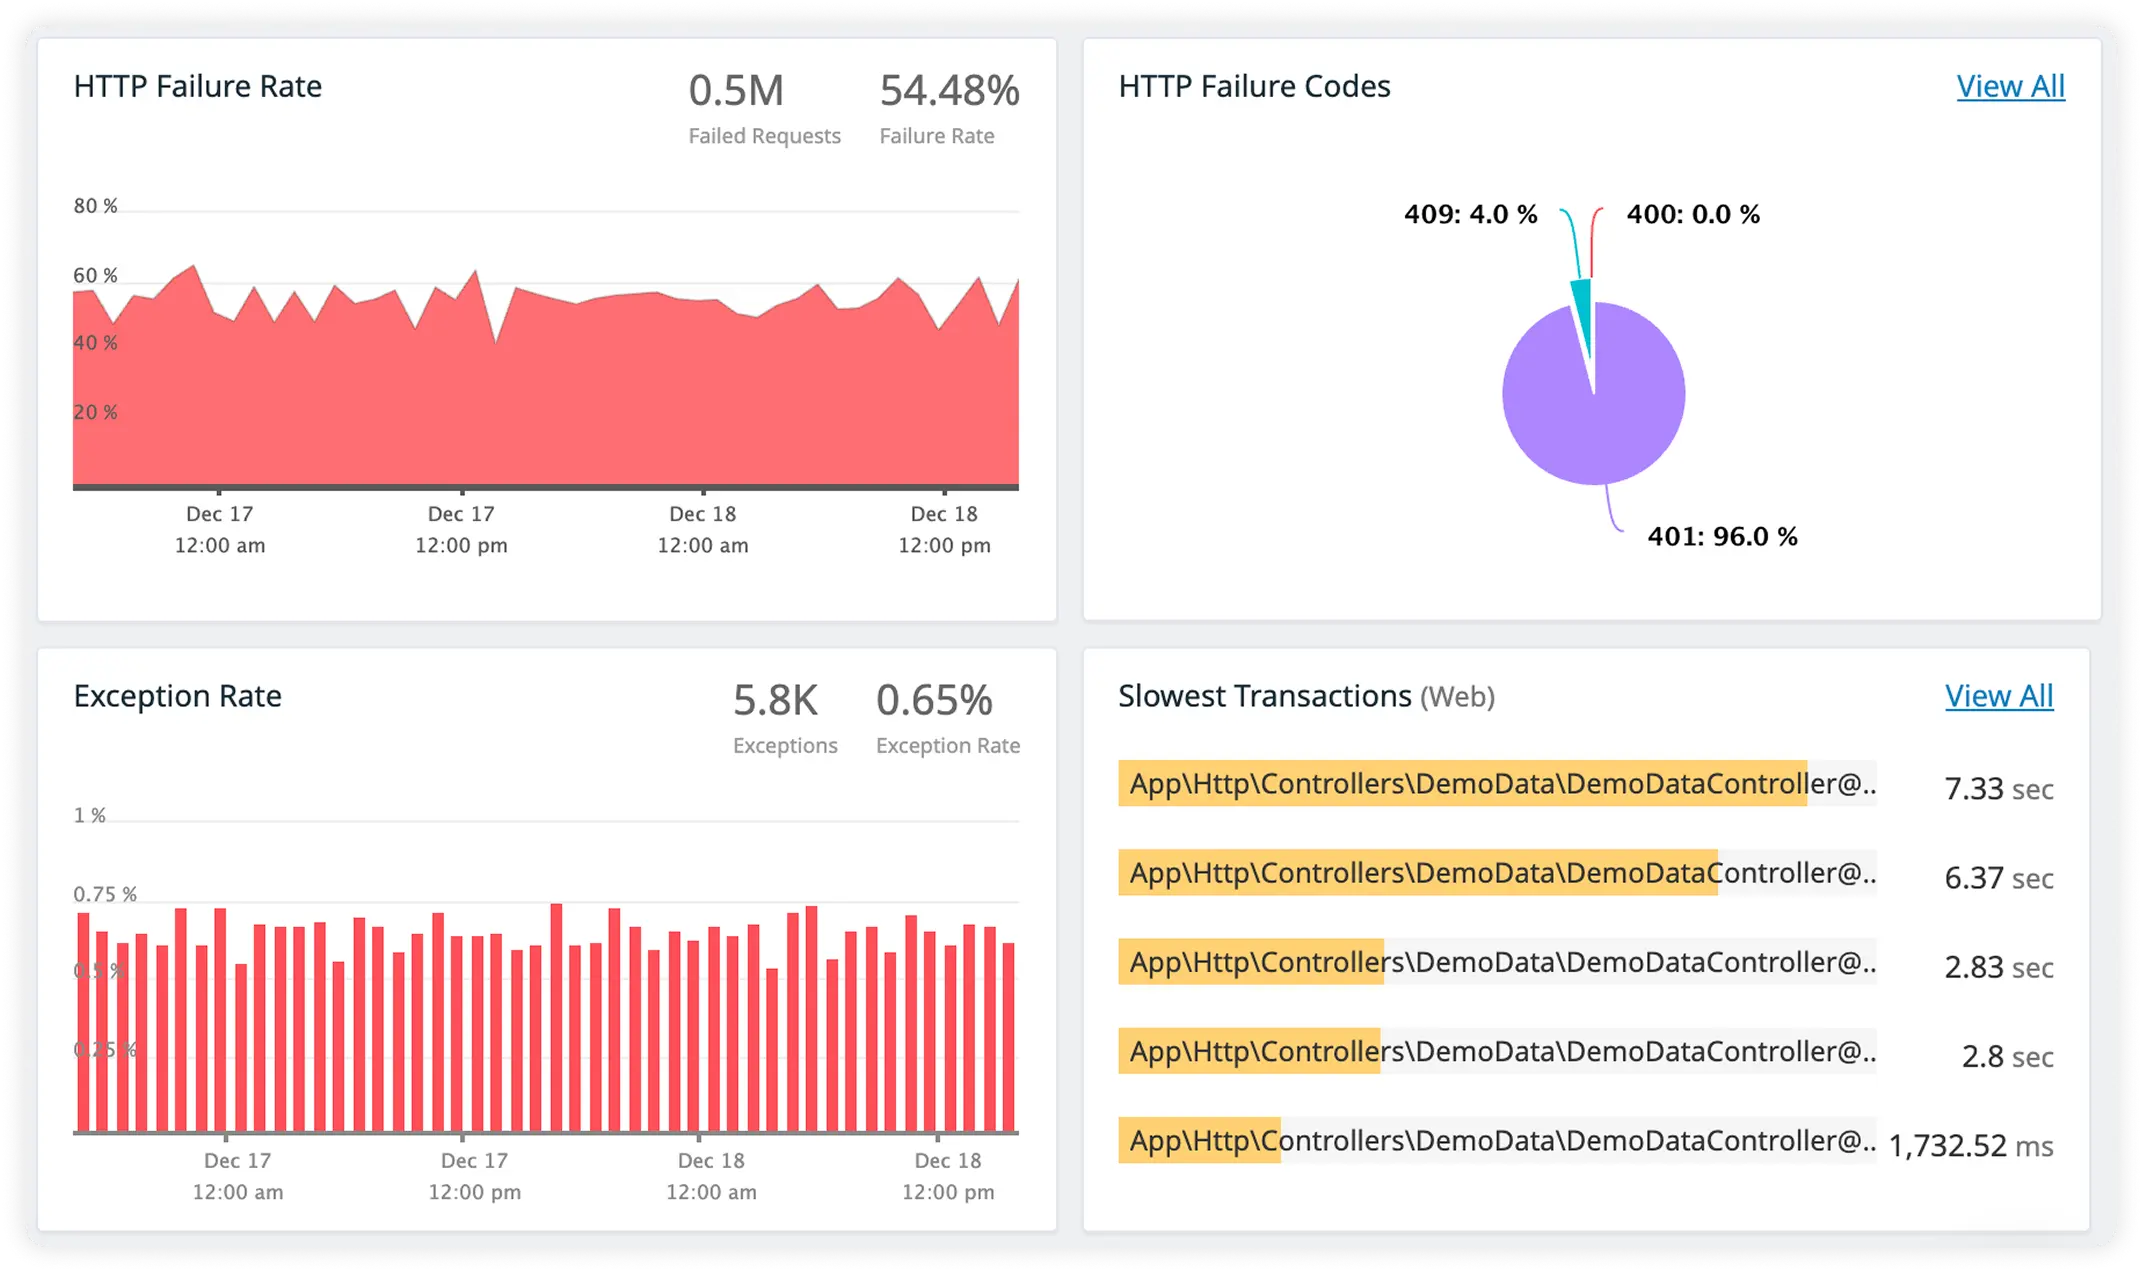
Track core business operations such as order processing, authentication flows, API calls, and batch jobs. Detect slow transactions, error spikes, and performance regressions before they impact users.
Monitor third-party services, APIs, and integrations that your Java applications rely on. Stay ahead of outages and slowdowns that can cascade across your system.
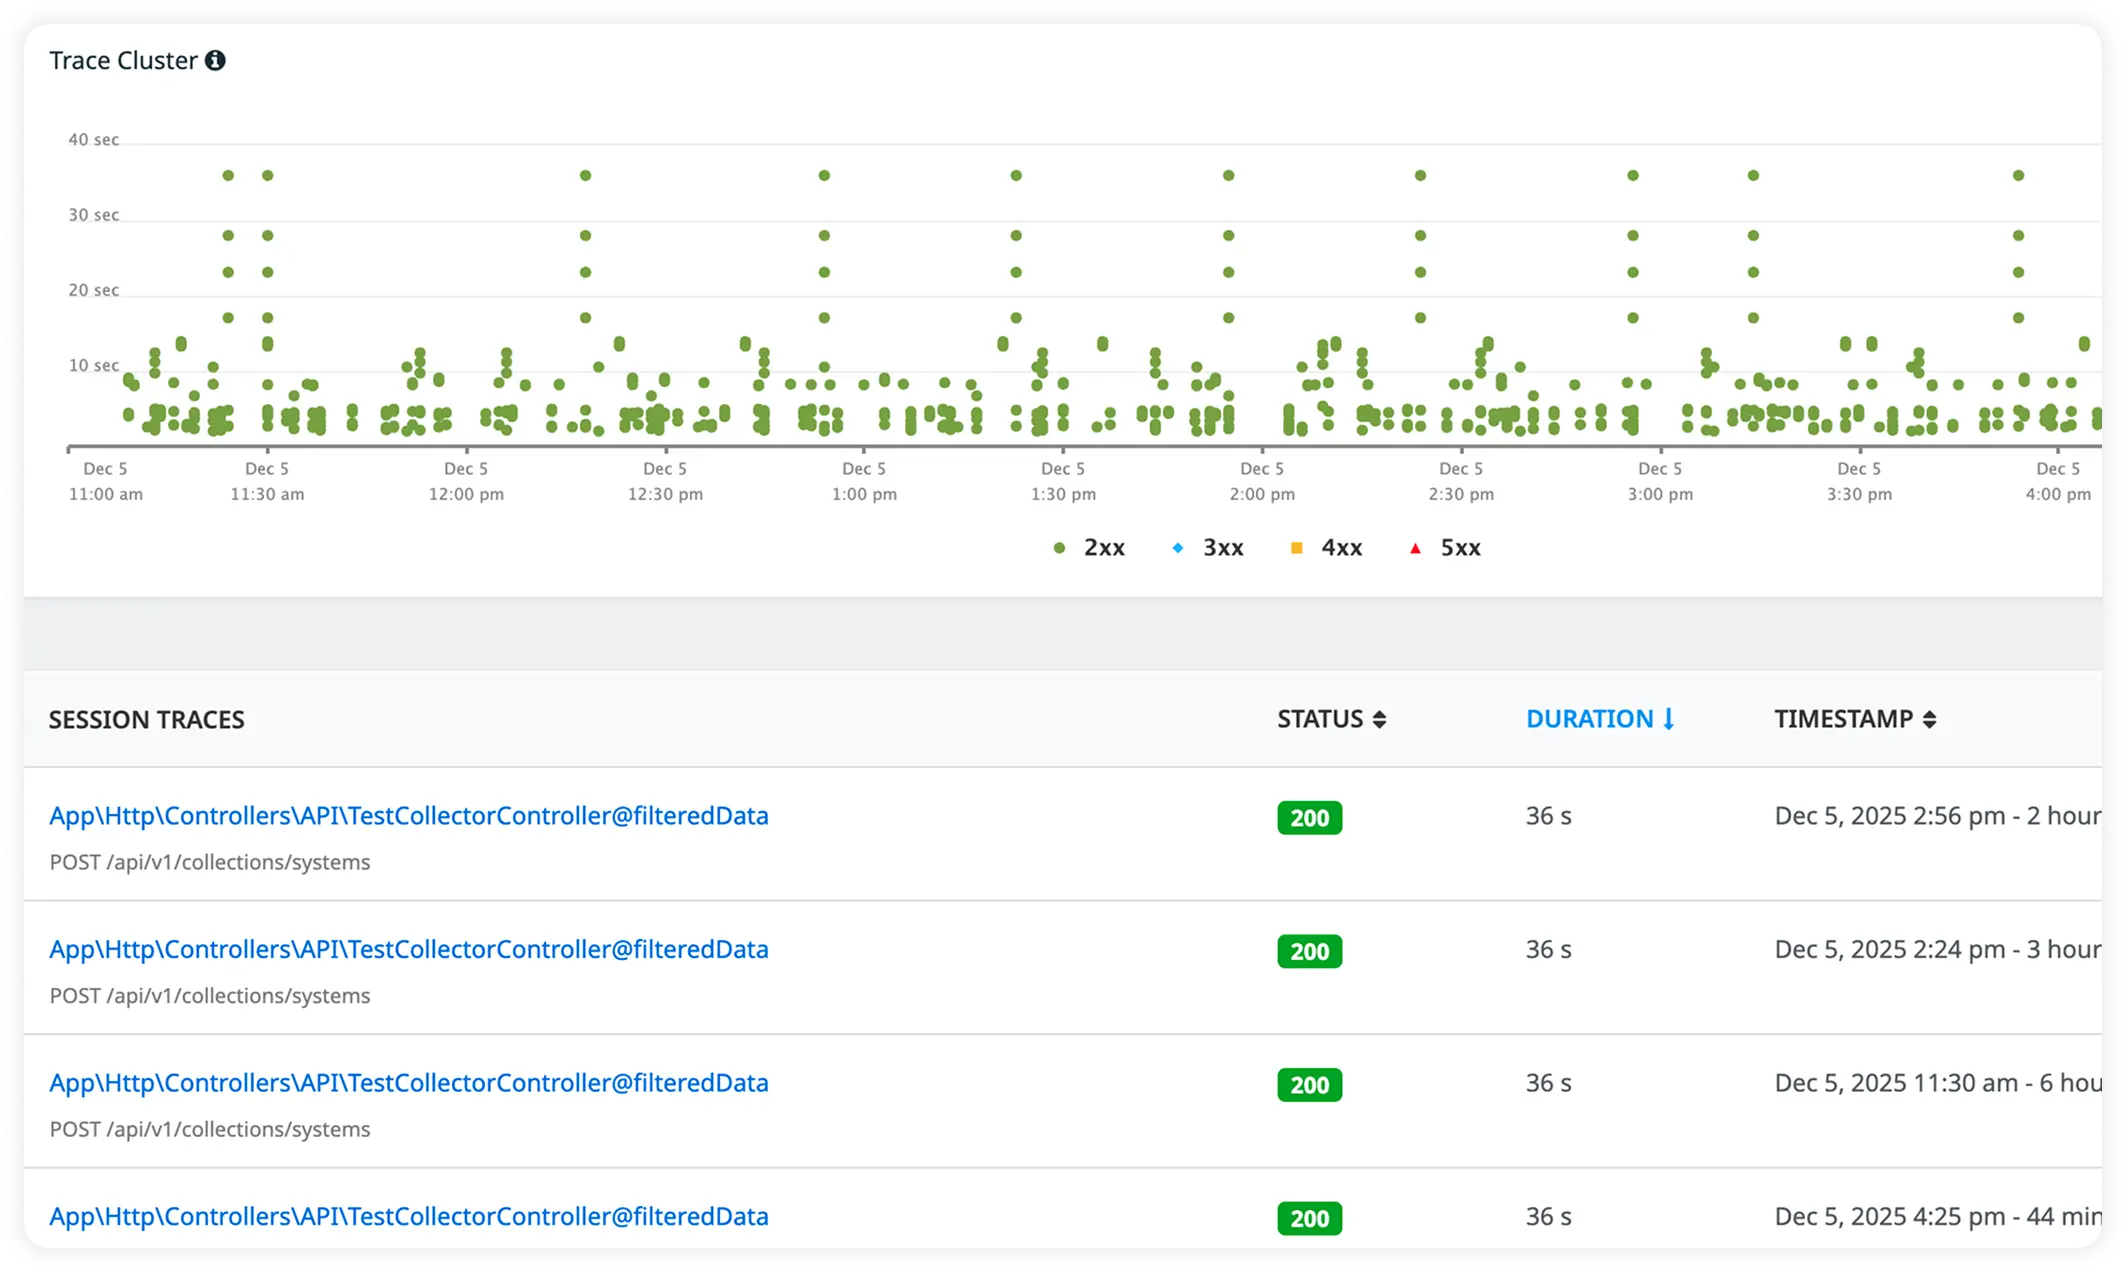
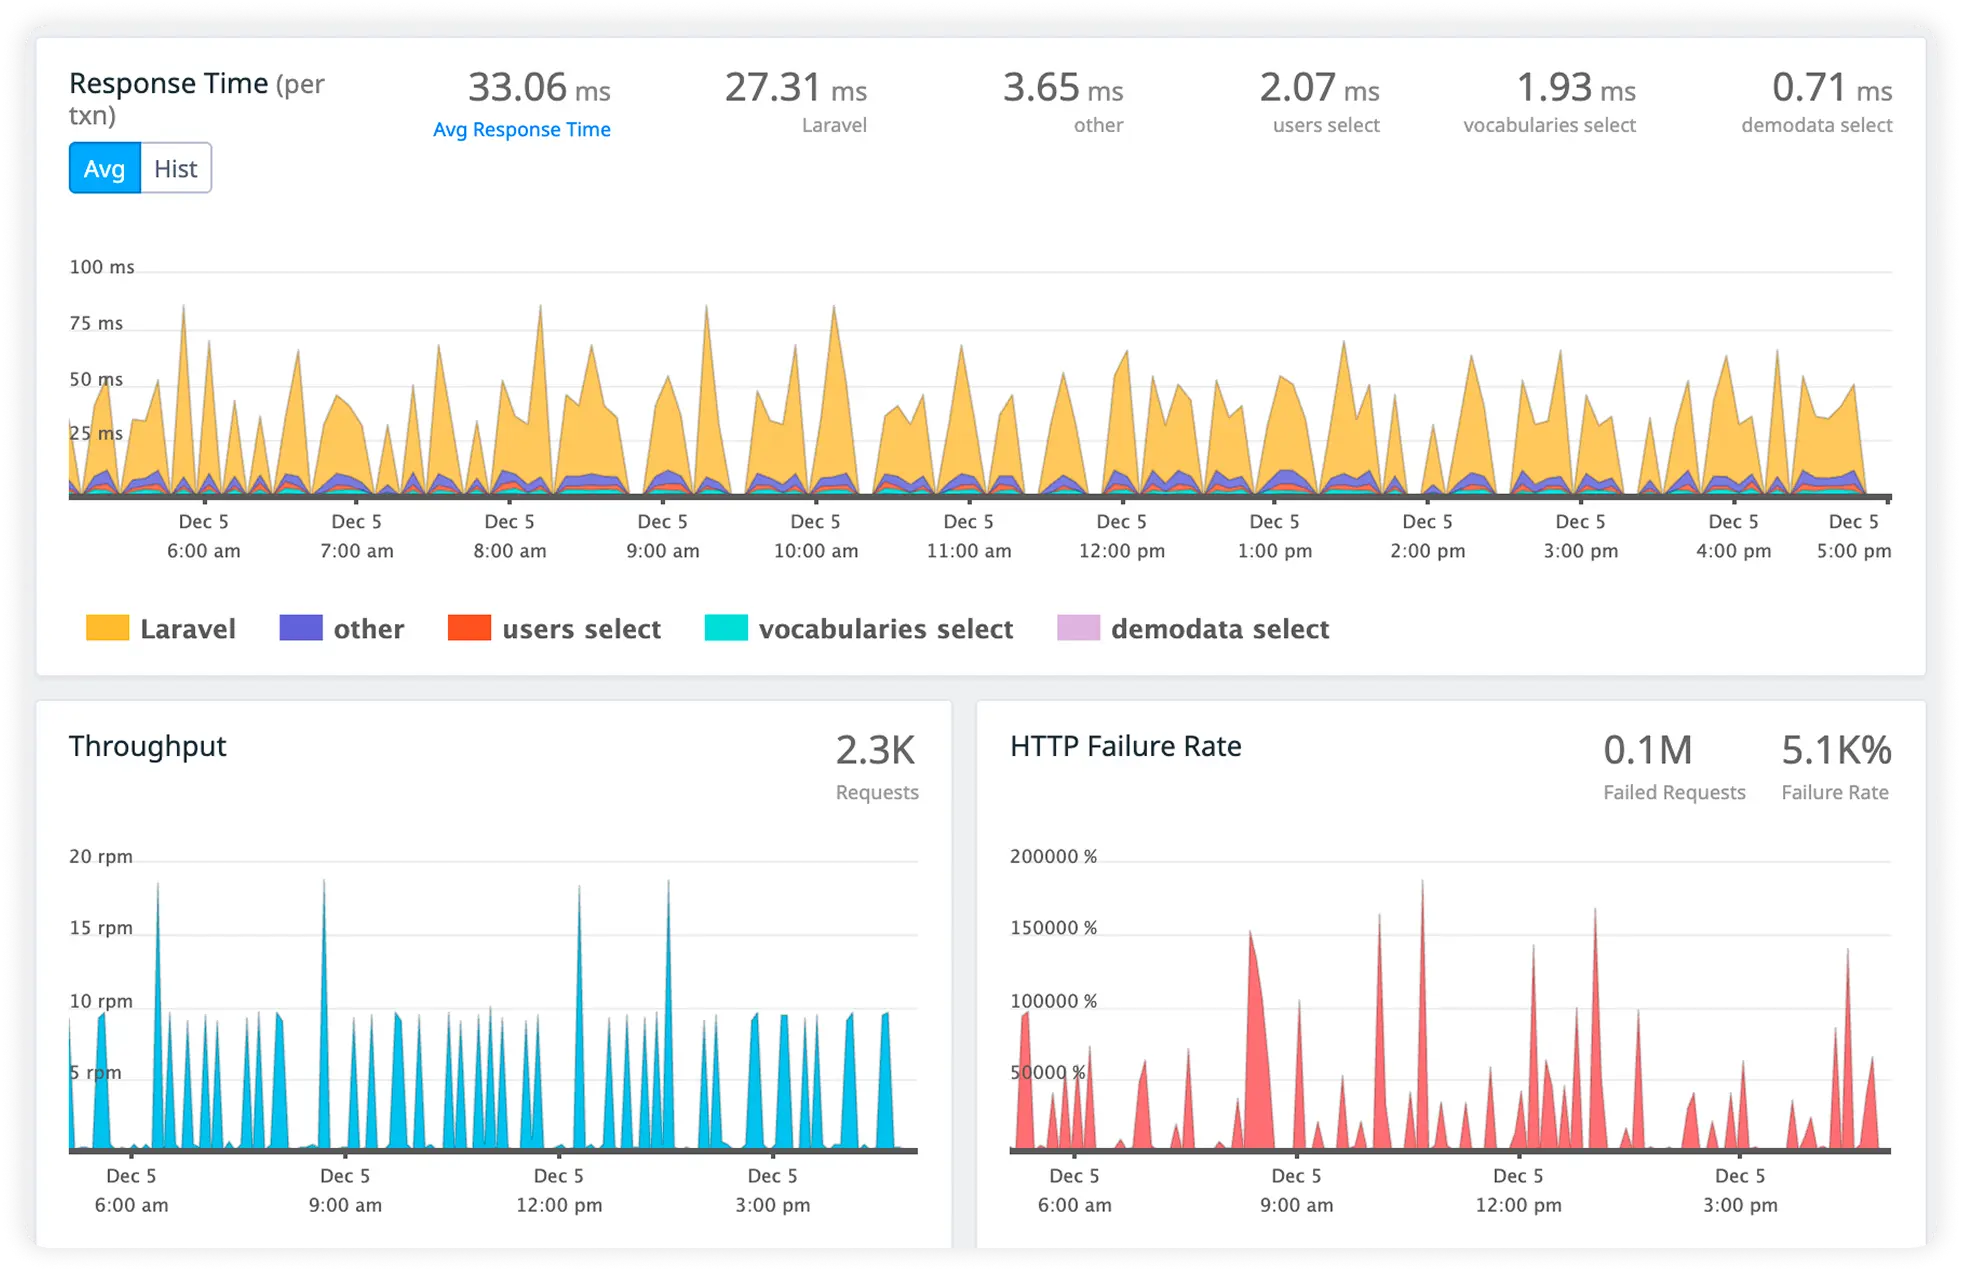
Teams choose Atatus for clear visibility into Java performance without adding complexity to their stack.
Teams gain a grounded understanding of how Java applications behave under real traffic, including how requests flow across services and shared infrastructure during normal operation and failure.
Insight becomes available quickly, without long setup cycles, heavy process changes, or extended learning curves for engineering teams.
Production signals stay consistent and explainable, allowing teams to rely on them during incidents instead of second-guessing their accuracy.
Engineers no longer need to manually stitch together context from multiple sources, reducing mental overhead during investigations.
All engineering roles operate from the same production reality, making collaboration during incidents and reviews more efficient.
Teams make changes with greater certainty, knowing the impact will surface early before performance degradation reaches users..
Teams move from detection to resolution with less trial and error, shortening investigation cycles.
The system aligns with how engineers debug issues in practice, supporting real-world investigation patterns rather than forcing rigid processes.
Over time, incident response becomes steadier and more predictable, reducing escalation pressure and engineering fatigue.
Atatus adapts to how engineering teams work across development, operations, and reliability.
Debug errors and slow paths with the full context of what happened.
Atatus for developersTrack deployments and see how each release affects stability.
Atatus for DevOpsWatch latency and error rates to ship with less production risk.
Atatus for release engineersPricing, deployment, data and the agent. If something is missing, a person will answer it on a demo call.
To measure Java performance, you can use performance monitoring tools such as Java APM. These tools provide insights into metrics like:
Atatus offers comprehensive Java APM capabilities, giving you real-time visibility into these metrics and helping you efficiently detect and resolve performance bottlenecks.
Improving Java performance involves:
Yes, Atatus integrates seamlessly with popular Java frameworks like Express, Nest.js, Restify, and more. It also automatically instruments and monitors specific libraries and components to provide comprehensive performance insights.
Java applications slow down under load due to thread pool exhaustion, blocking I/O calls, inefficient database queries, or increased garbage collection. These issues stack up as traffic grows, leading to higher response times and timeouts.
Production monitoring is critical because Java applications behave very differently in real-world traffic than in test environments. It reveals slow transactions, memory pressure, garbage collection spikes, thread contention, and dependency delays that only appear under actual load. By monitoring production, teams can detect performance regressions early, isolate root causes faster, and keep response times stable as usage scales.


