Investigate Incidents Faster with AI
Atatus AI SRE groups related alerts into one Problem, tags the root cause and runs AI analysis across logs, metrics and traces, with evidence, validation tests and an action plan.

Many alerts. One problem.
Watch related alerts join one Problem as they fire, with the root cause tagged.
- Status
- Active
- Impact
- Services
- Severity
- Slowdown
- Affected
- 1 Svc
- Root cause
- Analyzing
Correlated issues
- 14:02Database Query Time above 0.5 sorder_servicecorrelating
Sample data · alert 1 of 4
The cause, the evidence, the plan.
Add your own step to the action plan, then re-analyze. Your step stays.
AI-generated
- Critical
- High
Team-added
- No team steps yet. Add one, then re-analyze. It stays.
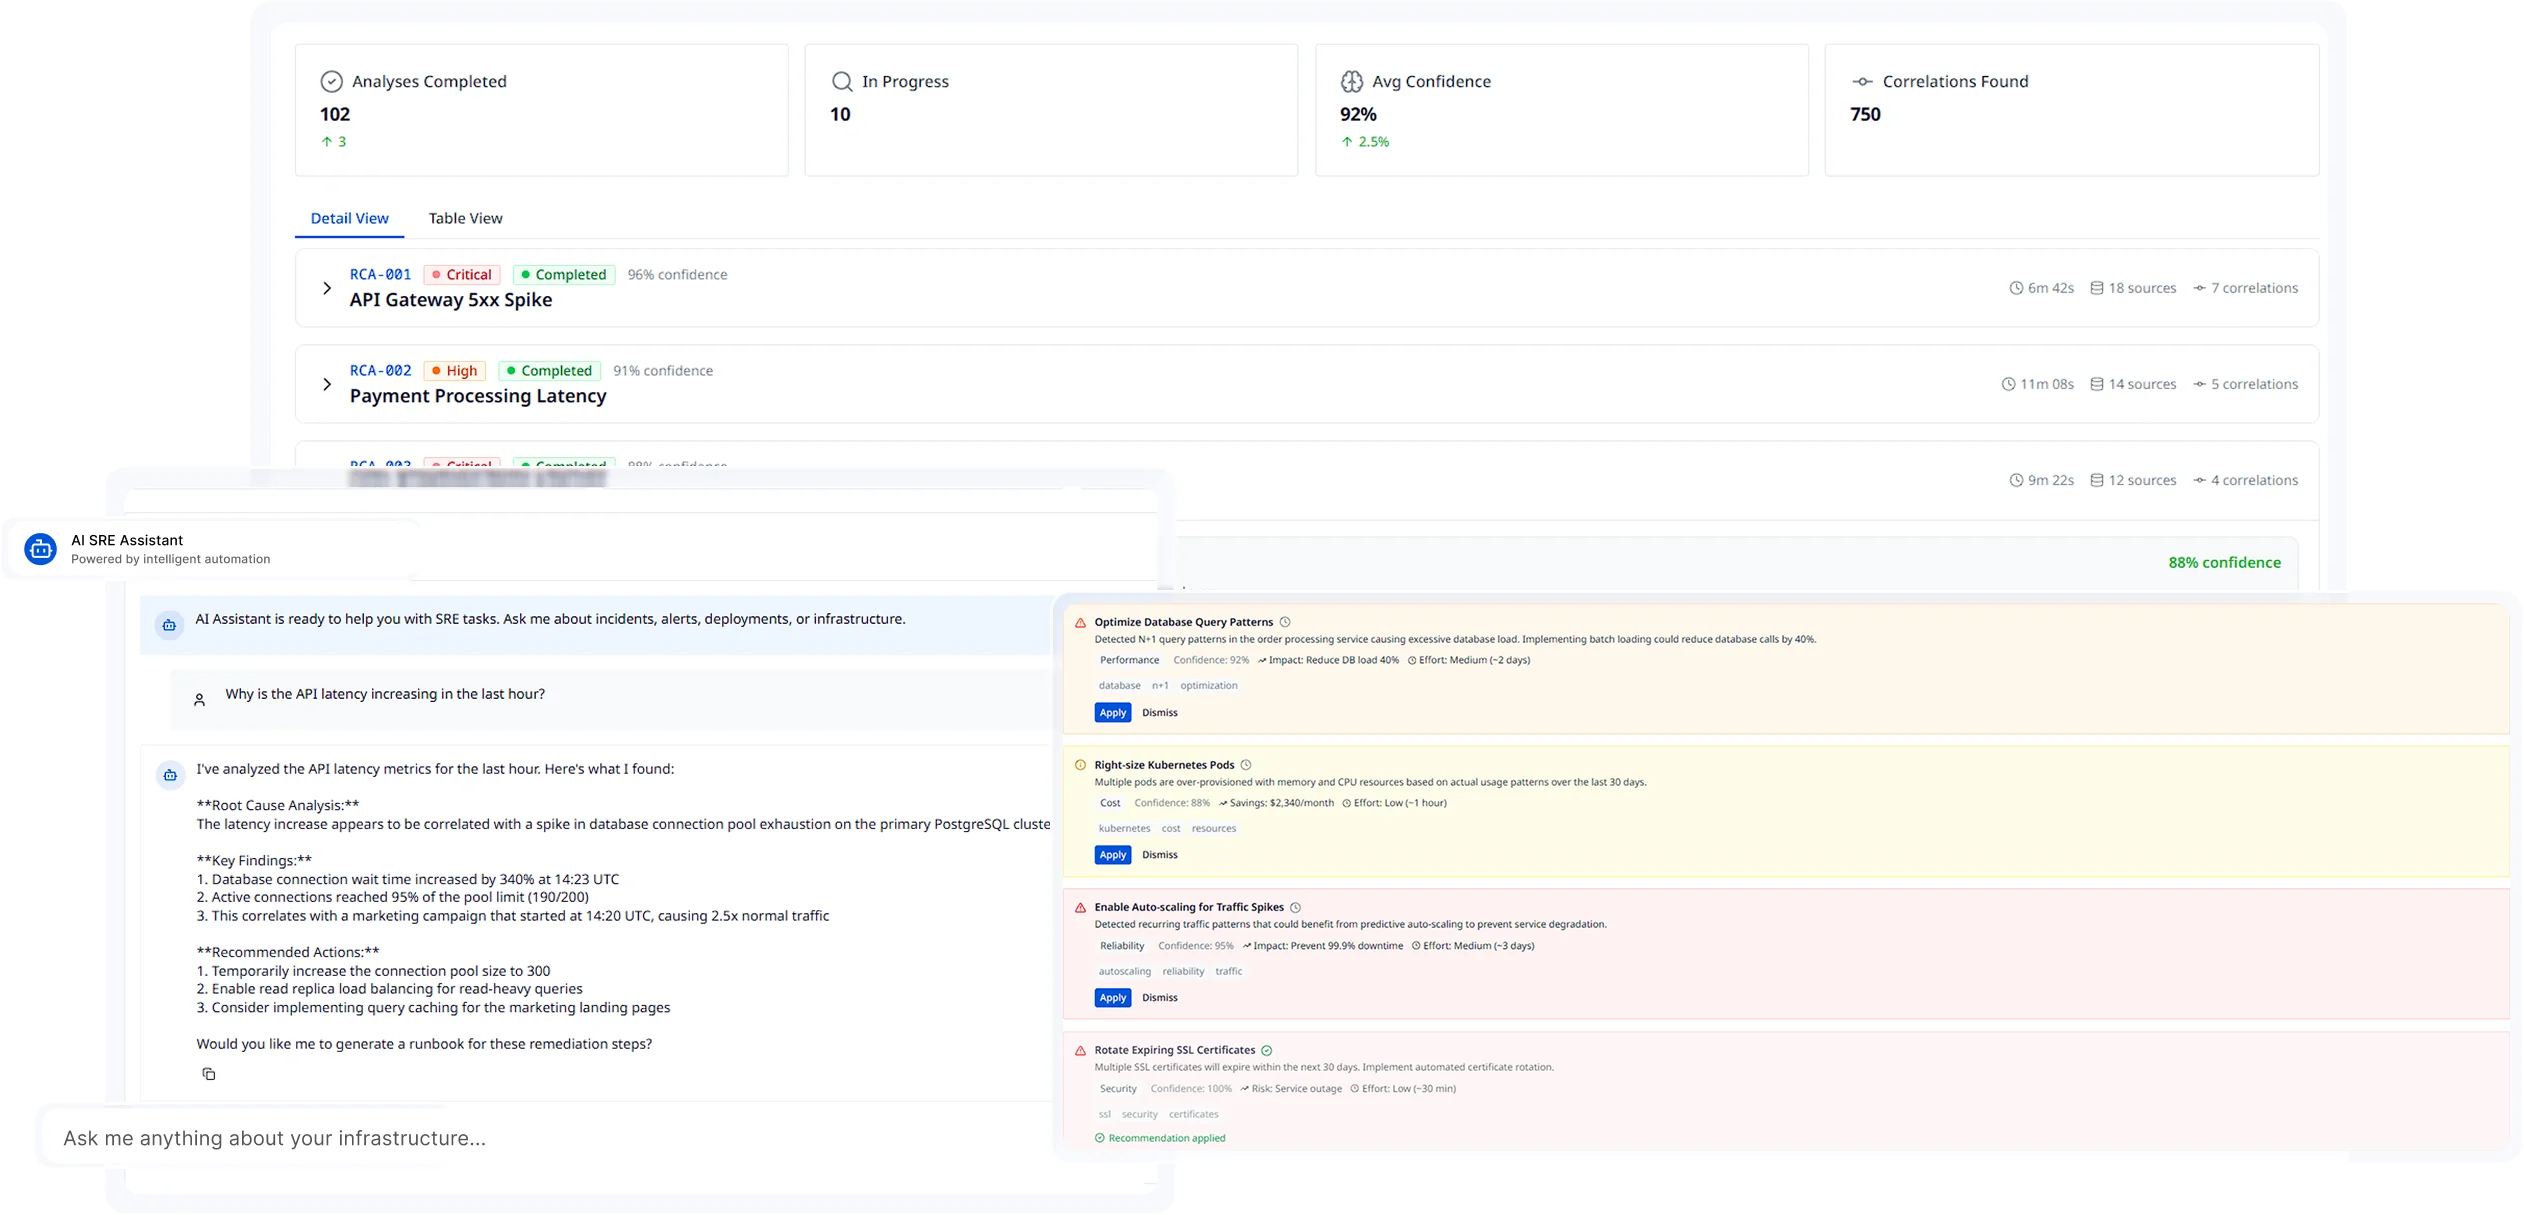
Fixes, ranked and ready.
Each fix shows its confidence, impact and effort. Apply it or dismiss it.
- New
- 12
- Applied
- 34
- Dismissed
- 8
- Impact
- +25%
- Optimize database query patterns
N+1 queries in order processing load the database. Batch loading could cut database calls by 40%.
- Right-size Kubernetes pods
Several pods request far more memory and CPU than they used over the last 30 days.
- Enable auto-scaling for traffic spikes
Recurring traffic peaks slow the checkout path. Scaling ahead of them keeps response times steady.
- Rotate expiring SSL certificates
Three certificates expire within 30 days. Automate the rotation.
Sample data · apply or dismiss a recommendation
A page shaped by what broke.
A slow service and a crashing pod get different panels. Open each Problem.
- Status
- Active
- Impact
- Services
- Severity
- Slowdown
- Detected
- 18 min ago
- Duration
- 18 min
- inventory_serviceJava
- order_serviceJava
Top slowest endpoints
| Endpoint | Avg | Requests | Errors |
|---|---|---|---|
| GET /api/inventory/:id | 2.41 s | 12,480 | 38 |
| POST /api/orders | 2.06 s | 3,912 | 21 |
| GET /api/orders/:id | 640 ms | 8,107 | 4 |
Vitals
- Response time avg
- 1.92 s
- p95
- 3.40 s
- p99
- 4.85 s
- Throughput
- 2.1k rpm
- Error rate
- 0.6%
- Apdex
- 0.58
- DB query time
- 1.31 s
- Remote response
- 120 ms
Top slowest queries
SELECT * FROM order_items WHERE order_id = ?1.12 s avg · 38 per requestSELECT stock FROM inventory WHERE sku IN (?)210 ms avg
Sample data · the middle of the page changes with the impacted entity
Ask, investigate, fix.
Investigations, the AI SRE assistant and recommended fixes in one place.
Questions about AI SRE
Pricing, deployment, data and the agent. If something is missing, a person will answer it on a demo call.
AI SRE applies AI to the work an SRE does during an incident: grouping related alerts, finding the root cause and planning the fix. In Atatus, related alert issues become one Problem with the root cause tagged, and AI Analysis explains why it broke with evidence, validation tests and an action plan.
When alert issues happen in the same window on connected services, or on the same host, pod or workload, Atatus groups them into one Problem and tags each issue as root cause or symptom. The Problem page shows the impacted entities, the metrics that matter for them and the detected root cause. For a deeper look, run AI Analysis on the Problem. It reviews logs, metrics and traces and returns a probable root cause with a confidence score.
No. AI SRE does the correlation and the first pass of the investigation, and your team stays in charge. Each finding comes with evidence and validation tests you can run yourself. Your team can add its own steps to the action plan, and those steps stay when the analysis is re-run. You can also mark each analysis as helpful or not helpful.
It starts from the alert issues Atatus raises on your services, hosts and Kubernetes workloads. For a service, the Problem page shows the slowest endpoints, response time, throughput, error rate, Apdex, database query time and remote calls. For a Kubernetes workload, it shows a diagnosis, container state, CPU and memory against limits, and warning events. AI Analysis looks across logs, metrics and traces, and labels each piece of evidence as a metric or an exception with its source.
Click AI Analysis on a Problem. The result has five tabs: Primary (the probable root cause with a likelihood and confidence, the evidence, validation tests such as running EXPLAIN ANALYZE on a slow query, and a recommended action), Contributing (secondary factors with a weight), Alternatives (hypotheses it ruled out), Action plan (prioritized steps you can check off) and Prevention (longer-term fixes). Each run is saved as a version, so you can re-analyze when new data comes in.
Yes. Issues on the same pod or workload are grouped into one Problem, and a Problem on Kubernetes infrastructure gets its own panels: a plain-language diagnosis such as a container that was terminated, container state with restart count and memory or CPU against limits, and the most frequent warning events. Flow View also shows active Problems on its Kubernetes map.
By removing steps between the first alert and the fix. Related alerts arrive as one Problem instead of many, the root cause is tagged, the Problem page shows the metrics for the affected service or workload, and AI Analysis gives you evidence, a validation test and a prioritized action plan. Comments keep the investigation notes on the Problem itself.
AIOps is a broad term for applying AI to IT operations, often event correlation and ticket workflows. AI SRE is narrower: it focuses on production incidents in your applications and infrastructure. In Atatus it works on the APM, infrastructure and Kubernetes data you already send, groups alerts into Problems and explains the root cause with evidence from that data.
Correlation starts with alert issues. Atatus links issues that fire in the same window on services that call each other, or on the same host, pod or workload, and the Problem's diagram shows how those entities connect. AI Analysis then reviews logs, metrics and traces for that Problem, and each piece of evidence names its source, such as APM Analysis or Correlated Issues.