Unified Observability for Hybrid Cloud Environments
Full-stack monitoring across on-premises infrastructure, cloud workloads, and Kubernetes clusters including metrics, logs, and distributed traces correlated in one platform.
68%
Faster MTTR
4x
Reduction in debugging time
92%
Fewer missed production issues
5 min
Average time to first insight
End-to-end monitoring across hybrid systems
Atatus consolidates metrics, logs, and distributed traces from every layer of your stack, whether it runs in public clouds, private data centres, containers, or on-premise servers, into a single observability platform with correlated context.
One platform to monitor every layer of your hybrid infrastructure
Atatus consolidates metrics, logs, and distributed traces from every layer of your stack whether it runs in a public cloud, a private data centre, or on bare-metal servers into a single observability platform with correlated context.
- Monitor AWS, Azure, GCP, Kubernetes, and on-premise environments from one platform
- Correlate infrastructure metrics, application performance, logs, and traces in real time
- Eliminate blind spots across containers, databases, microservices, and network layers
Get to root cause before your users do
Other tools tell you something is wrong across your hybrid environment. Atatus shows you exactly where, why, and what changed without switching tabs.
Quick setup, works across any environment
One agent install covers on-premises servers, cloud VMs, and Kubernetes nodes. Cloud account integrations for AWS, GCP, and Azure connect in minutes. No per-environment configuration overhead.
Full-fidelity telemetry, <1% overhead
Collect infrastructure metrics, distributed traces, and logs from every layer of your hybrid stack without impacting application performance. No sampling, no blind spots, no trade-offs between coverage and cost.
Real-time alerting based on actual patterns
Alerts fire based on the behaviour of your hybrid environment, not generic static thresholds. Get notified when something in your infrastructure genuinely needs attention, not every time a metric twitches.
Predictable pricing, no data tax
Per-host pricing means your monitoring cost doesn't explode with data volume. Instrument everything across cloud and on-premises without second-guessing whether a metric or log line is worth the cost to store.
Everything in one tab. Nothing left to correlate manually
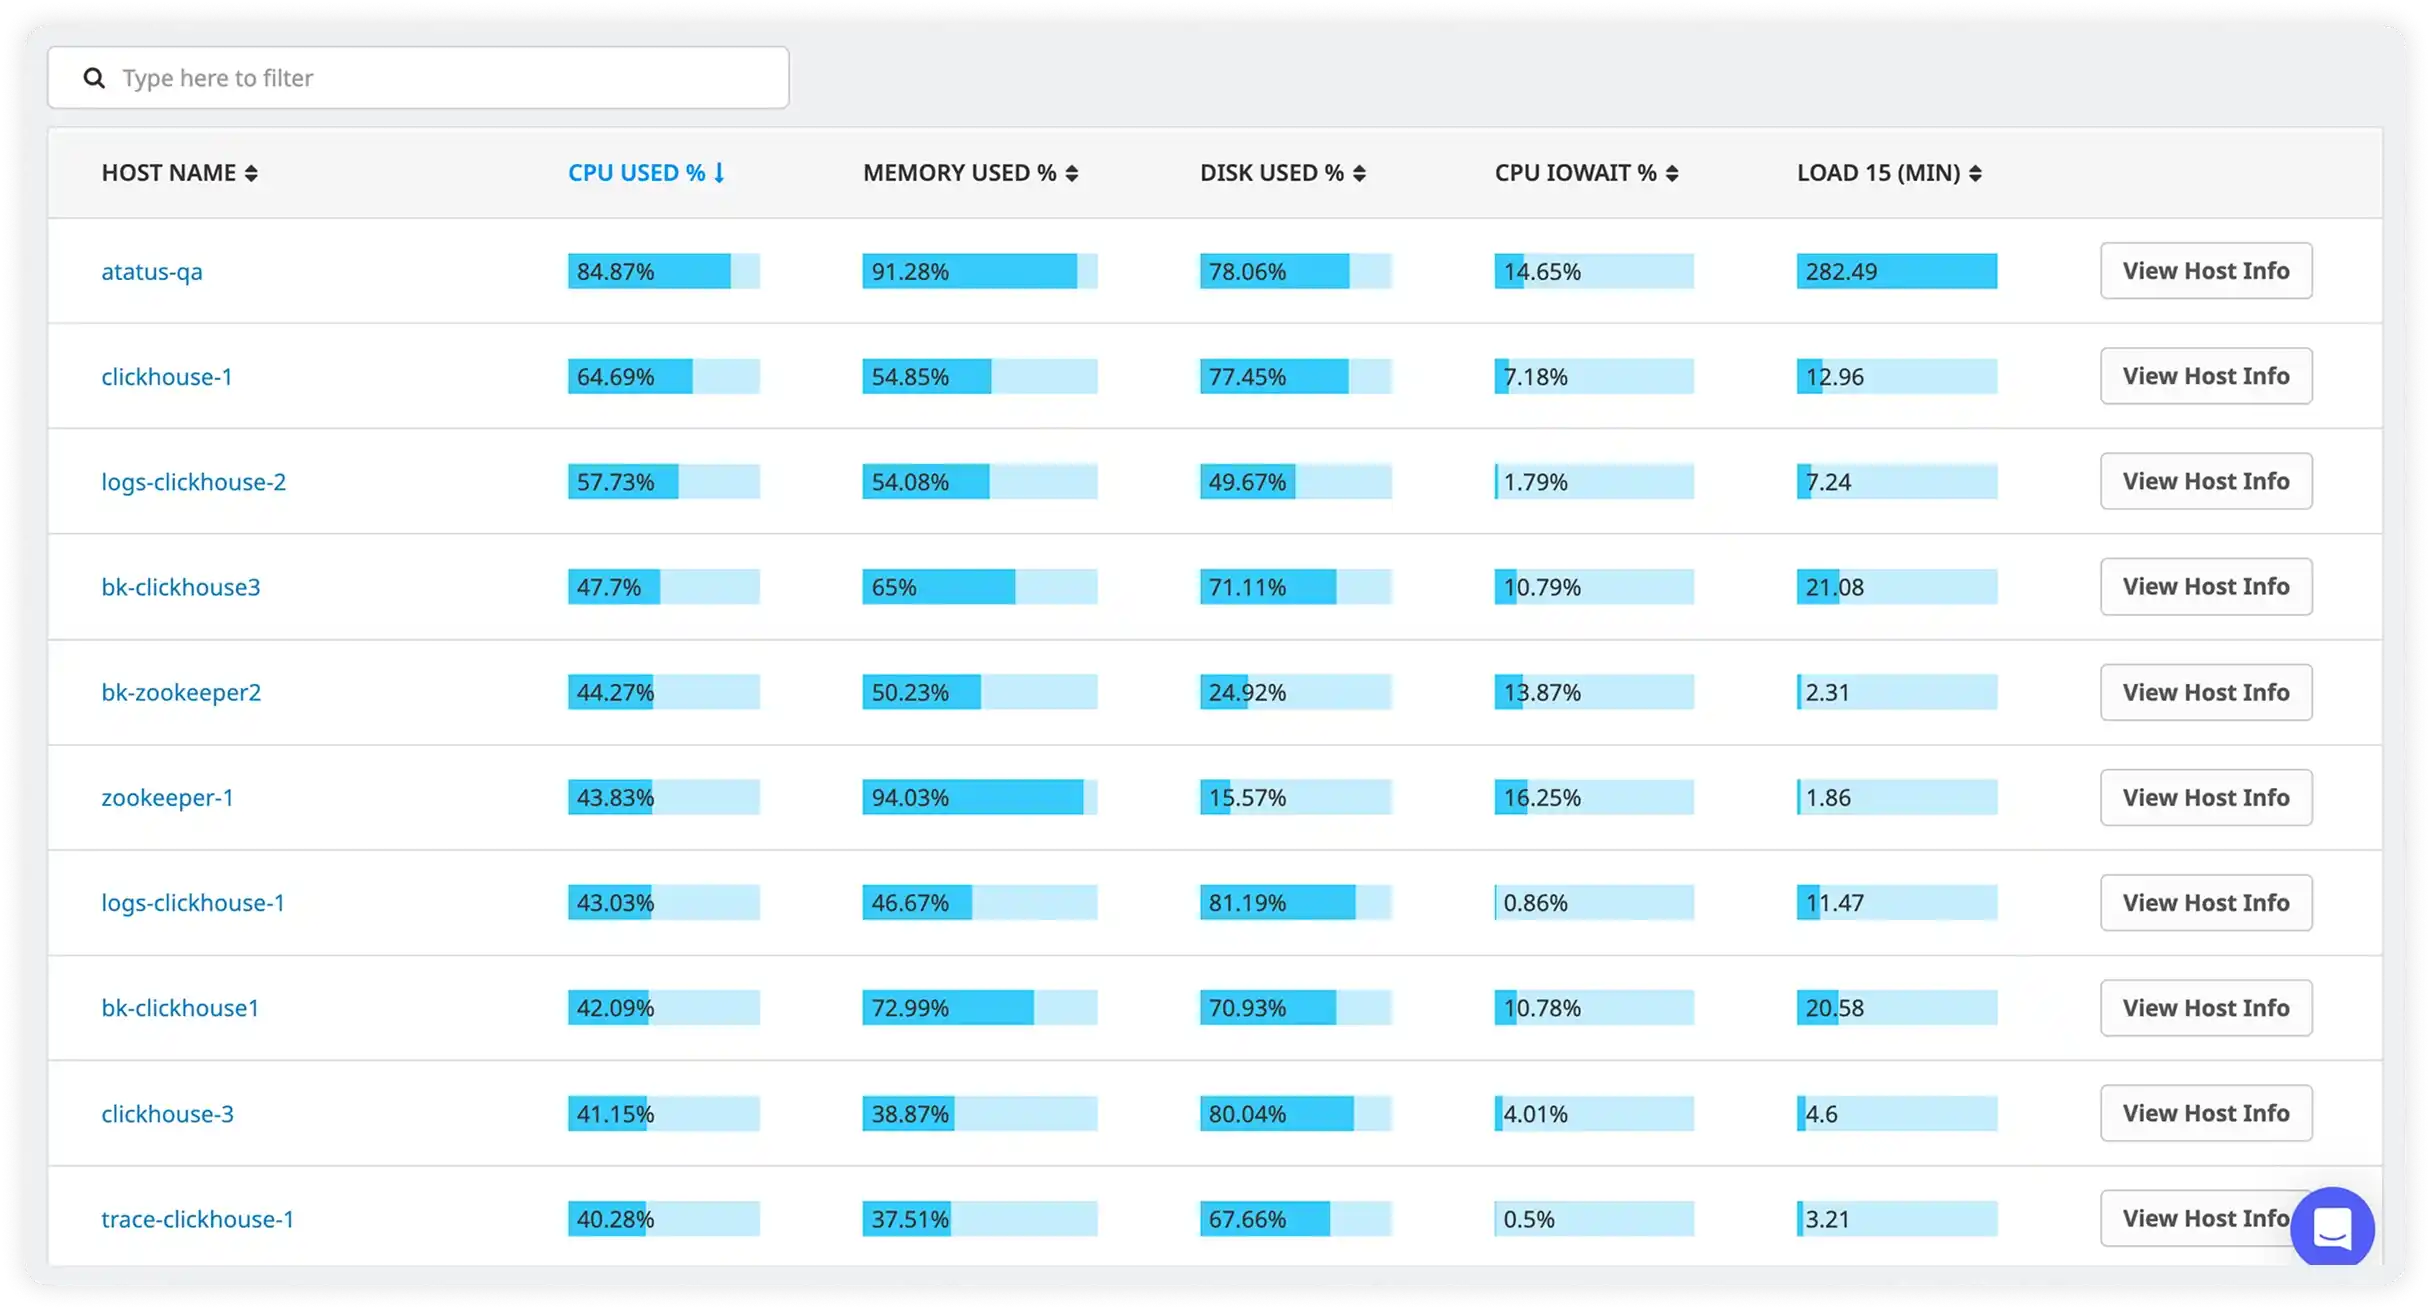
Hybrid Cloud Infrastructure Monitoring
Collect CPU, memory, disk, and network metrics from on-premises servers, cloud VMs, and bare-metal hosts. Every environment visible in a single infrastructure dashboard with consistent tagging across cloud and on-prem.
Distributed Tracing Across Environments
Follow a single request as it crosses microservices, APIs, and databases spanning on-premises and cloud boundaries. Pinpoint exactly which service and which environment is responsible for latency spikes.
Multi-Cloud Visibility
Monitor AWS, Google Cloud Platform, and Azure workloads alongside on-premises infrastructure from one workspace. Eliminate the per-provider tool sprawl that prevents a coherent picture of your infrastructure health.
Centralised Log Analytics
Aggregate logs from cloud services, on-premises servers, Kubernetes containers, and application runtimes into a single searchable store. Every log line is automatically correlated with the trace and metric that generated it.
Kubernetes & Container Monitoring
Full observability into Kubernetes clusters running on-premises, in EKS, GKE, or AKS. Node health, pod resource utilisation, deployment status, and container performance in one view regardless of where the cluster runs.
Real-Time Alerting & Root Cause Analysis
Navigate from a triggered alert directly to correlated logs, the distributed trace, and infrastructure health for the affected services. Fix the problem, not the puzzle without leaving the platform or switching tools.
Plugs into your existing stack
No rip-and-replace. Connects to the tools your team already uses from cloud providers to CI/CD to alerting.
Unified Observability for Every Engineering Team
Atatus adapts to how engineering teams work across development, operations, and reliability.
Developers
Trace requests, debug errors, and identify performance issues at the code level with clear context.
DevOps
Track deployments, monitor infrastructure impact, and understand how releases affect application stability.
Release Engineer
Measure service health, latency, and error rates to maintain reliability and reduce production risk.
Powering better performance
for modern teams
Feedback from teams improving monitoring and debugging workflows
"Solid Product even better support", The integration path is incredibly simple/easy and the overall interface is very intuitive. That said, I had a handful of odd use cases that the support team was incredibly responsive in helping me work through.

Wes D
Site Reliability Engineer