
Application Performance Monitoring
Atatus APM delivers ready-to-use dashboards with real-time metrics, detailed transaction traces, slow database queries, and inefficient network calls. Quickly uncover root causes and resolve issues to enhance application performance and reliability.
10x Faster
RC Identification
<50 ms
Trace Speed
100%
Transaction Visibility
Everything in One Agent Install
No per-feature billing. No separate agents. No YAML topology files. One install gives you the full capability set, automatically instrumented across your stack.
Database Query Analysis
Query text, execution time, and N+1 detection with exact endpoint attribution. Missing index recommendations. Supports 6 databases.
External API Monitoring
Tracks every outbound HTTP call with per-provider latency trends. Attributes slowness to Stripe, Twilio, or S3, not your code.
Correlated Signals
Jump from trace → log → infrastructure metric in one click. Correlate APM anomalies with deployments, infra events, and log spikes automatically.
Continuous Profiling
Always-on CPU and memory profiling with zero configuration. Flame graphs linked to the transaction traces that triggered them.
Intelligent Alerting
Baseline-aware alerts that adapt to your traffic patterns, no static threshold tuning. Apdex, error rate, latency, and throughput alerts with Slack, PagerDuty, and OpsGenie integrations.
Flat-Rate Pricing
One per-host price covers APM, logs, RUM, and infra. No per-signal billing. No log volume penalties. Forecast your bill without a spreadsheet.
What Atatus APM
Actually Shows You?
Four interconnected signal types from a single agent. Here's exactly what your team sees the moment an issue fires and why each capability translates directly to faster fixes.
Trace‑level Visibility Across Your Stack
See every request from frontend or API to backend services, including timing, errors, and relationships. Quickly pinpoint performance issues and link them to code and user impact.
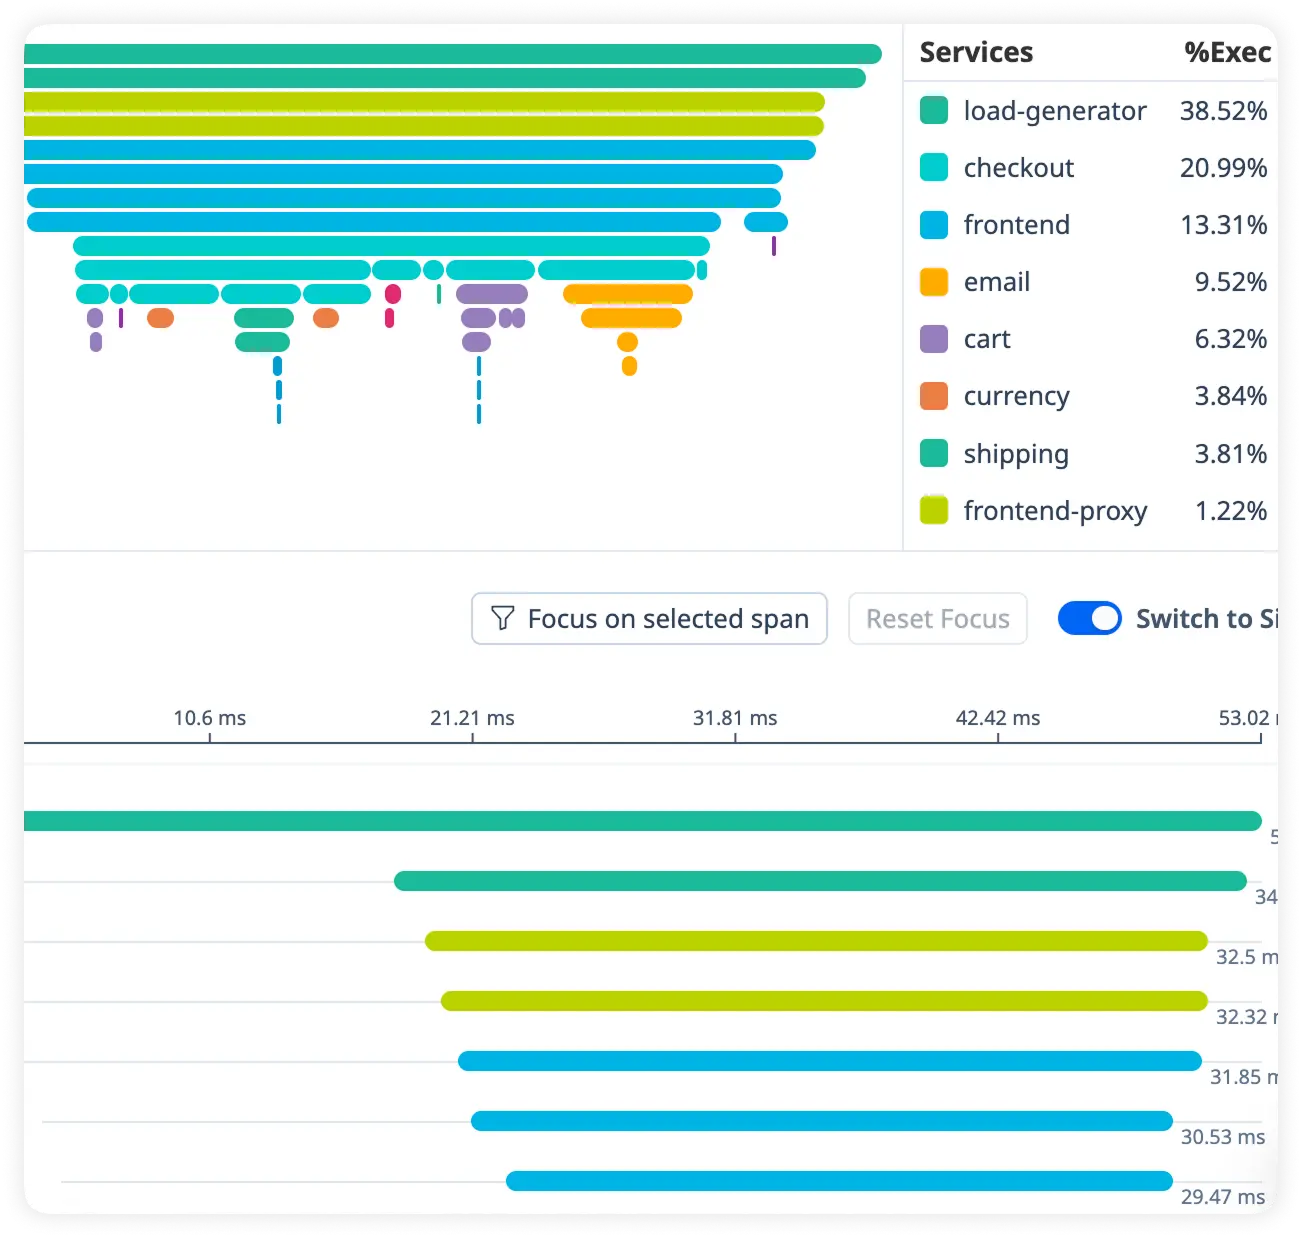
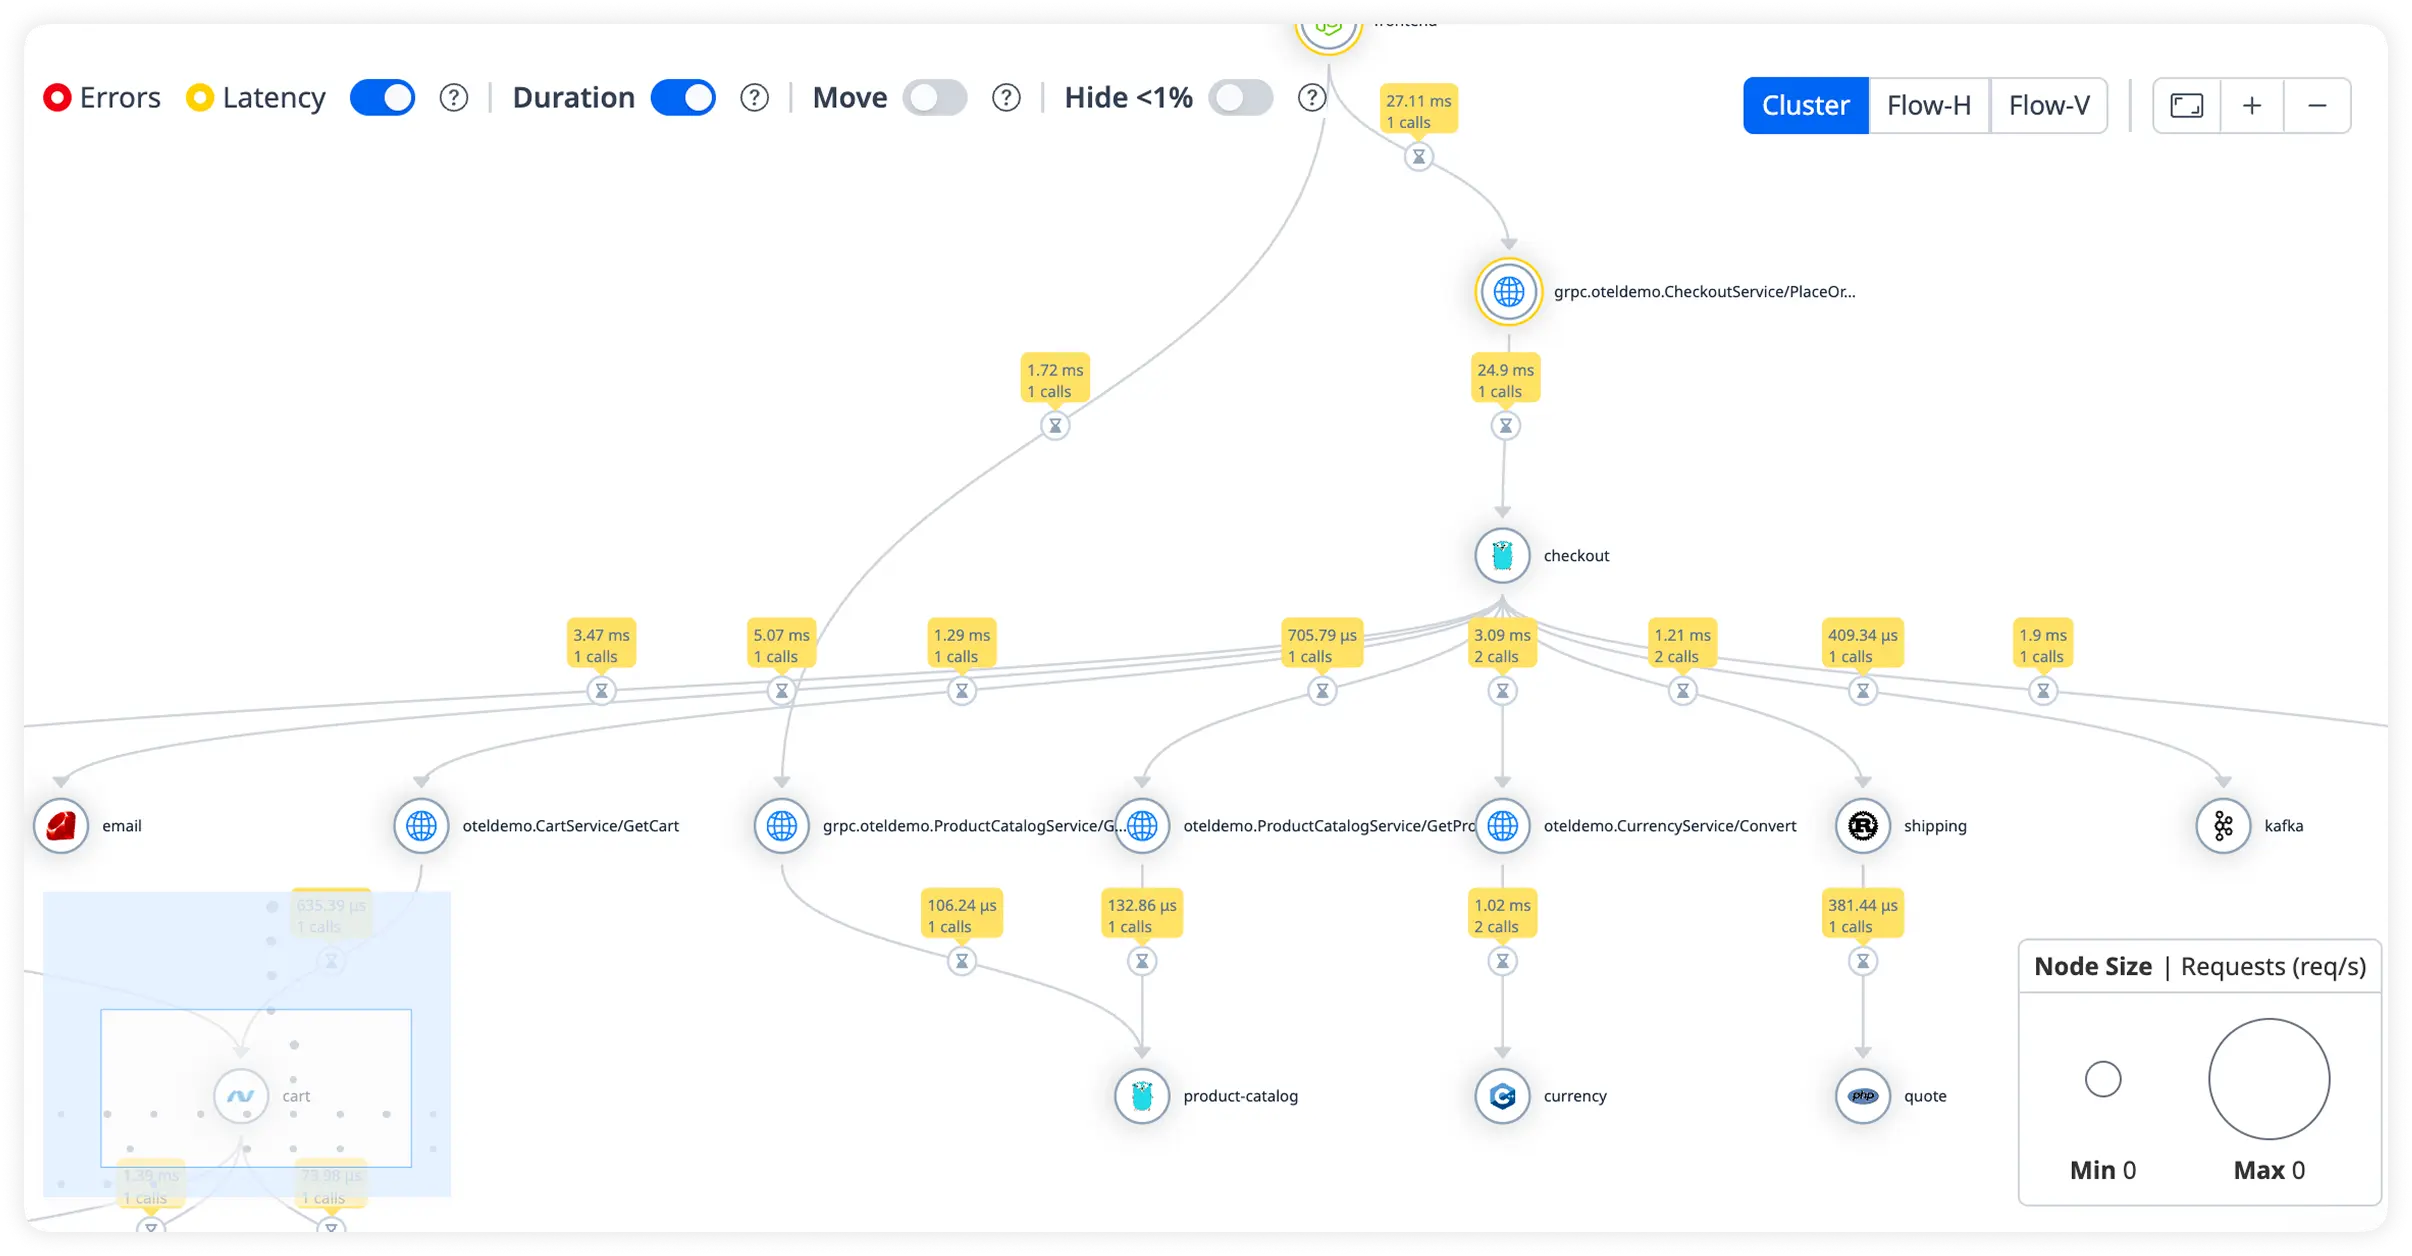
Visualize Service Dependencies
Map service interactions, frequency, and latency to uncover bottlenecks. Overlay health metrics for a clear view of system performance.
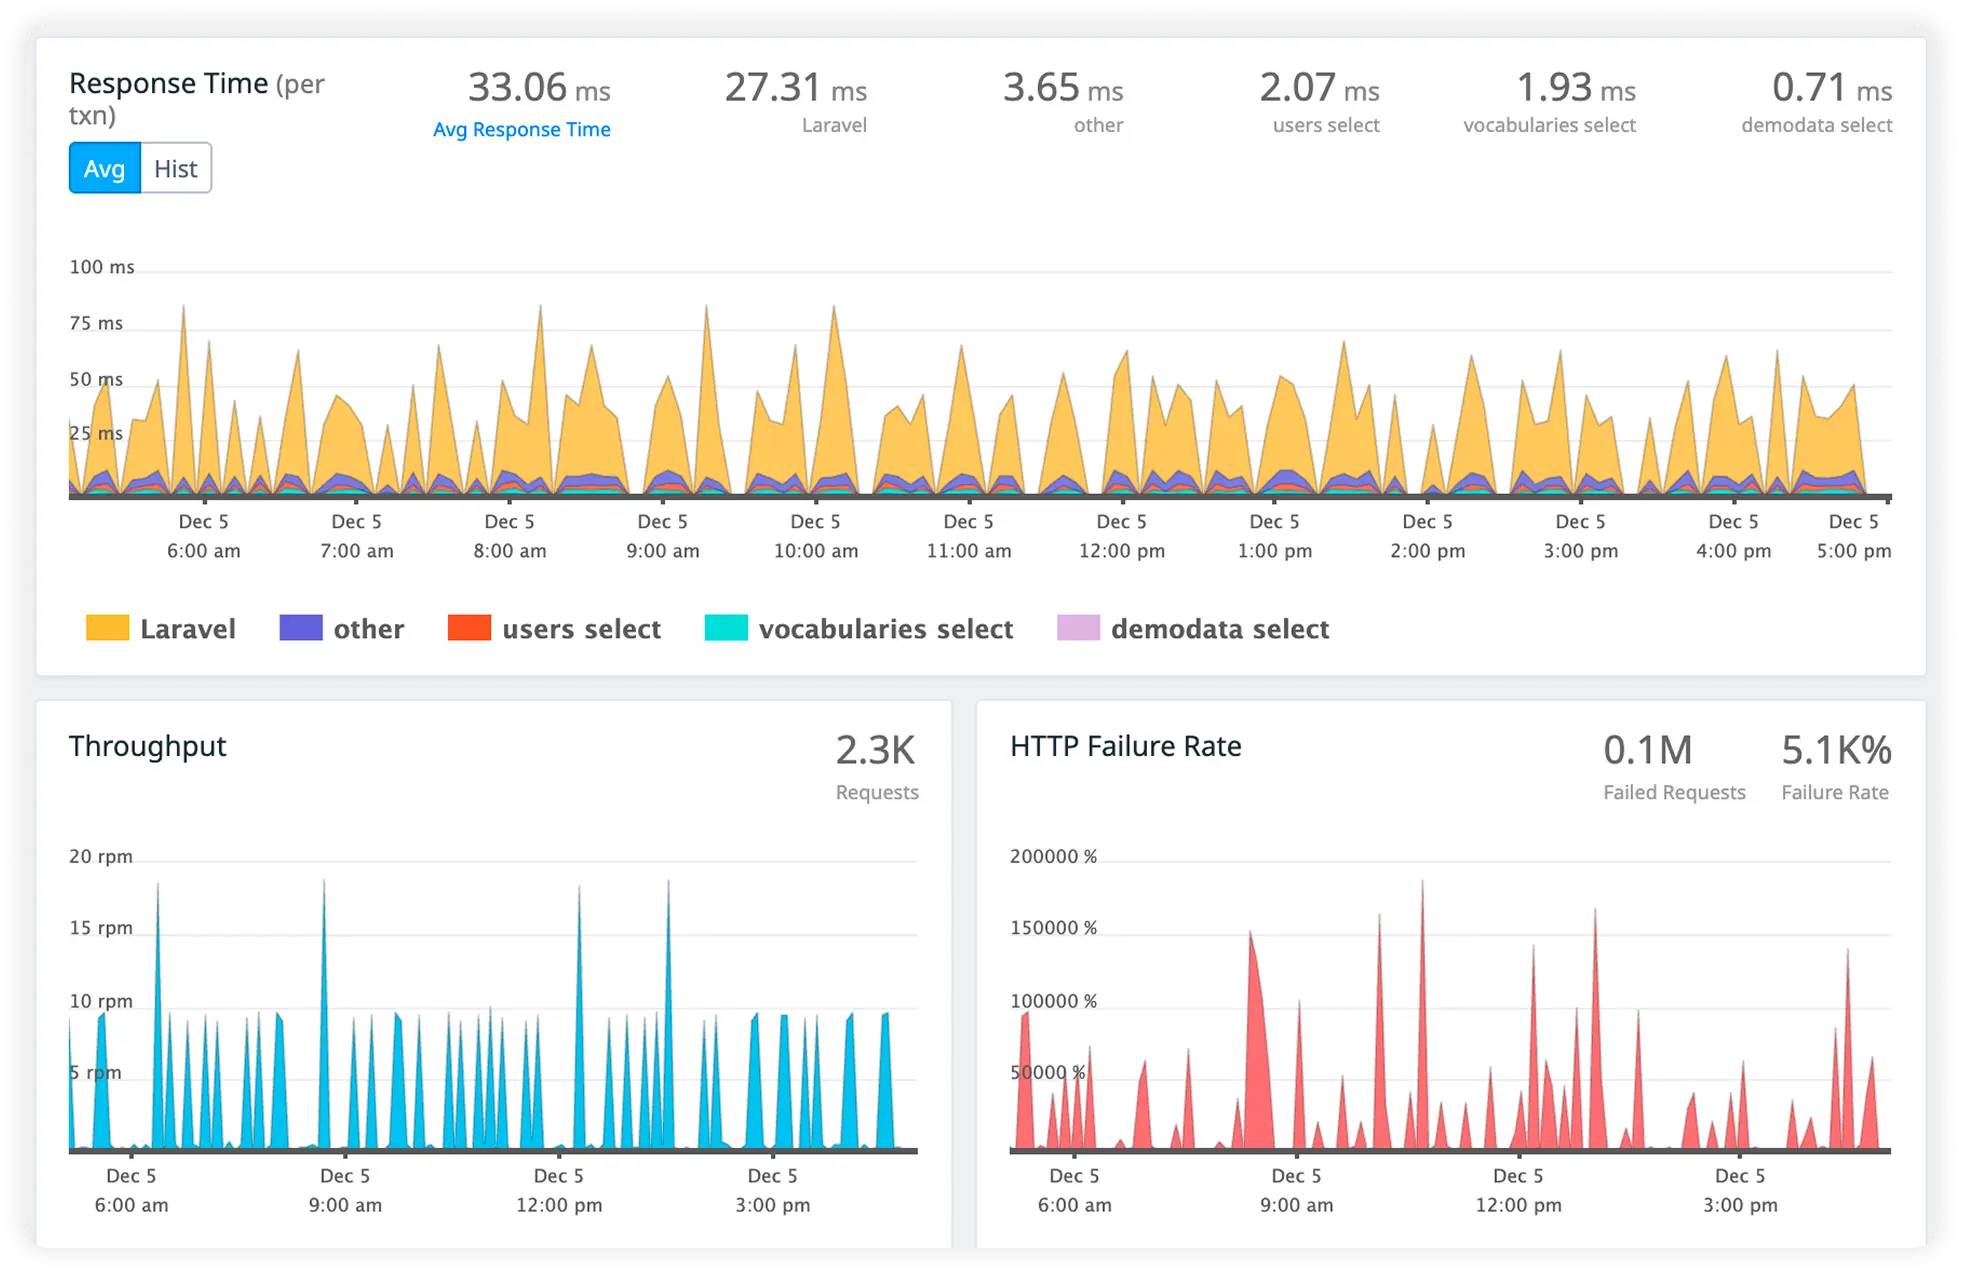
Monitor Critical Transactions
Group requests by endpoints, business flows, or operations to track latency, errors, and throughput. Keep key user journeys and SLAs on track.
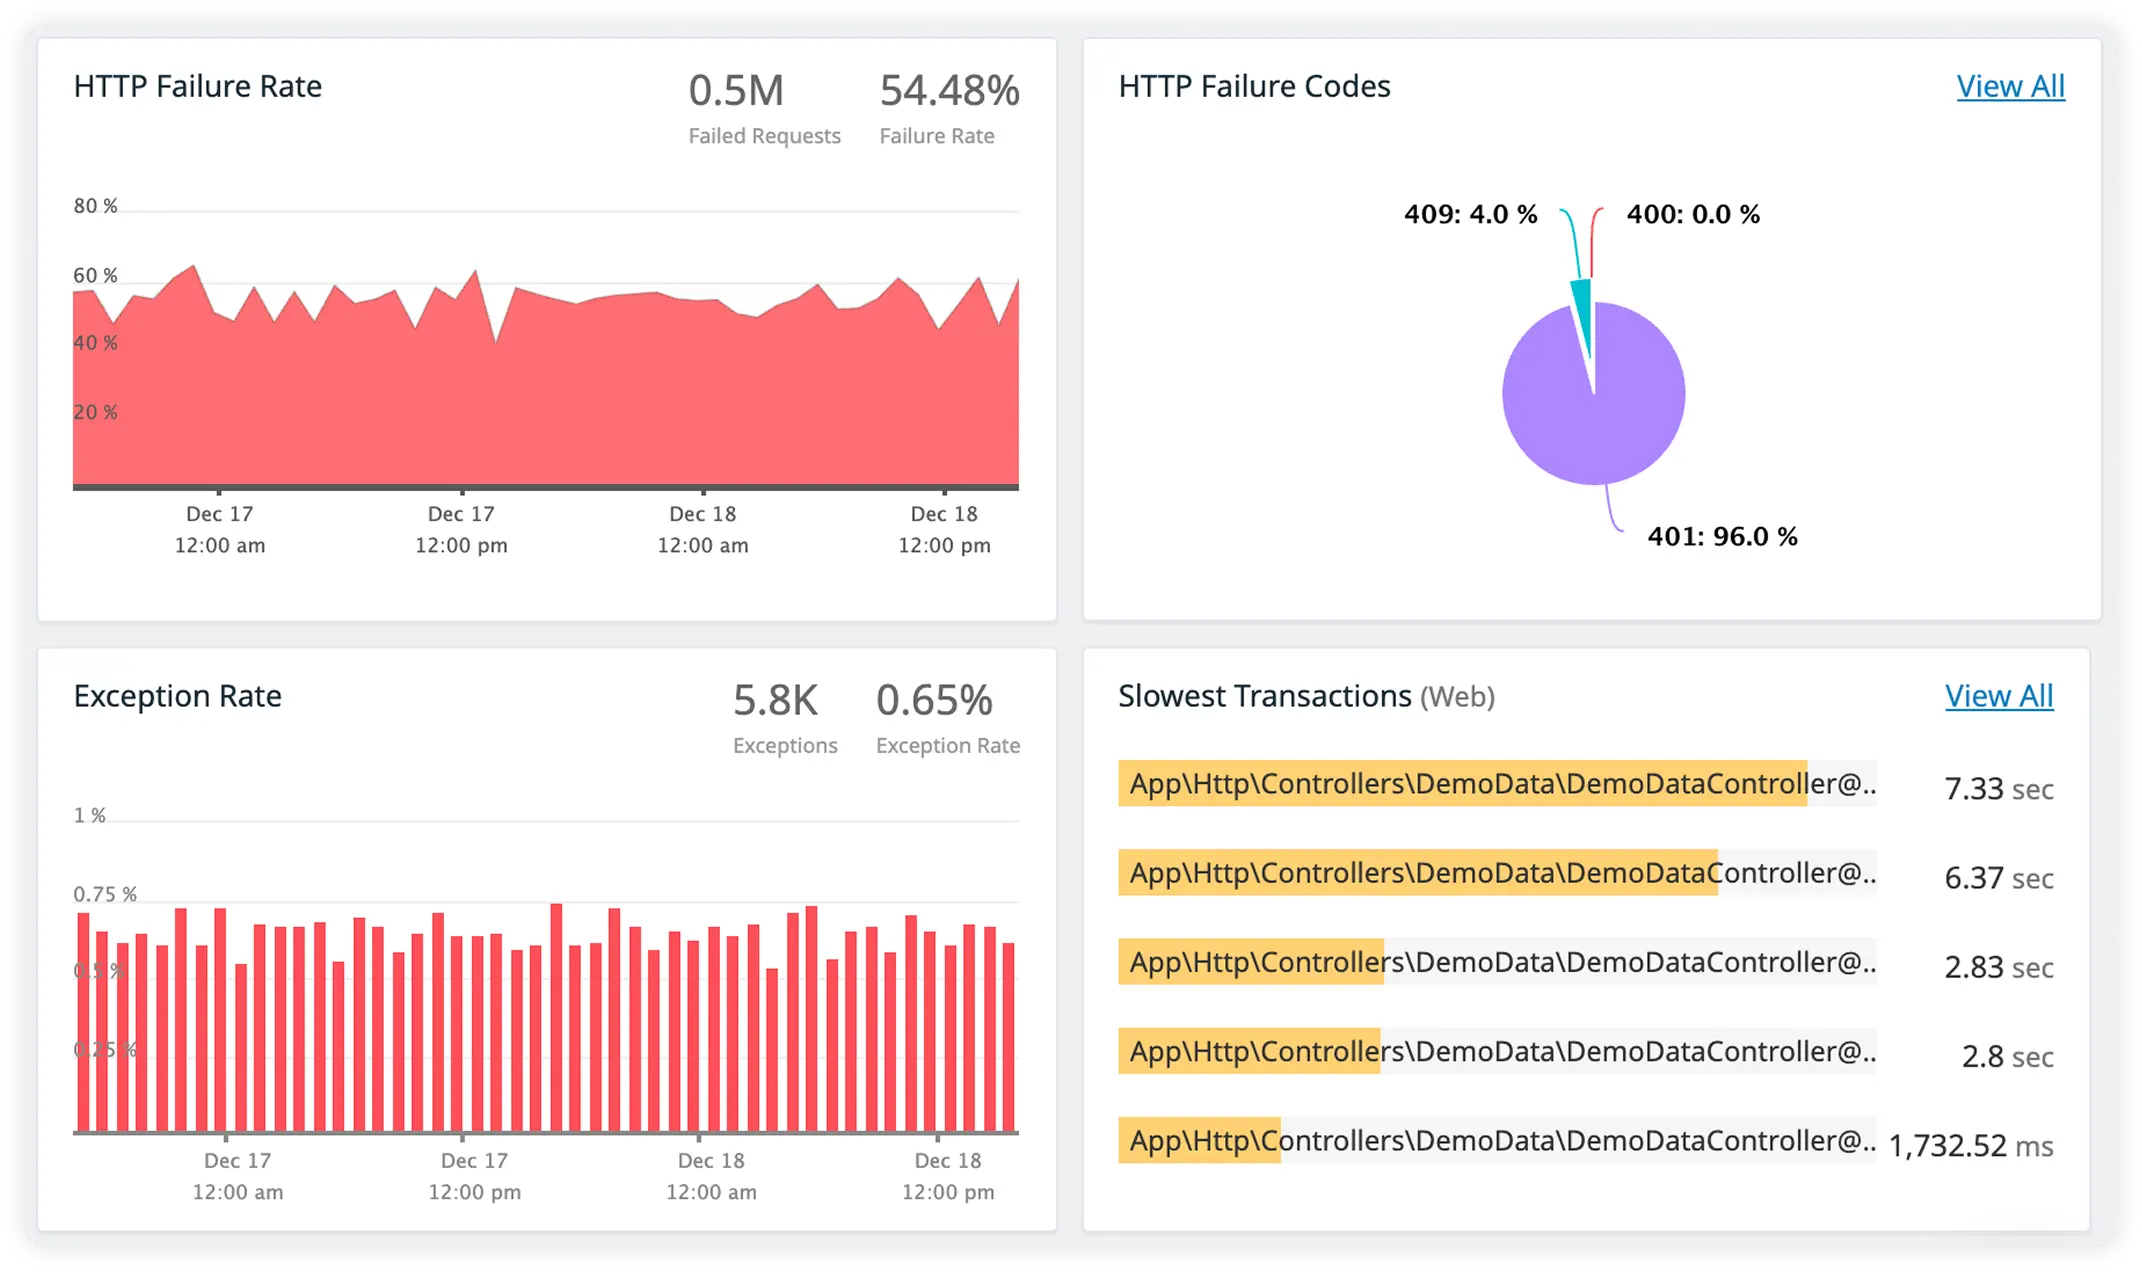
Track External Dependencies
Monitor third-party API calls, latency, and errors to spot external slowdowns and prevent wasted troubleshooting.
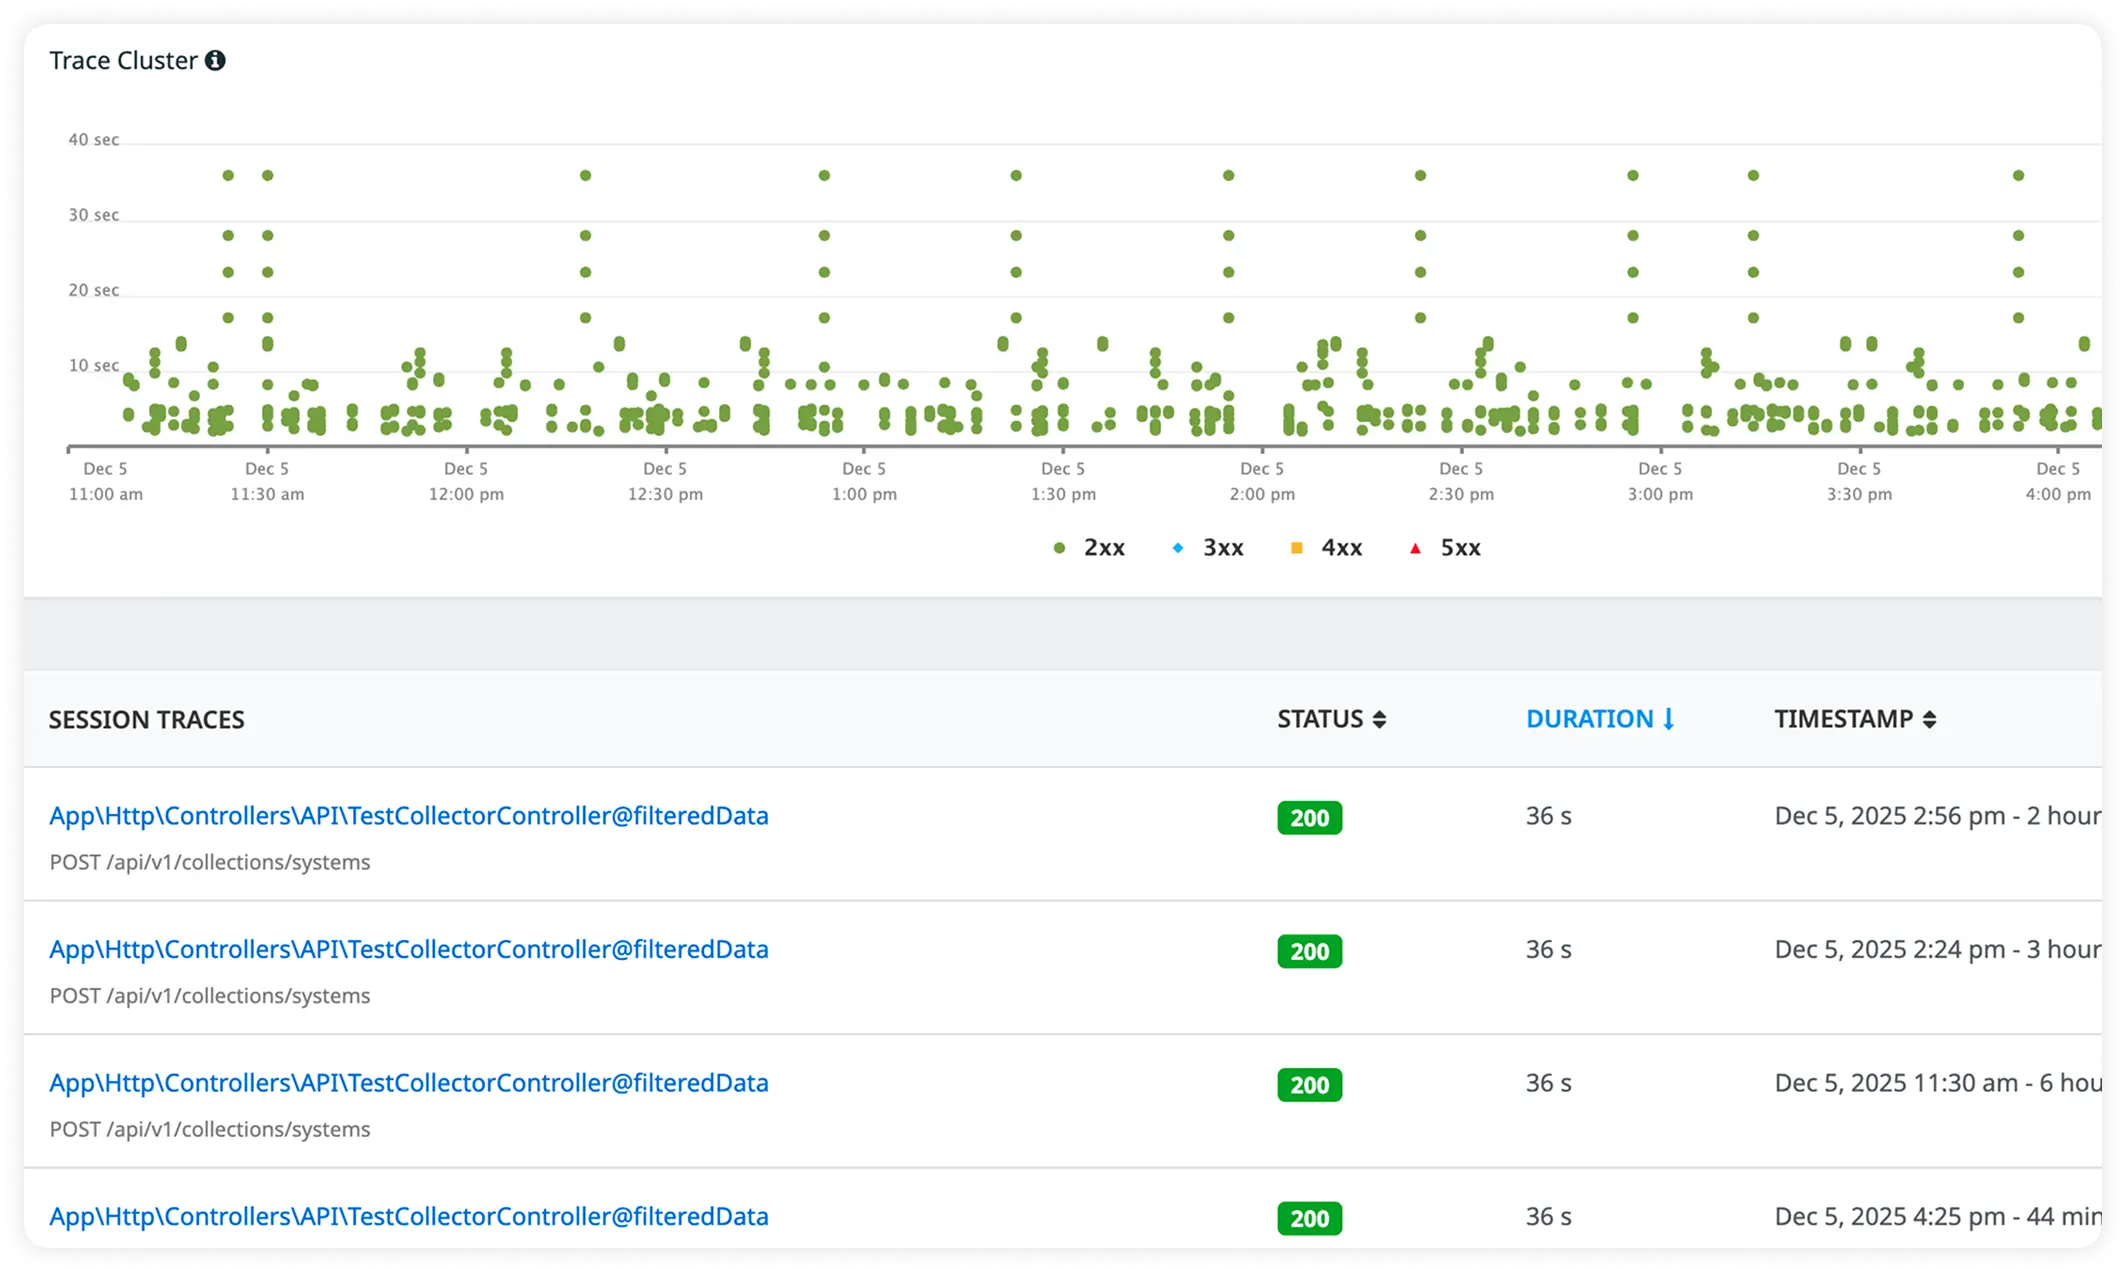
Real Business Impact
What Engineering Teams Actually Achieve?
Atatus APM doesn't just surface metrics, it changes how fast your team resolves incidents, optimizes code, and ships with confidence.
Faster MTTR - From Hours to Minutes
Stop spending hours correlating metrics, logs, and traces manually. Atatus links the slow database query, the failing dependency, and the exhausted connection pool in one view. Teams report going from 2-hour investigations to 15-minute fixes.
Lower Cost vs Datadog - Predictably
One flat per-host price covers APM, logs, RUM, and infrastructure. No per-signal billing that explodes when you add RUM or ship more logs. 40+ teams have cut observability spend by an average of 62% after switching from Datadog.
Fewer False Alerts - Catch What Matters
Baseline-aware alerting learns your traffic patterns like daily cycles, weekend dips, promotional spikes and alerts only on genuine anomalies. Teams reduce alert noise by 80% while catching 100% of critical incidents.
Time to First Live Trace
One npm install, one pip install, or one gem install. Auto-instrumentation handles the rest, no YAML topology files, no agent configuration, no manual span injection. First trace live in under five minutes, guaranteed.
Database Queries Attributed to Endpoints
Every slow query linked to the exact endpoint and transaction that triggered it. N+1 patterns identified with the specific ORM call responsible. Stop guessing which route is hammering your database, see it in the dashboard.
On-Prem Deployment - Data Never Leaves Your Infra
Datadog and New Relic are SaaS-only. Atatus supports full on-premises deployment for HIPAA, financial services, and government workloads. Complete data sovereignty with the same full-featured APM experience, no compromises.
Unified Monitoring for Your Entire Application Stack
Designed to support applications built with popular languages and frameworks, providing unified visibility across the entire application stack.












































First Live Trace in Under 5 Minutes
No YAML. No topology definitions. No manual span injection. One install gives you full auto-instrumentation for transactions, database queries, external requests, and distributed tracing.
Install the Agent
Quickly add the lightweight Atatus APM agent to your application using a simple command. No complex setup or code changes are needed, so you can start monitoring without delay.
Auto-Instrument Your App
Once installed, the agent automatically instruments your app's services and frameworks, capturing detailed performance data like latency, errors, and throughput out of the box.
Monitor, Analyze & Fix Fast
Access real-time dashboards to visualize key metrics and logs. Correlate traces, logs, and errors across your stack to quickly identify and resolve performance bottlenecks and issues.