Hidden Failures
When requests fail silently, teams learn about issues from users instead of signals. Missing context around what actually broke turns incidents into guesswork.
Get out-of-the-box visibility into critical KPIs and business performance with our Laravel monitoring tools. Analyze database transactions, debug with detailed traces, and visualize your applications and their dependencies for optimal insights and management.
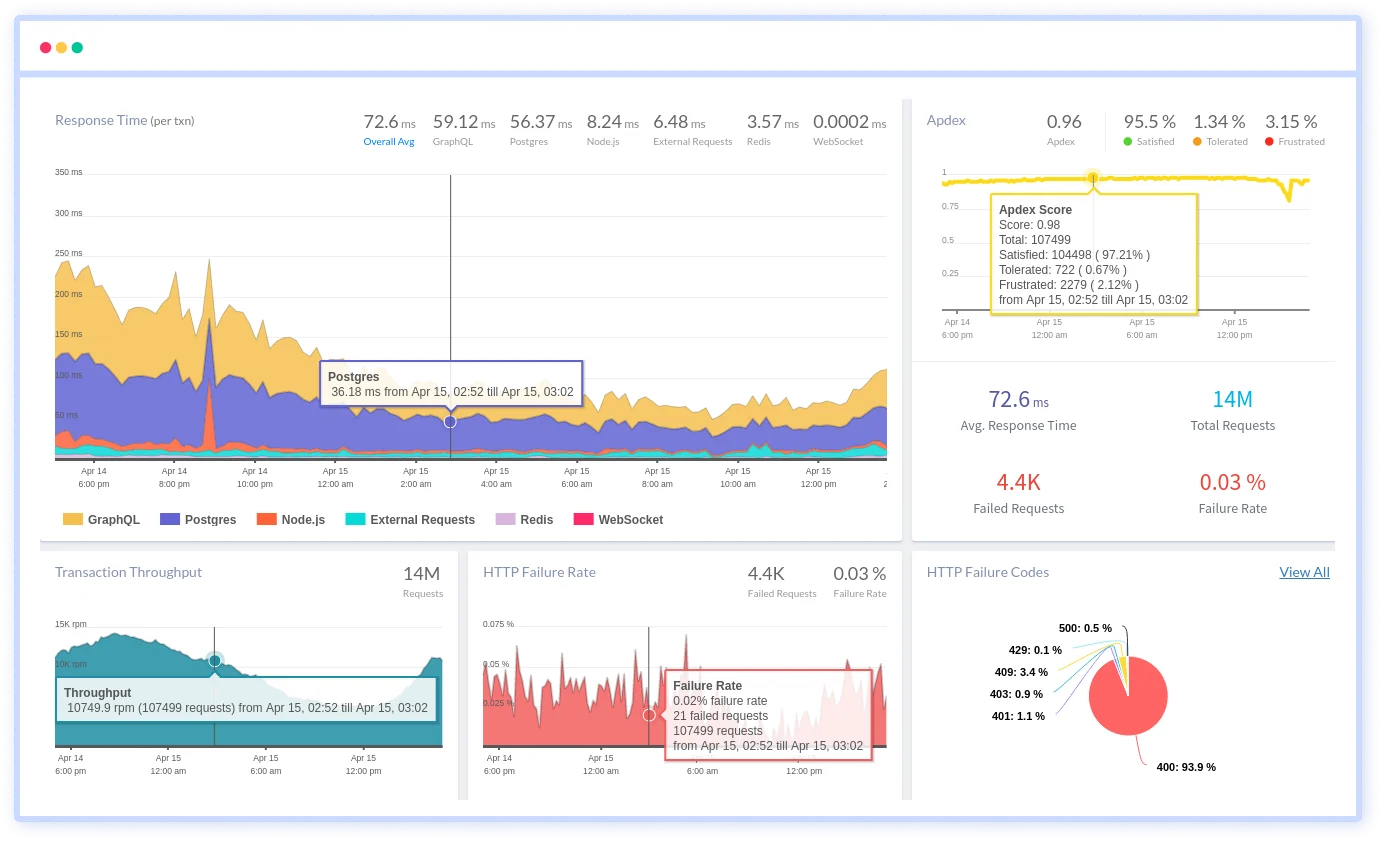
When requests fail silently, teams learn about issues from users instead of signals. Missing context around what actually broke turns incidents into guesswork.
Errors surface, but the path to the cause is fragmented across logs, traces, and tribal knowledge. Engineers lose hours reconstructing what happened.
Traffic grows, workloads spike, and bottlenecks appear without warning. Teams cannot tell whether issues come from code paths, background jobs, or infrastructure pressure.
Queues and workers fail differently than web requests. Without end-to-end visibility, delayed jobs and stuck workers remain invisible until business impact shows up.
Production behaves differently from staging. Small config or dependency changes compound, and teams lack confidence in what actually changed.
Every deploy carries risk because failures only appear after users interact. Rollbacks happen fast, but understanding why they were needed takes much longer.
Production signals exist, but they lack hierarchy and meaning. Engineers see activity without knowing which changes actually explain user impact or failures.
Backend, platform, and SRE teams see different symptoms of the same issue. Without shared context, incident response slows down.
Purpose-built observability for Laravel that helps teams understand application behavior, resolve issues faster, and keep production systems running smoothly.
Break down performance at the route level to identify slow endpoints, heavy traffic paths, and error-prone controllers. Get instant clarity on what's impacting response times across your application.
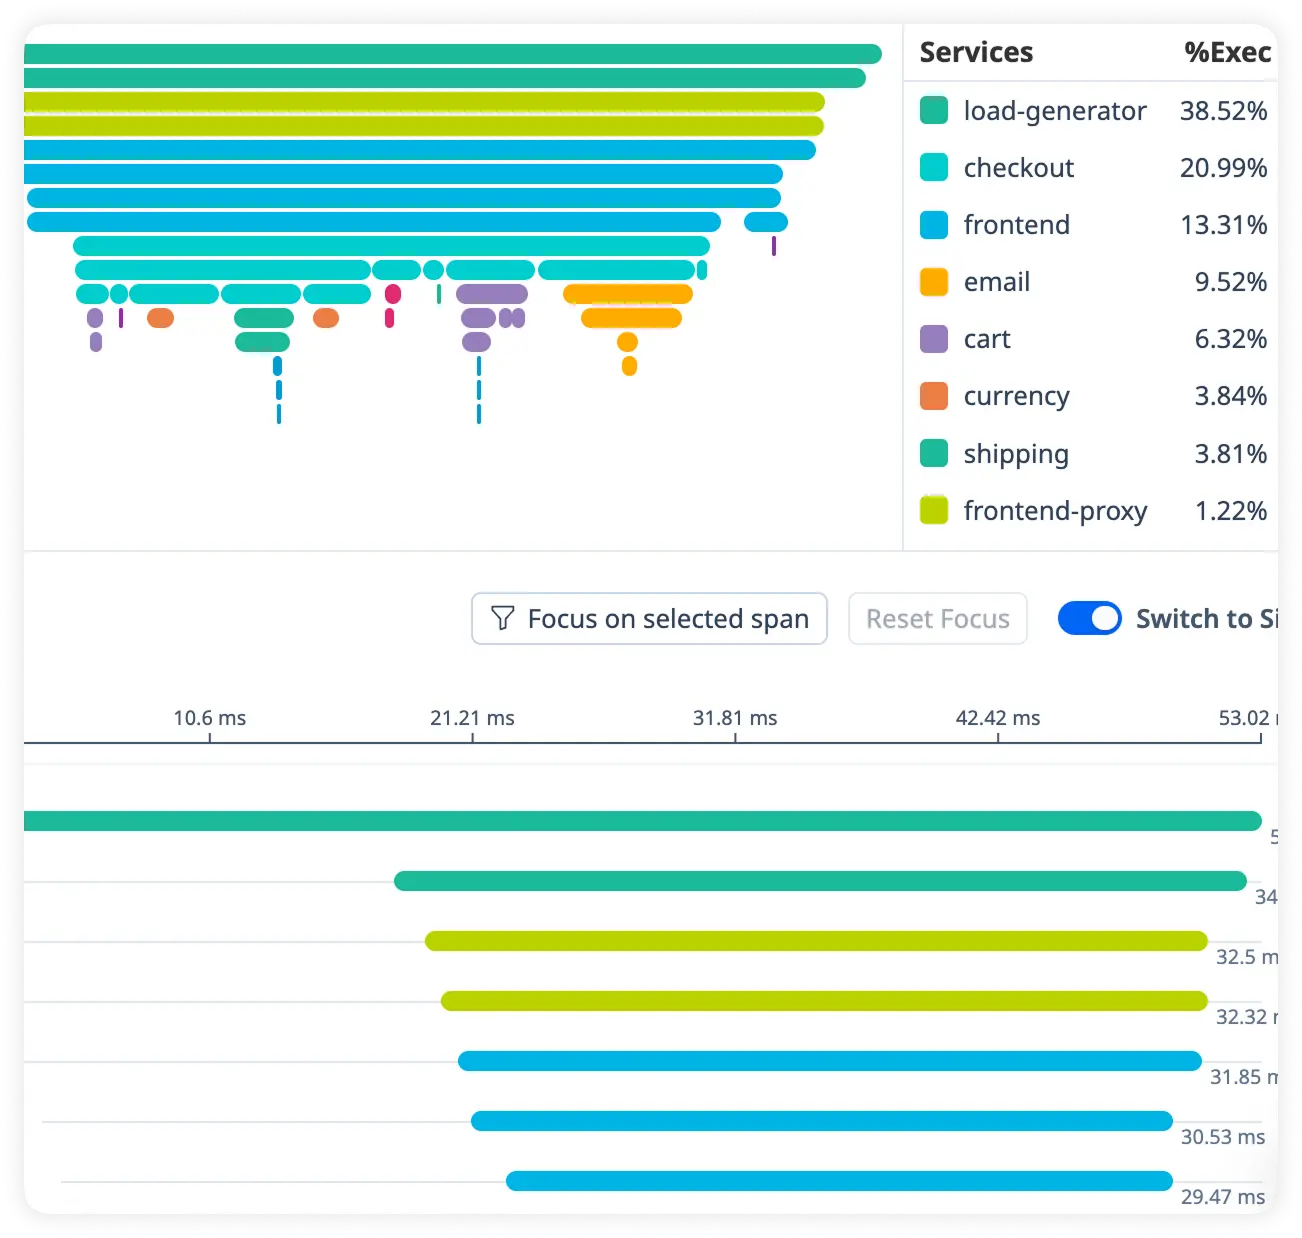
Track background job processing and queue wait times to uncover bottlenecks in critical workflows. Ensure emails, payments, and async tasks run without hidden slowdowns.
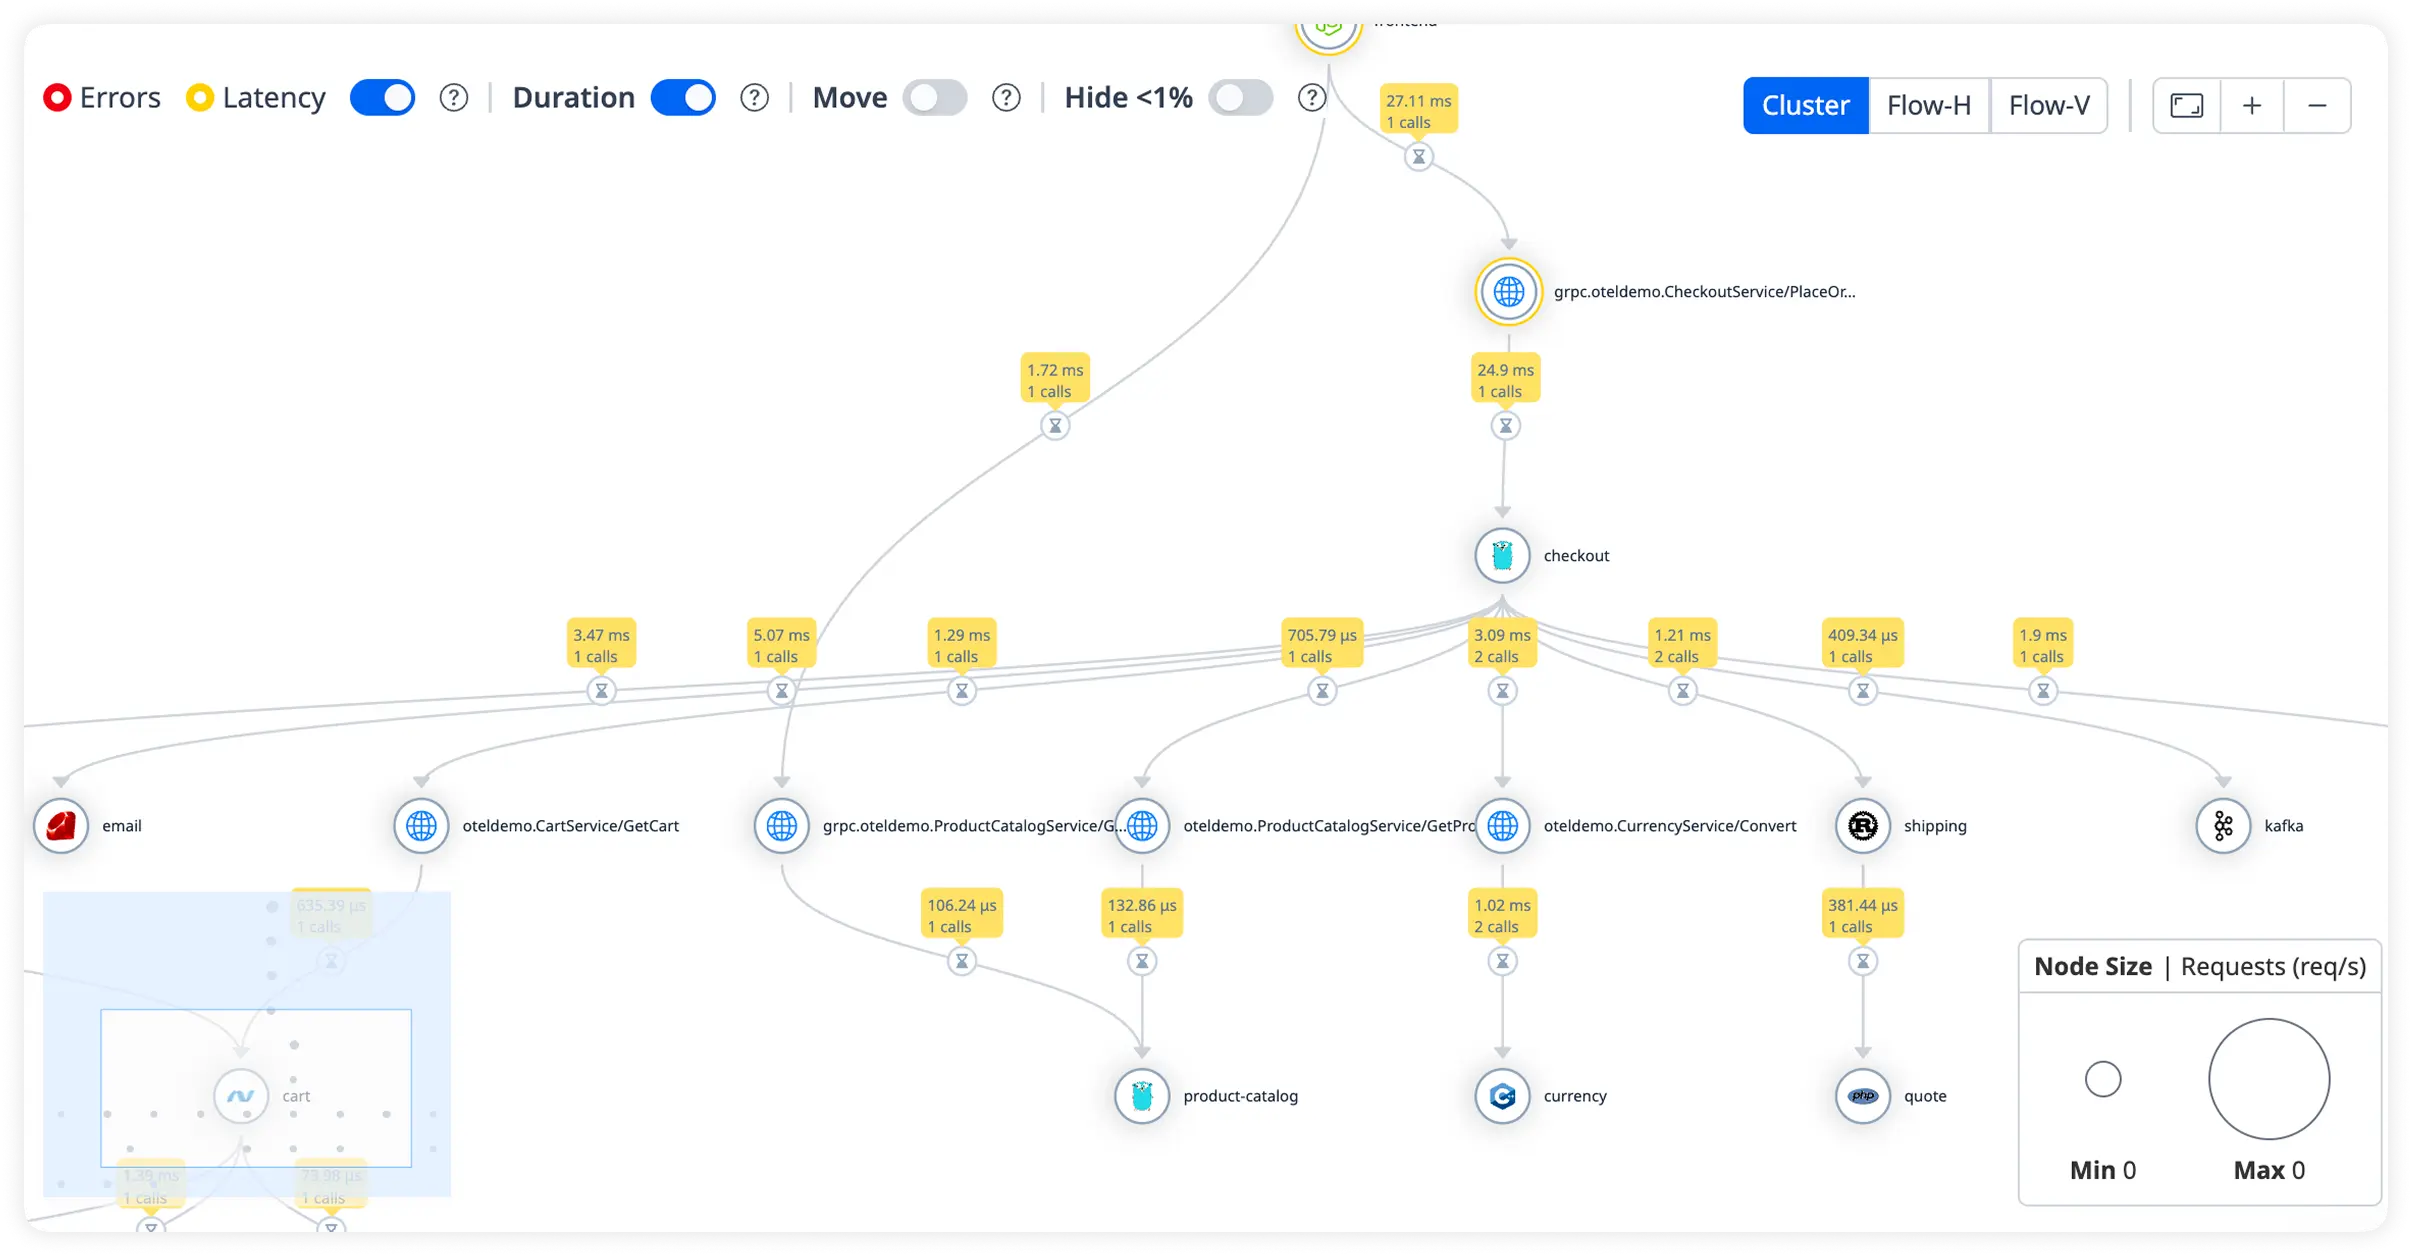
Monitor slow queries, query volume, and database load across your Laravel environment. Quickly eliminate inefficiencies that degrade application speed.
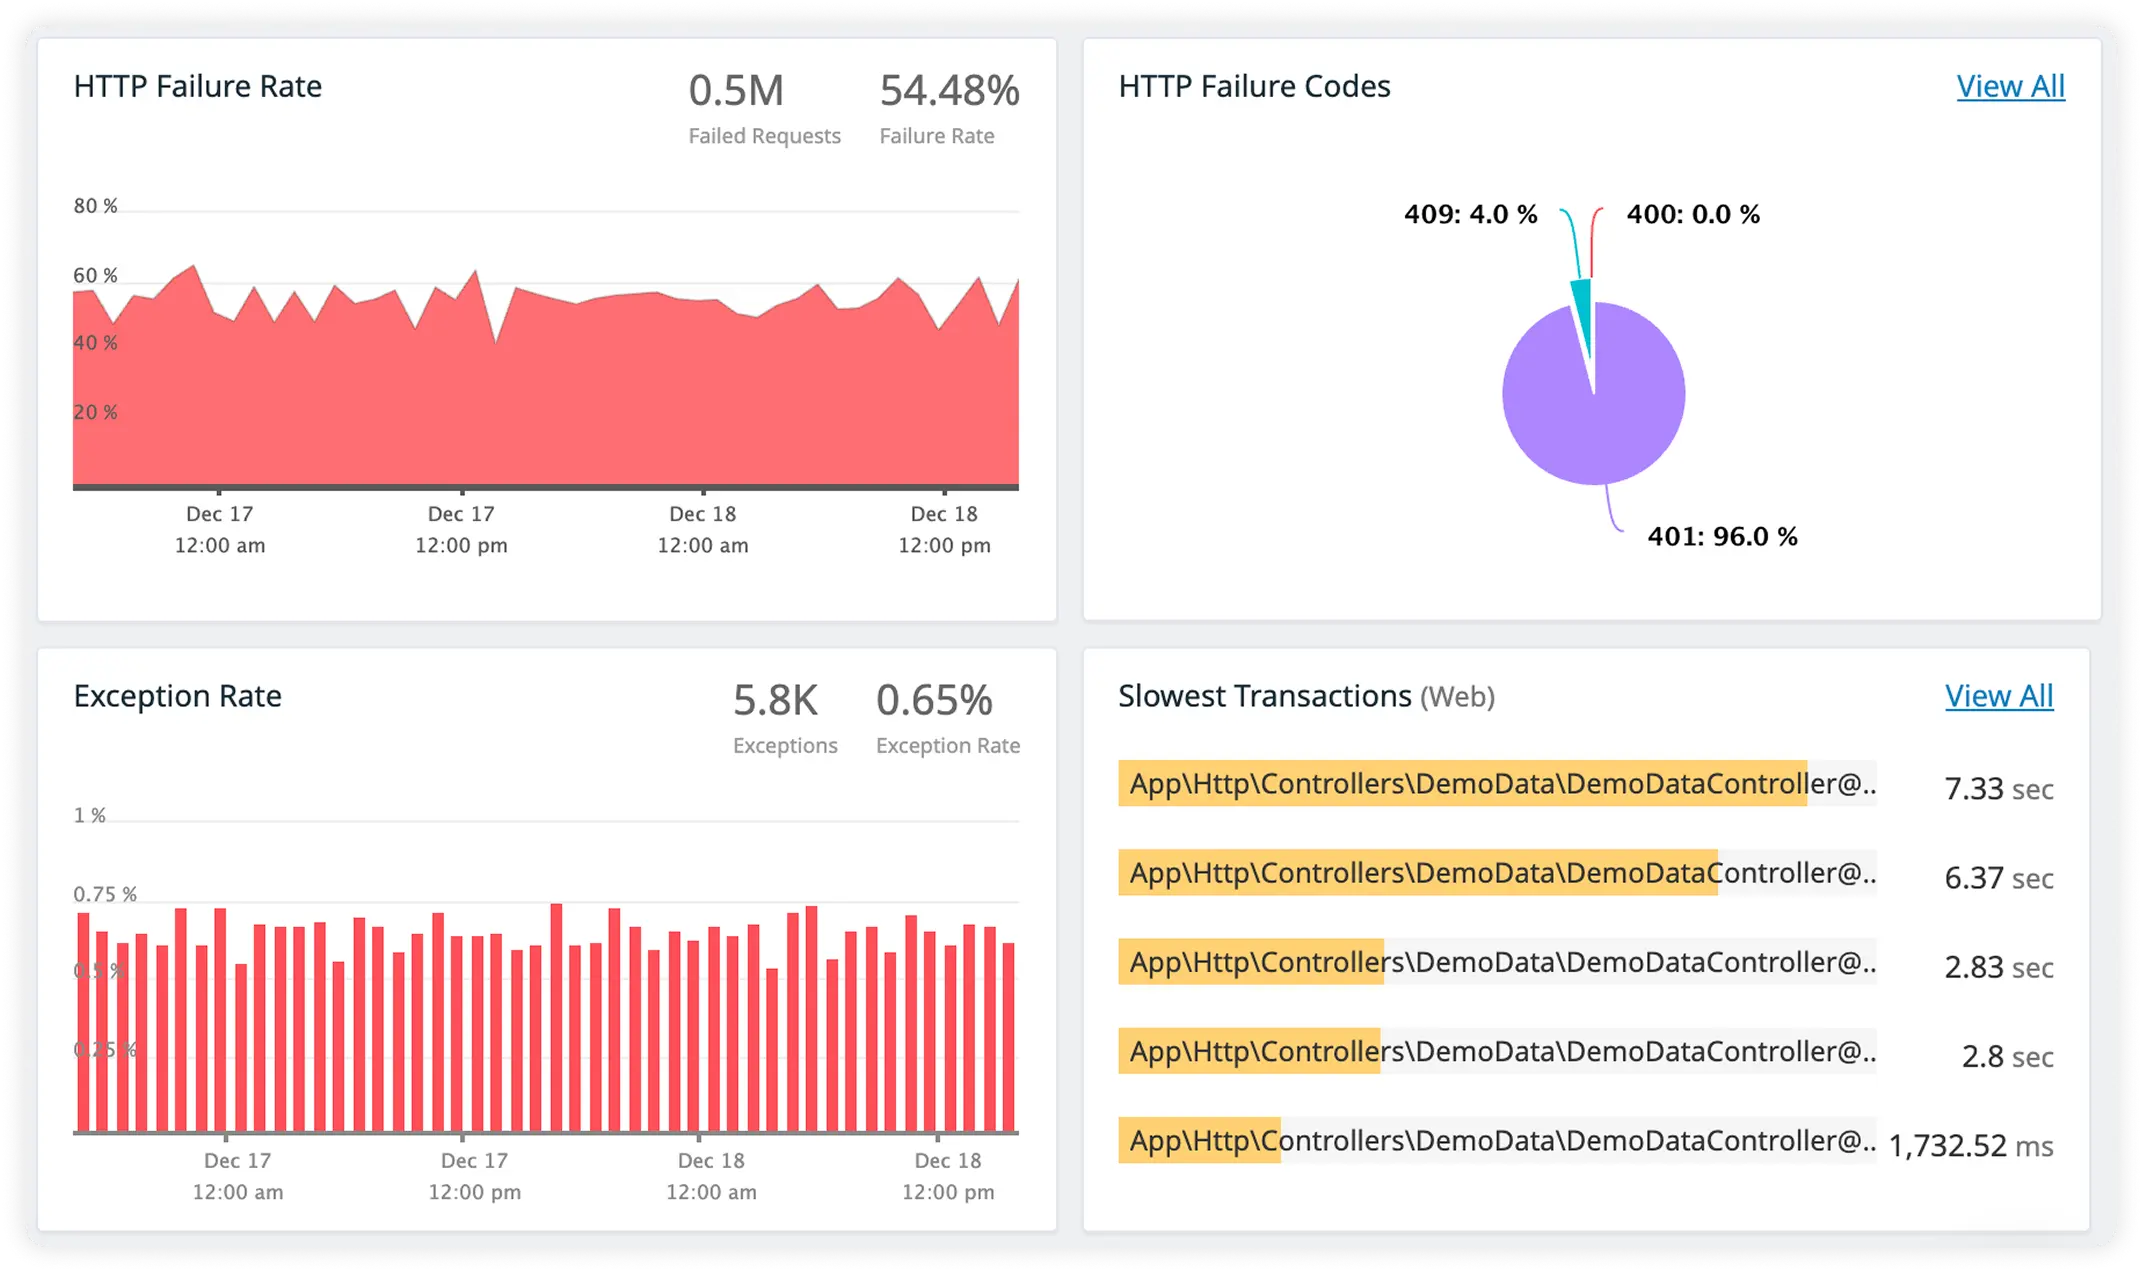
View full Laravel stack traces alongside third-party service performance in one place. Pinpoint root causes while tracking how external dependencies impact request latency.
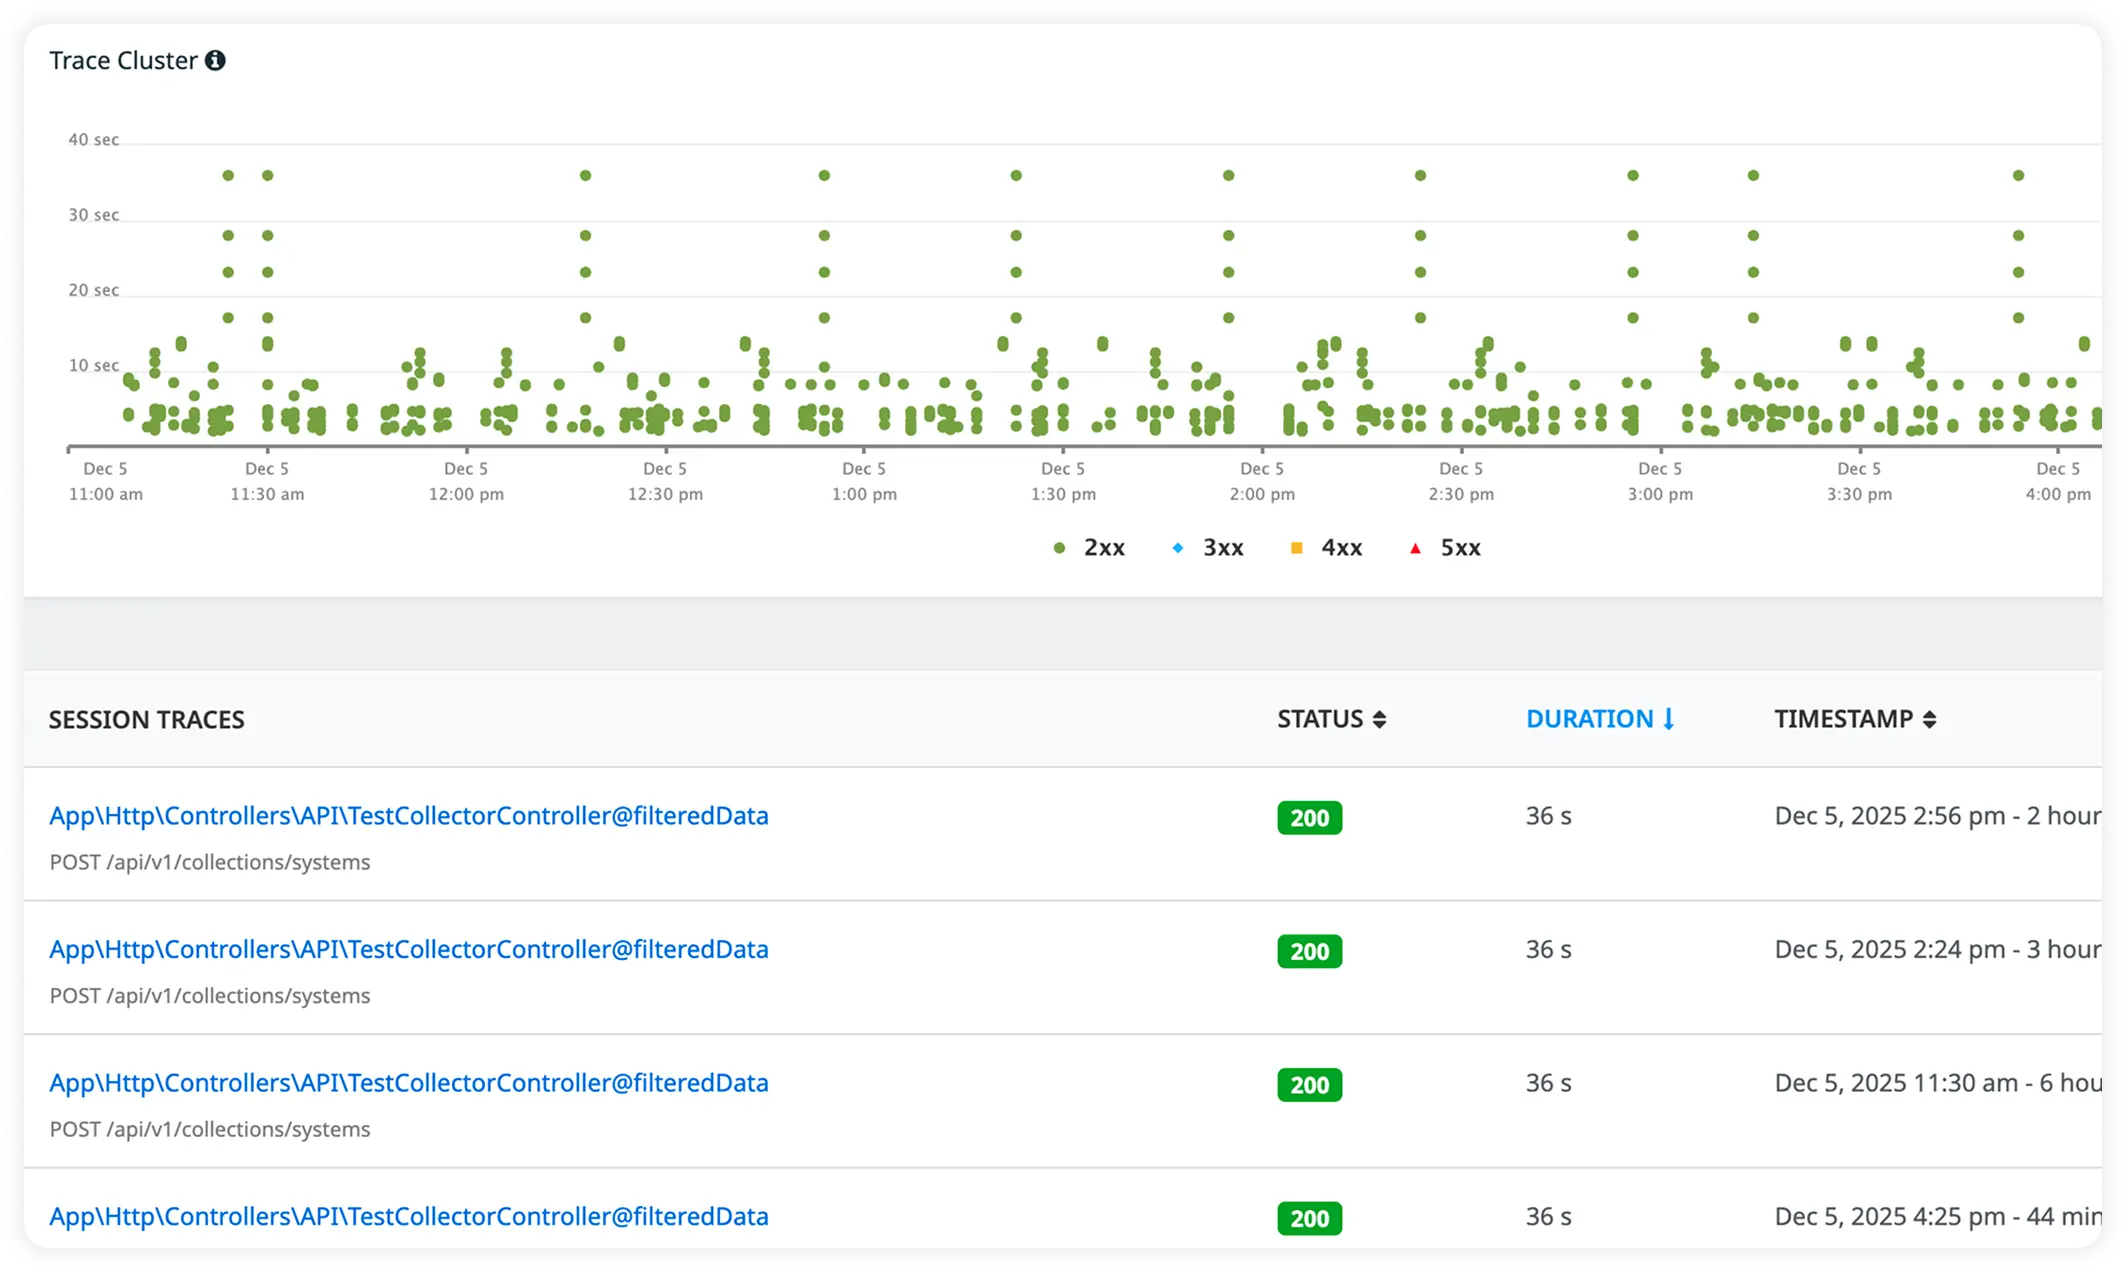
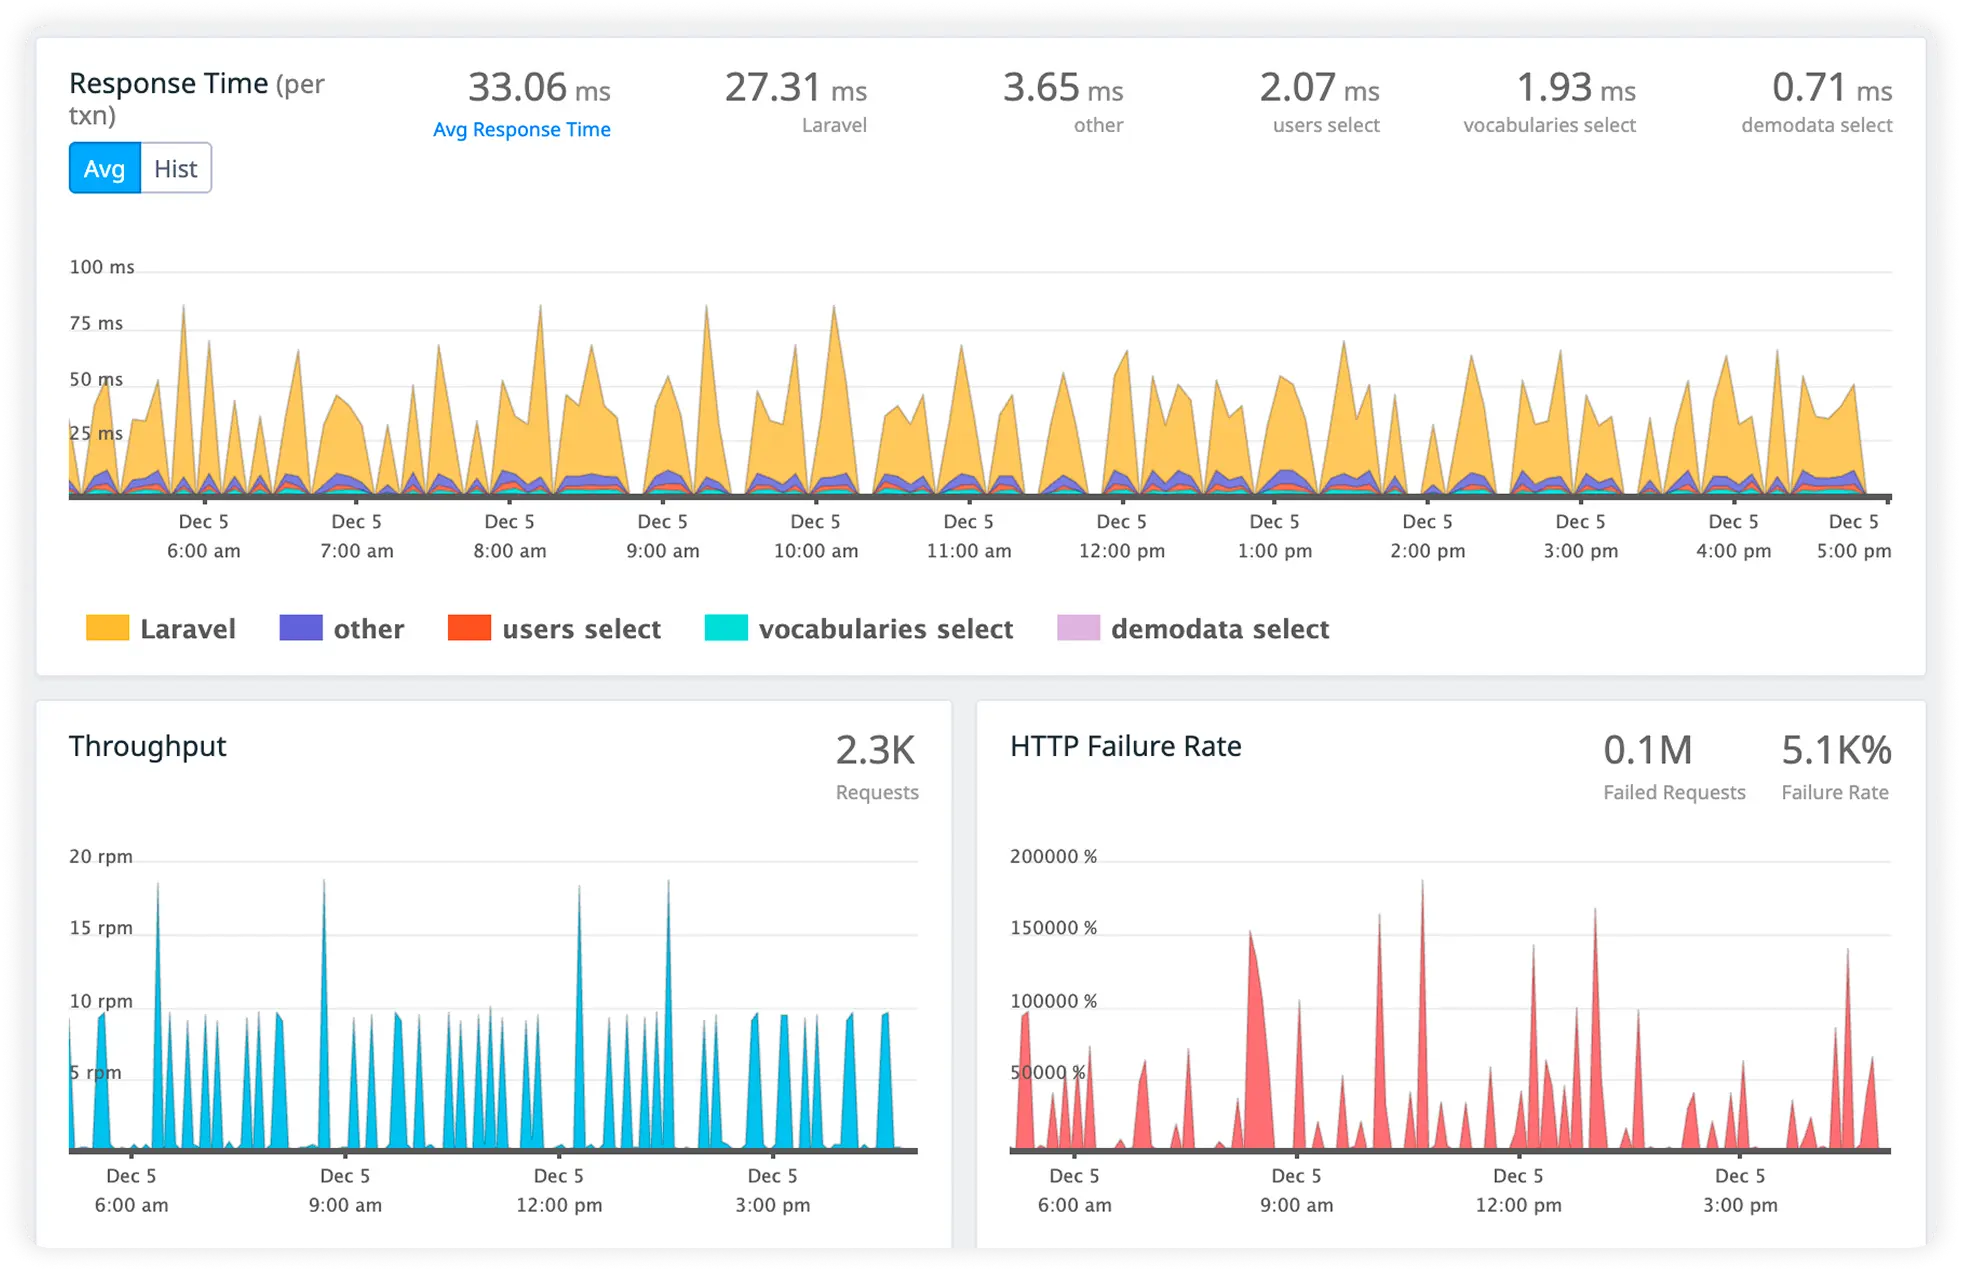
Engineering teams choose Atatus when they want fewer assumptions in production and more confidence in how their Laravel systems behave under real load.
Teams trust what they see because data reflects real execution, not approximations or sampled fragments.
Engineers can start trusting production signals without weeks of onboarding or internal evangelism.
Engineers start using it immediately without process changes or long onboarding cycles.
Platform, SRE, and backend teams operate from the same source of truth during incidents.
Deployments feel safer because teams understand how systems react to change in real time.
Minimal operational overhead keeps focus on shipping and stability instead of tool management.
Developers rely on the data because it matches what they see in code and production behavior.
Teams stay prepared for failure modes they have not explicitly seen before.
Engineering leaders make calls based on observed system behavior, not assumptions or anecdotes.
Atatus adapts to how engineering teams work across development, operations, and reliability.
Debug errors and slow paths with the full context of what happened.
Atatus for developersTrack deployments and see how each release affects stability.
Atatus for DevOpsWatch latency and error rates to ship with less production risk.
Atatus for release engineersPricing, deployment, data and the agent. If something is missing, a person will answer it on a demo call.
To effectively measure Laravel performance, utilize Laravel-specific performance monitoring tools such as Laravel APM. These tools provide insights into key metrics including:
Atatus offers comprehensive Laravel APM capabilities, providing real-time visibility into these metrics to help you identify and resolve performance bottlenecks efficiently.
Improving Laravel performance involves:
Yes, Atatus integrates seamlessly with Laravel and other popular PHP frameworks such as Symfony, CodeIgniter, and more. It automatically instruments and monitors specific Laravel components and libraries, providing comprehensive insights into application performance.
Key metrics for effective Laravel performance monitoring include:
Laravel APM offers several advantages:
Optimizing PHP memory usage involves:


