1. Home
  2. Solutions
  3. Digital media
Solutions

Deliver Buffer-Free Streaming and Instant Content Loads

Buffering videos and slow page loads drive viewers to competitors. Monitor CDN performance, track video playback quality, and optimize content delivery to keep audiences engaged from first click to final frame.

OpenTelemetry nativeSaaS, on-prem, hybrid or BYOCNo per-user pricing
The problem

Common Challenges You Face

Real problems experienced by teams like yours every day

Video Buffering Frustrates Users

“Users abandon videos due to buffering, but we can't identify if it's CDN issues, encoding problems, or bandwidth limitations.”

Slow Content Delivery

“Images and media assets load slowly across different regions, impacting user experience and engagement metrics.”

Upload Failures Go Unnoticed

“Content creators experience upload failures that we only discover through support tickets, not monitoring.”

Engagement Drops Unexpectedly

“Watch time and engagement suddenly drop, but we don't know if it's content quality, technical issues, or recommendation algorithm problems.”
Deliver Uninterrupted Streaming Experiences at Scale

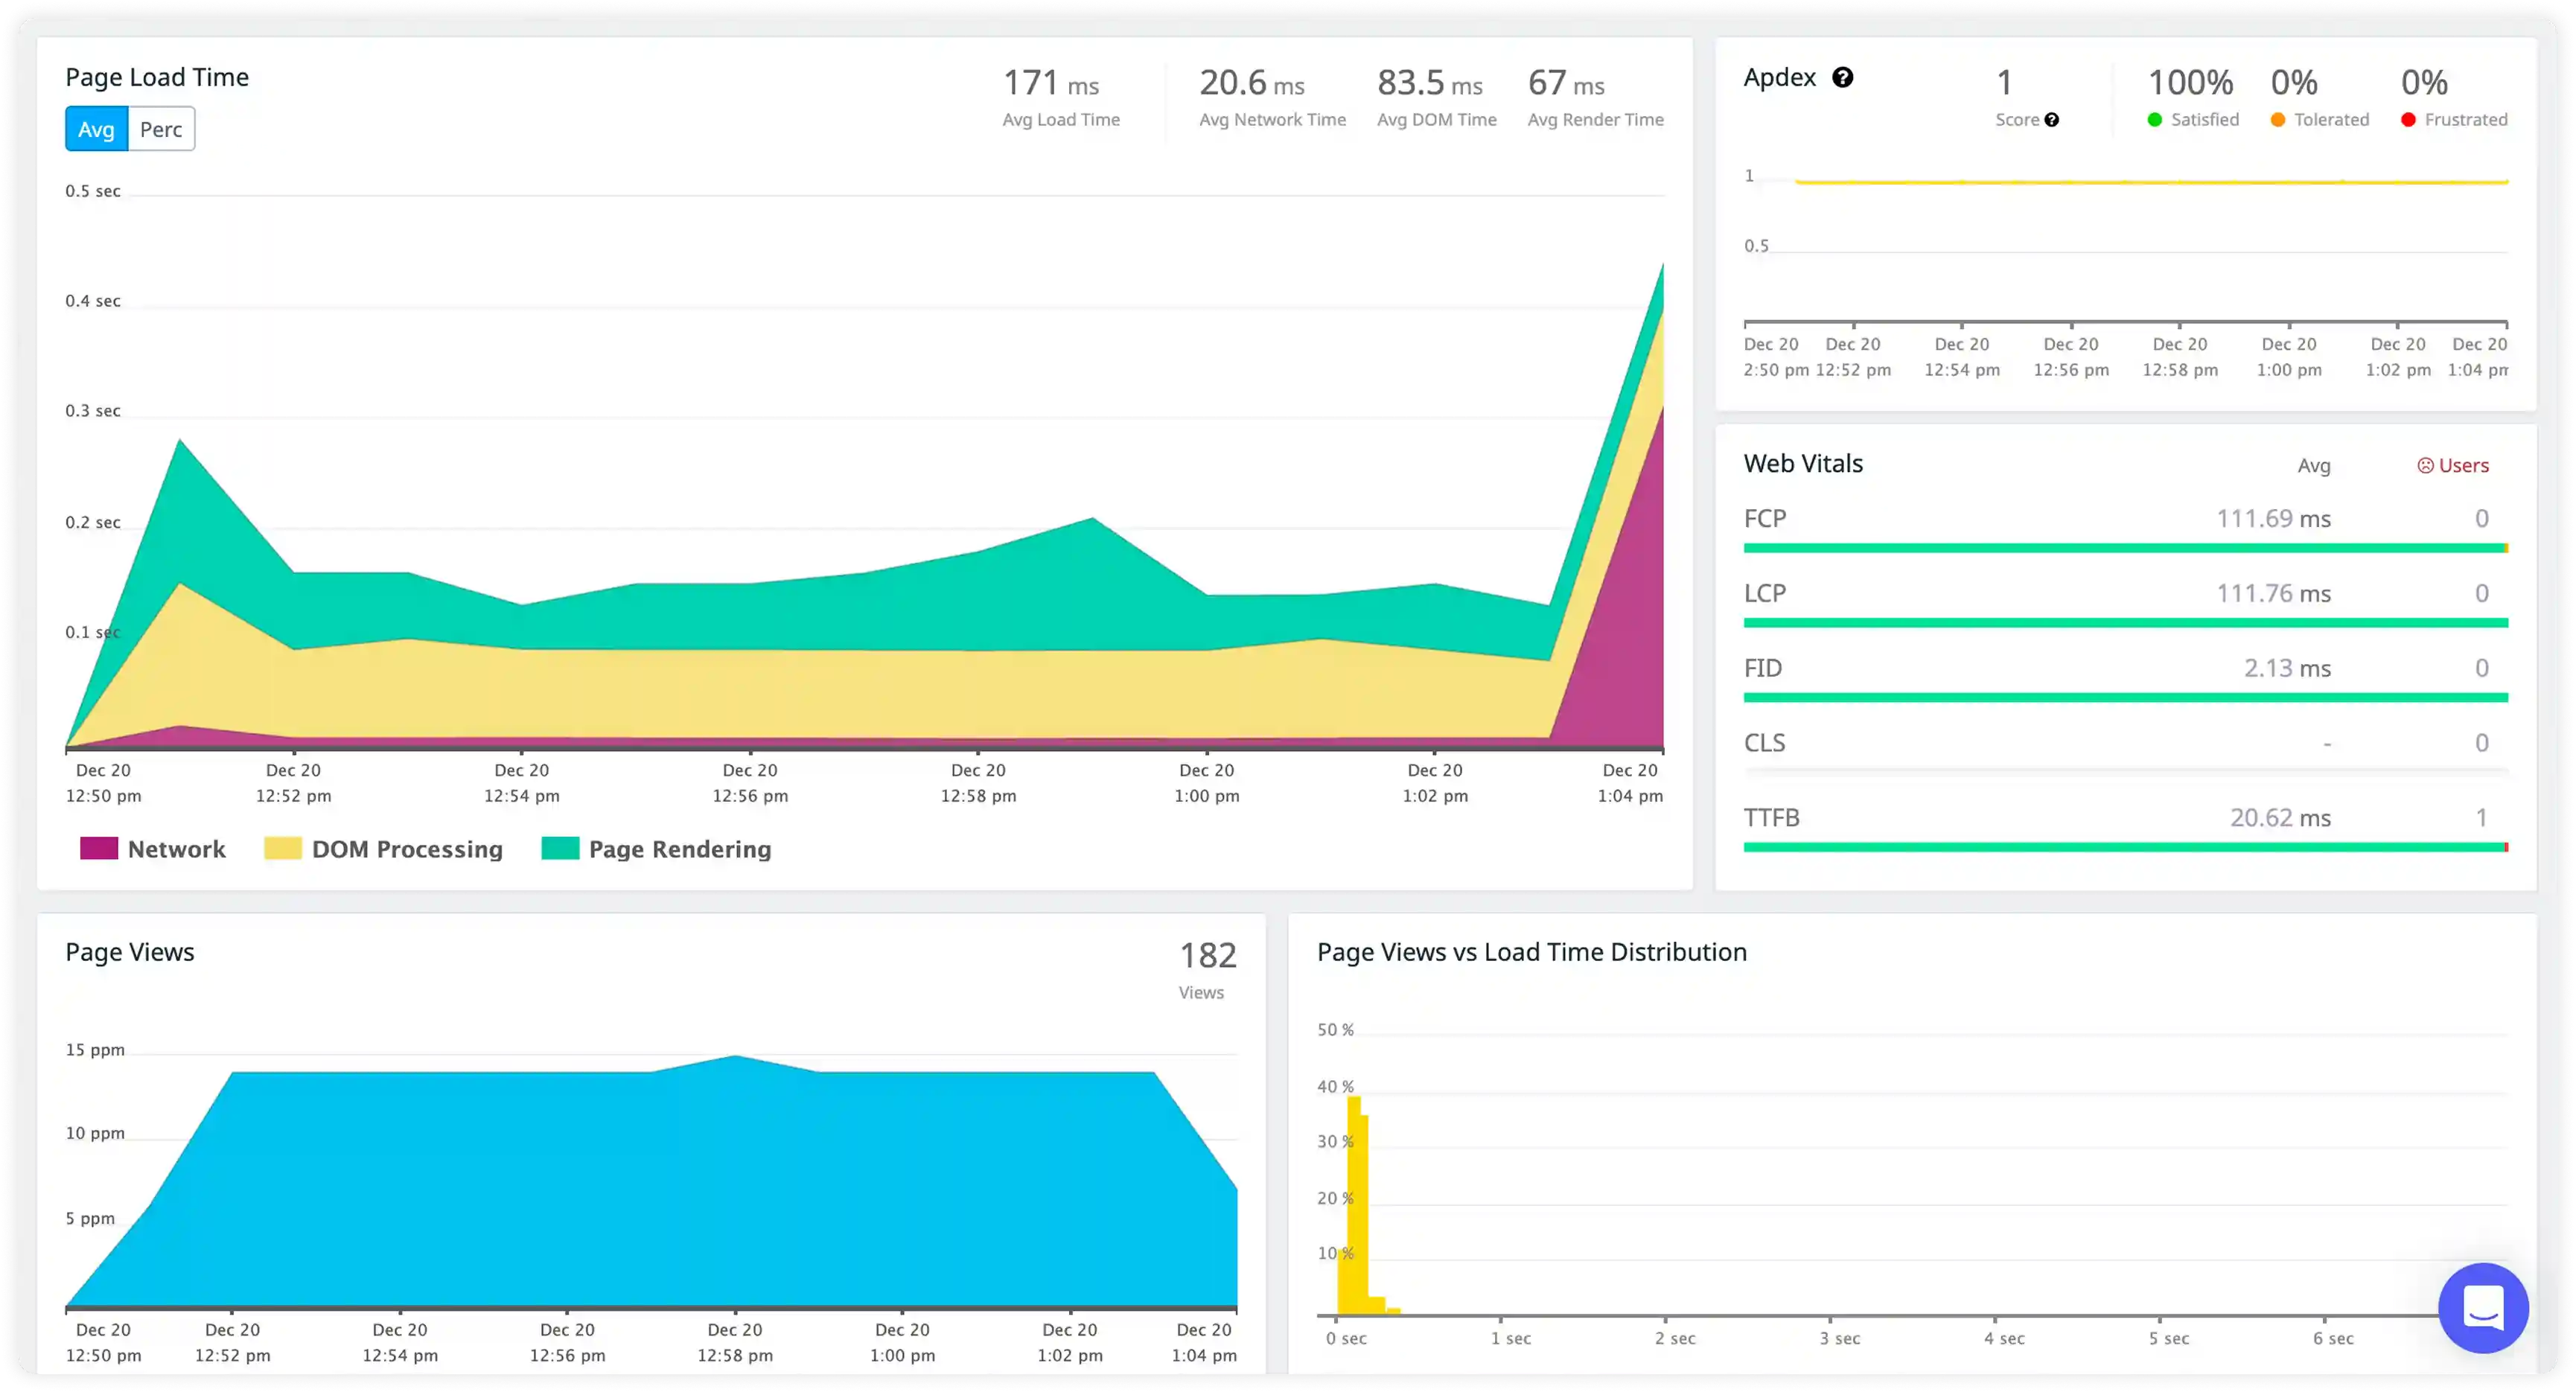
  • Real User Monitoring tracks actual user sessions to measure page load times, errors, and performance across all devices and geographic locations where viewers access your content.
  • Error Tracking captures JavaScript errors in real-time so you know when video players crash, media fails to load, or playback buttons stop responding for specific browsers or devices.
  • Infrastructure Monitoring shows server health and resource usage to track CPU, memory, and network performance when concurrent viewers spike during live events or new releases.
  • External Services Dashboard monitors CDN performance to identify when content delivery networks cause buffering or slow video startup times.
Deliver Uninterrupted Streaming Experiences at Scale

Optimize Live Event Broadcasting Without Downtime

  • APM monitors database and API performance to track response times when millions of users stream simultaneously during live sports, concerts, or breaking news.
  • Distributed Tracing follows video requests from player to backend to identify latency in your content delivery pipeline and pinpoint bottlenecks in the streaming workflow.
  • Infrastructure alerts notify teams of capacity issues with threshold monitoring that triggers when concurrent streams or server resources approach limits.
  • Deployment Tracking correlates releases with performance changes so you know if new player features, encoding updates, or backend changes caused quality degradation.
Optimize Live Event Broadcasting Without Downtime

Improve Video Player Performance Across Platforms

  • RUM segments performance by device type and browser to compare streaming quality on web browsers, and gaming consoles.
  • Resource Timing identifies slow-loading player assets to find which JavaScript libraries, video codecs, or player components delay time to first frame.
  • Session Replay shows the exact viewer experience so you can watch what happened before users abandoned the stream or encountered errors.
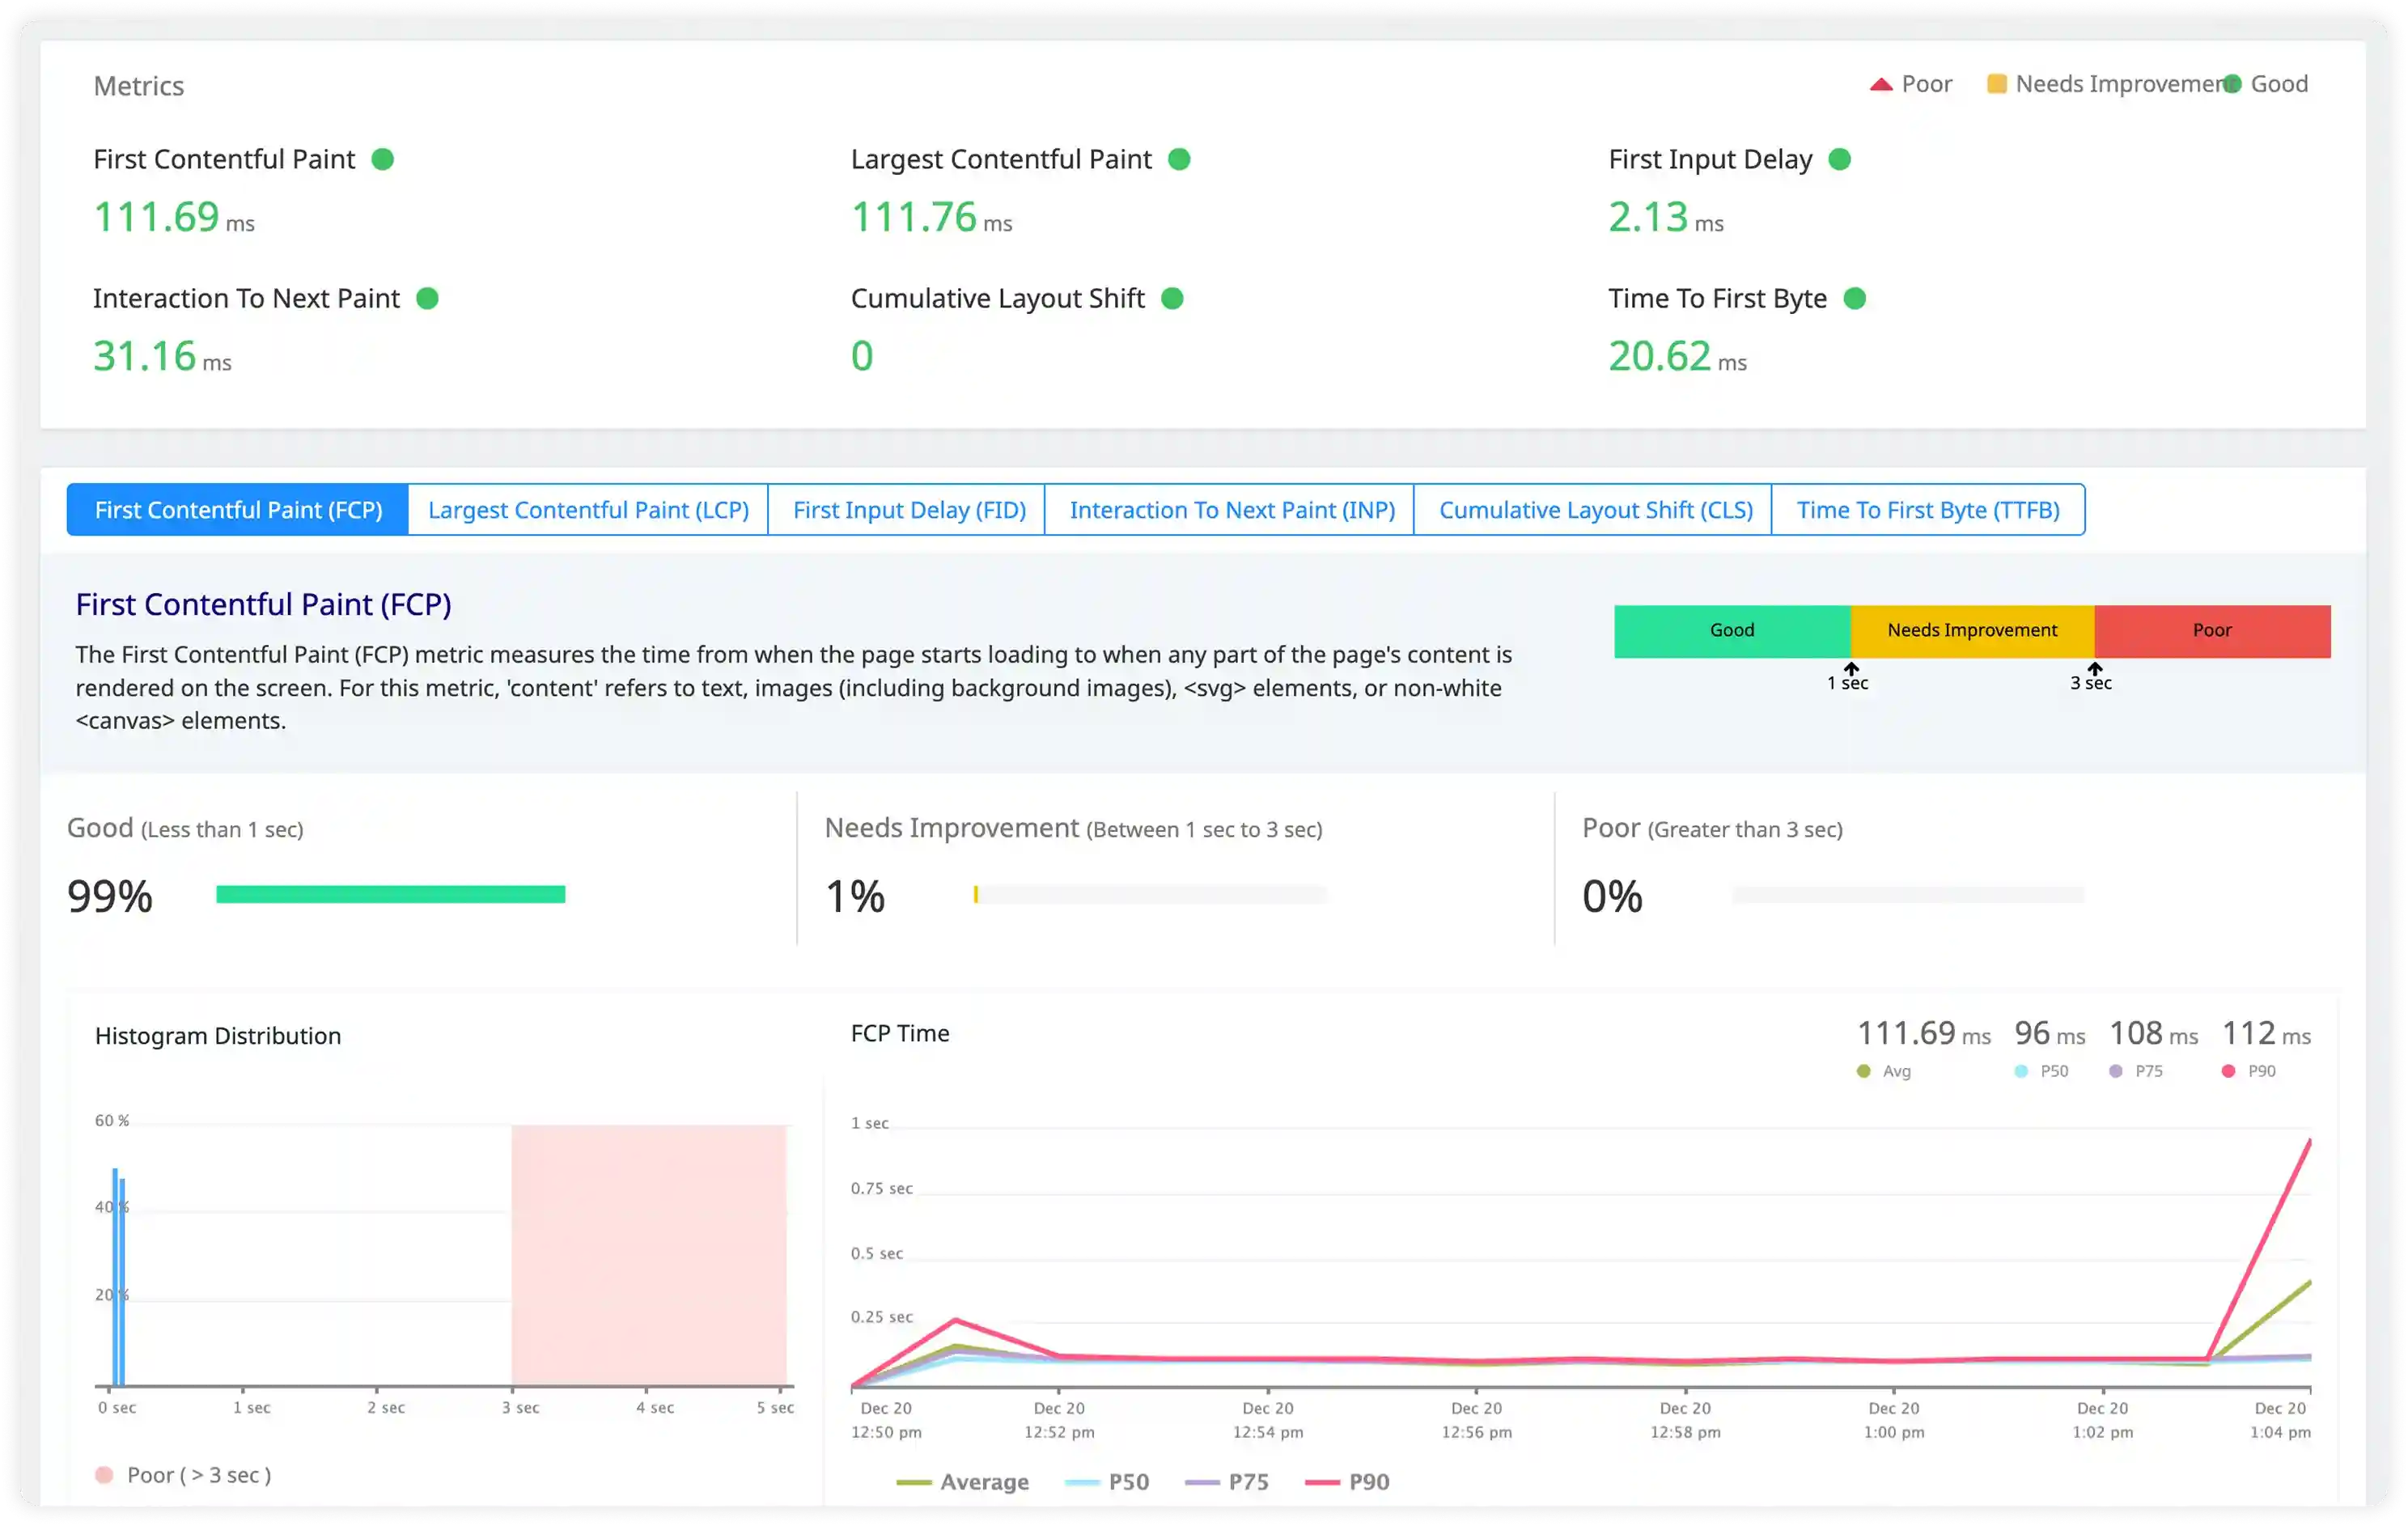
  • Core Web Vitals monitoring tracks LCP, FID, and CLS to ensure fast page loads and smooth interactions that keep viewers engaged with your content.
Improve Video Player Performance Across Platforms

Monitor Content Delivery and Backend Services

  • External Services tracking monitors third-party APIs to see response times from authentication services, DRM providers, recommendation engines, and analytics platforms.
  • Distributed Tracing shows error origins so you can determine if playback failures come from your streaming infrastructure or external service outages.
  • Database Monitoring identifies slow queries to catch inefficient content lookups, user profile queries, or metadata retrievals that delay video startup.
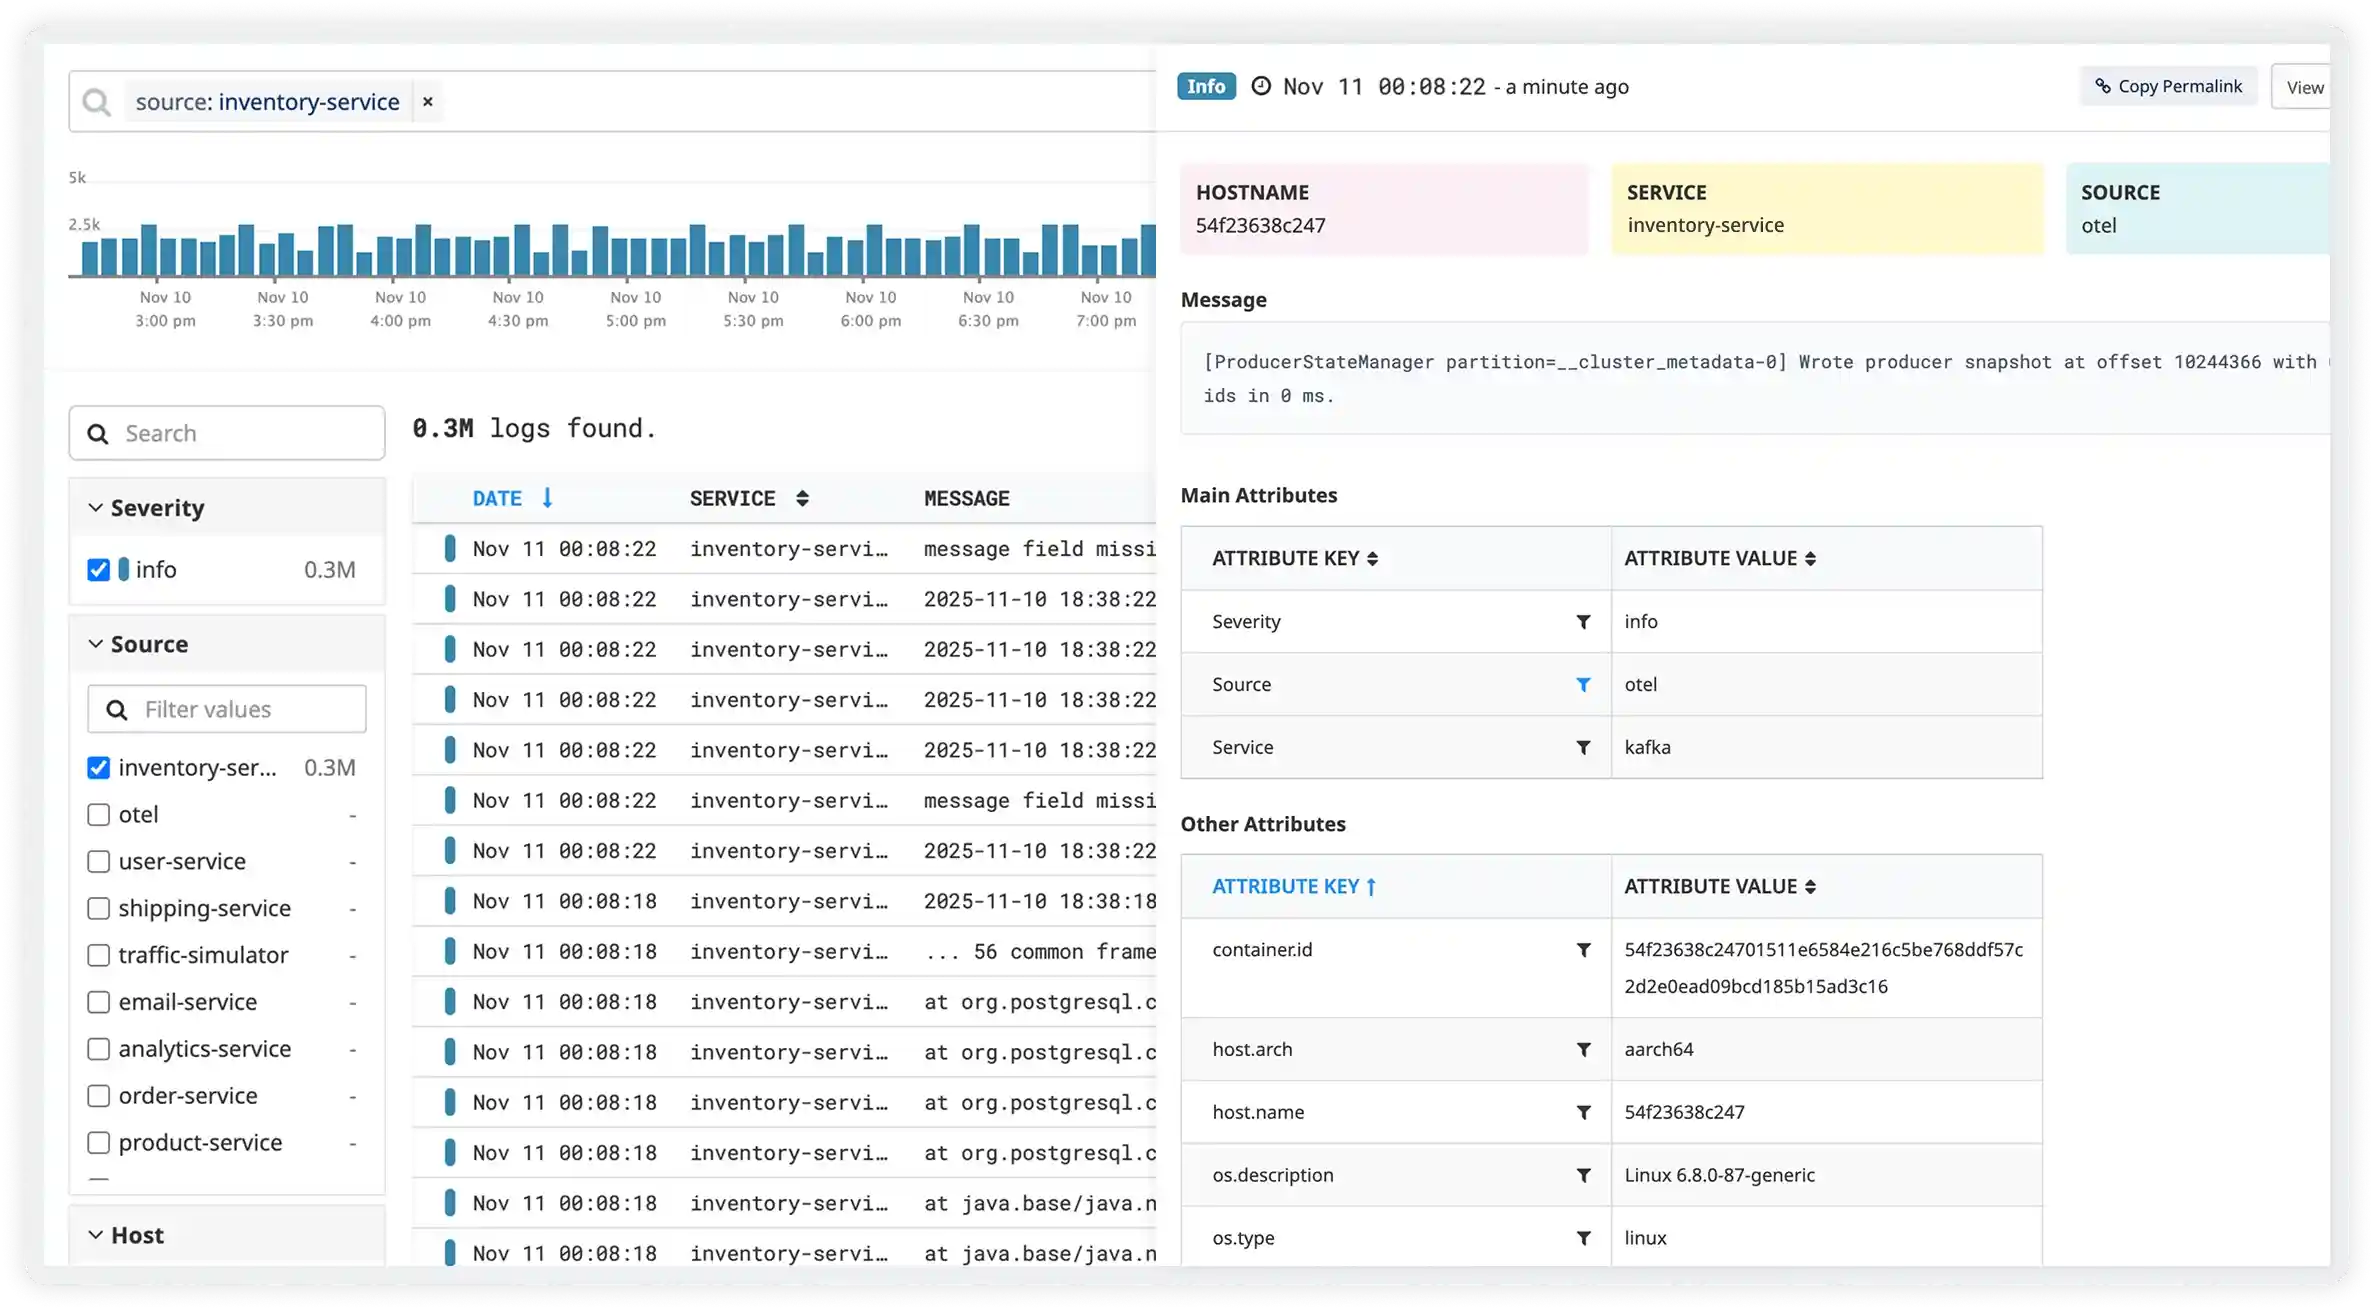
  • Log correlation connects player errors with backend failures to determine if stream interruptions originate from player bugs, transcoding issues, or server problems.
Monitor Content Delivery and Backend Services
Outcomes

How Atatus Transforms Your Operations

Measurable improvements across your DevOps workflows and business metrics

  1. 01

    Reduce Video Buffering by 70%

    70% reduction in buffering events

    Monitor CDN performance, encoding quality, and streaming bitrates to deliver smooth playback across all devices and regions.

    DevOps impact
    Identify slow CDN nodes and automatically failover to faster delivery paths
    Business impact
    Higher viewer retention and engagement with buffer-free streaming experience
  2. 02

    Accelerate Content Delivery Globally

    3x faster global delivery

    Track image and asset load times across geographies, optimize CDN configurations, and detect regional performance issues.

    DevOps impact
    Real-time CDN performance metrics with automatic alerting for slow regions
    Business impact
    Faster page loads increase engagement and reduce bounce rates
  3. 03

    Never Miss Upload Failures Again

    95% upload success rate

    Monitor upload pipelines, track processing status, and get instant alerts for failed uploads with full error context.

    DevOps impact
    Complete visibility into upload processing pipeline from client to storage
    Business impact
    Maintain creator satisfaction and prevent content delays
Teams

Unified Observability for Every Engineering Team

Atatus adapts to how engineering teams work across development, operations, and reliability.

Customers

Powering better performance for modern teams

"Solid Product even better support." The integration path is incredibly simple/easy and the overall interface is very intuitive. That said, I had a handful of odd use cases that the support team was incredibly responsive in helping me work through.

Wes DSite Reliability Engineer
FAQ

Questions Engineers Ask Before Buying

Pricing, deployment, data and the agent. If something is missing, a person will answer it on a demo call.

  • Buffering issues typically stem from slow CDN response times, inefficient video encoding, or overloaded origin servers. Atatus monitors your entire content delivery pipeline - from origin servers to CDN edge locations to player devices.

    Track video bitrate delivery, CDN cache hit rates, and player-side buffering events. See if your encoding ladder is optimized for different connection speeds, if CDN regions are performing poorly, or if origin server bandwidth is saturated during peak viewing hours.

  • Atatus combines performance monitoring with business analytics. Track not just video plays, but completion rates, average watch time, and quality metrics per content piece.

    See which videos have high play counts but low completion (indicating quality or relevance issues), which content drives premium subscriptions, and how performance correlates with engagement. This data helps your editorial team make content decisions.

  • Live streaming requires consistent low-latency performance. Atatus monitors your streaming pipeline from encoder to ingest servers to CDN to players, identifying latency at each hop.

    Track encoder performance (CPU usage, dropped frames), ingest server capacity, CDN propagation delays, and player-side playback issues. Get real-time alerts when live stream health degrades so you can fix issues before viewers complain.

  • Yes, Atatus provides geographic performance insights showing how content loads in different regions worldwide. See if European viewers get fast streaming while Asian viewers buffer.

    Identify if you need additional CDN PoPs in specific regions, if certain ISPs have poor peering, or if regional servers need scaling. Real user monitoring shows actual viewer experience by location, device, and network.

  • Atatus tracks bandwidth usage, storage consumption, and transcoding costs to help optimize your media infrastructure spend:

    • Identify which videos consume the most bandwidth (low-value content driving high costs)
    • Track CDN costs by region and identify expensive traffic patterns
    • Monitor transcoding costs and optimize encoding profiles to reduce waste
    • Detect inefficient caching (repeated origin fetches for popular content)

    Media companies typically reduce delivery costs by 30-50% after optimizing based on Atatus insights.

  • For streaming platforms, focus on these key metrics that Atatus tracks:

    • Video Start Time (VST) - how quickly playback begins after pressing play
    • Buffering Ratio - percentage of watch time spent buffering
    • Video Bitrate - quality delivered based on network conditions
    • Completion Rate - percentage of video watched (engagement metric)
    • Error Rate - failed plays, timeouts, DRM issues
    • CDN Cache Hit Rate - efficiency of content delivery

    These metrics directly correlate with viewer satisfaction and churn. A 1-second increase in start time can reduce viewing by 6%.

Get started

See the root cause first.

Start free and send your first trace with OpenTelemetry or the Atatus agents. APM, logs, RUM, infrastructure and SIEM, all on one timeline.

  • SaaS
  • On-premises
  • Hybrid
  • BYOC
  • No per-user pricing