
AI powered log management
Atatus centralizes every log across your stack, lets you search in plain English with AI, and correlates logs with traces and metrics — so engineering teams resolve incidents 3× faster.
60%
Reduction in storage costs
<2s
Search across 1B logs
3×
Faster root cause analysis
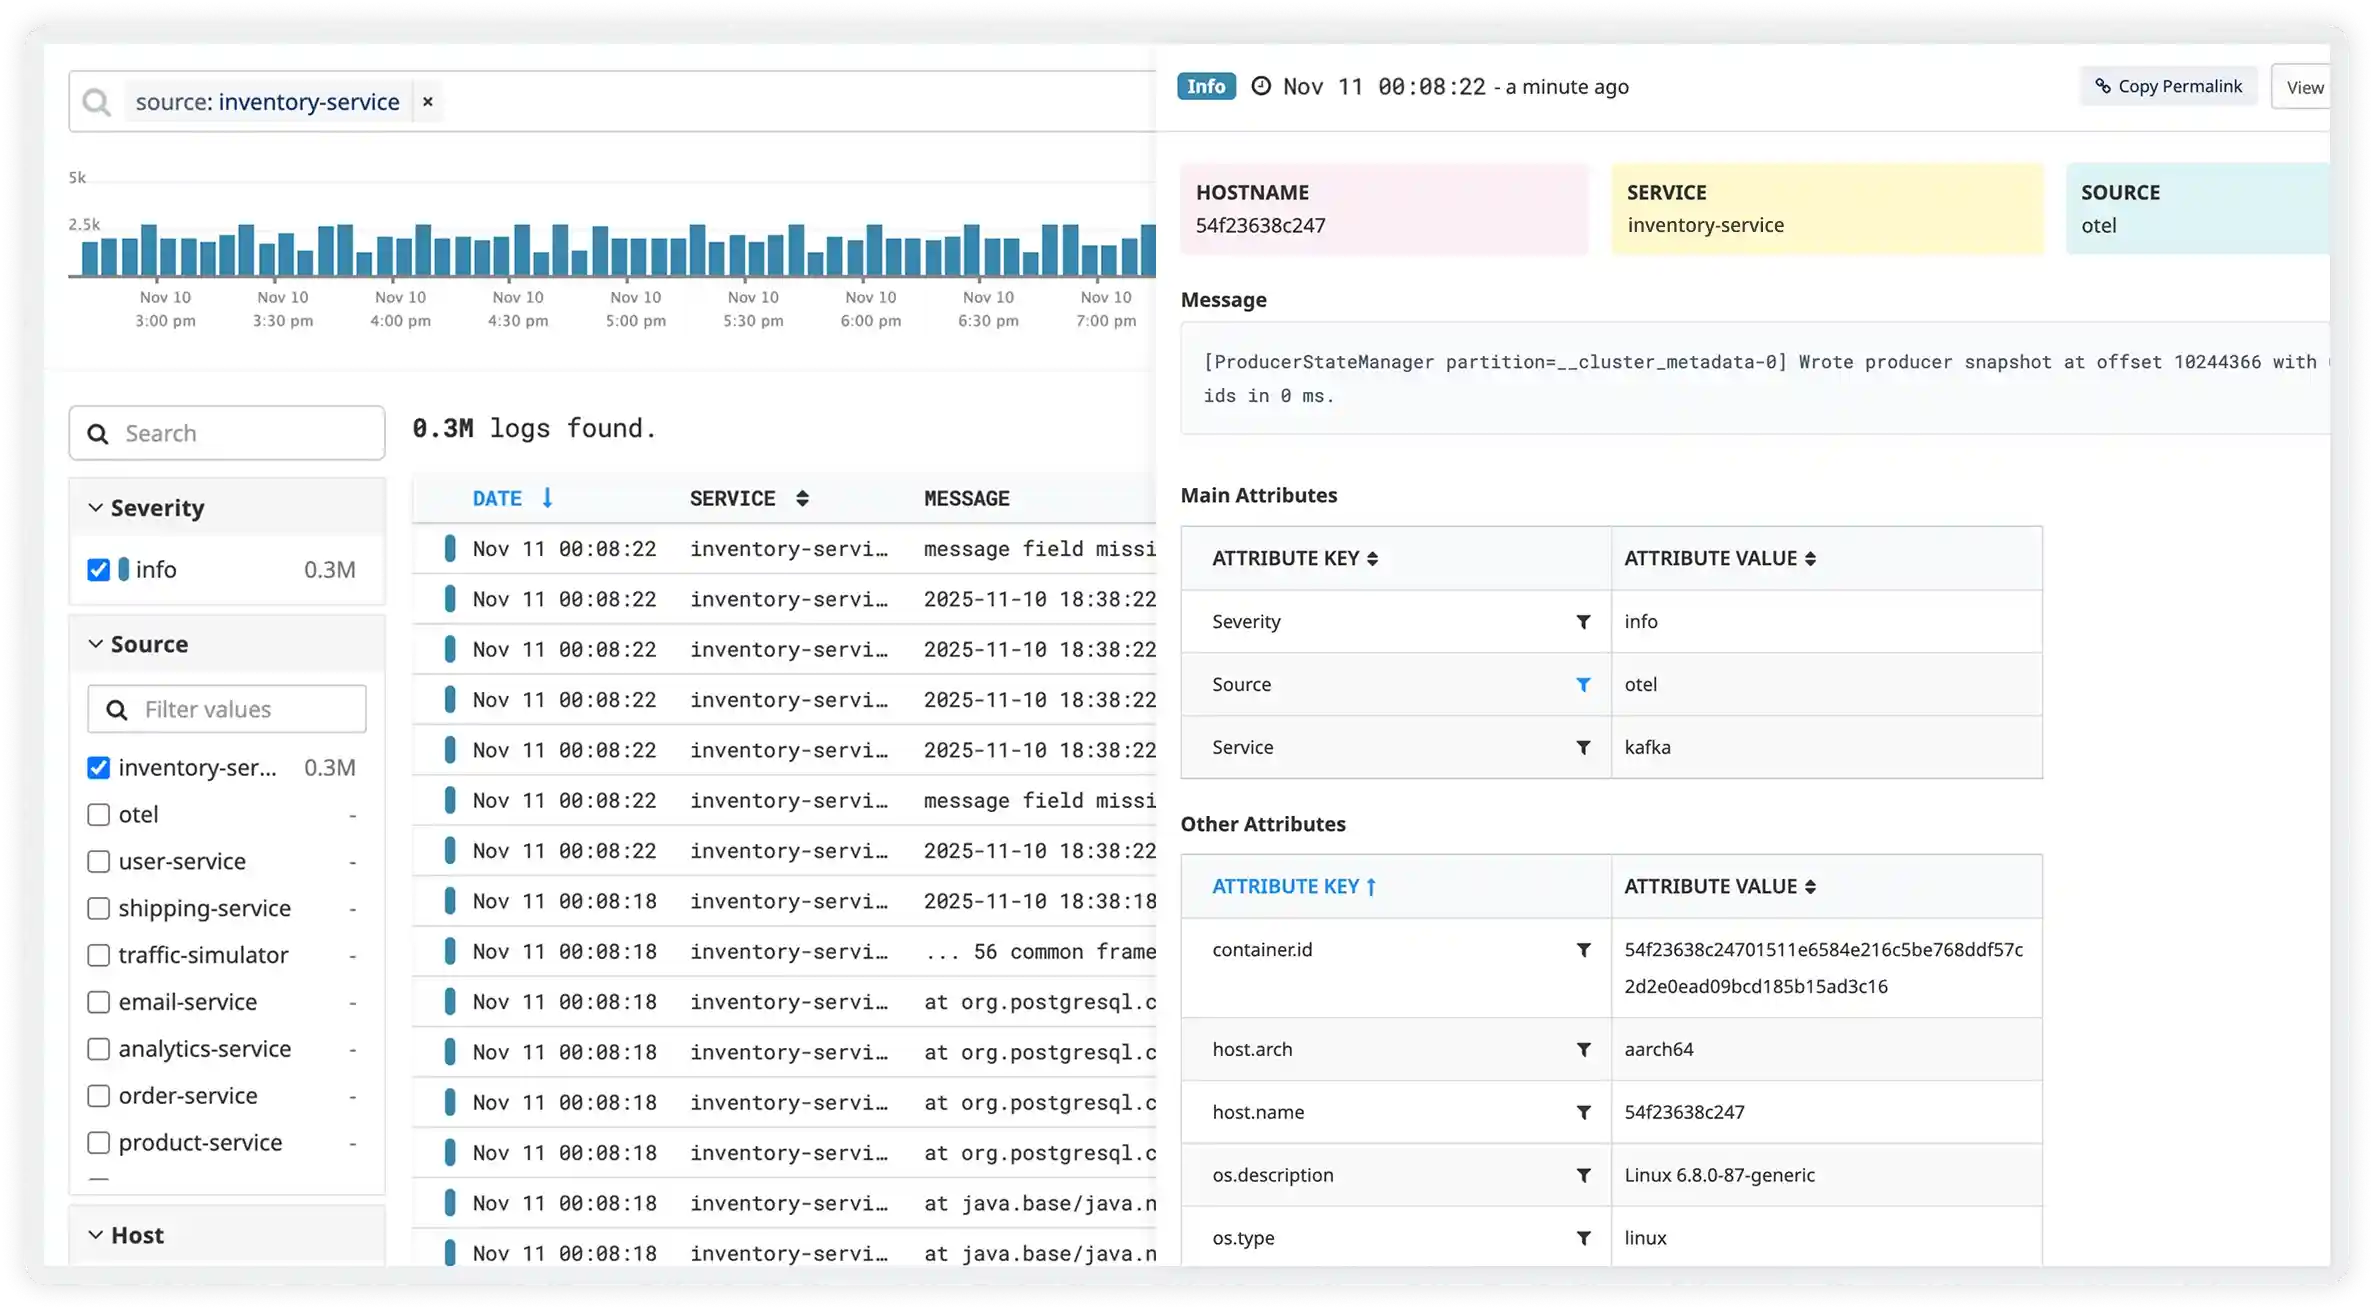
How Atatus log management accelerates troubleshooting
Centralize, search, and analyze logs with measurable improvements in debugging speed and cost savings.
AI Log Search
Natural language queries surface the exact logs, patterns, and anomalies your team needs — no syntax required.
Centralized Log Aggregation
Collect logs from apps, servers, containers, and cloud services in one searchable centralized log management hub.
Lightning-Fast Search
Sub-second full-text search across billions of log events with regex, advanced filtering, and instant results.
Logs · Traces · Metrics
Jump from a log error to the originating trace and metric spike. Full observability context without switching tools.
Reduce Storage Costs by 60%
Smart tiered storage, log sampling, and compression. Keep what matters, drop the noise — without blind budget overruns.
Real-Time Log Streaming
Live Tail your logs during production incidents. Filter by service, severity, or keyword in real time — no refresh button.
Everything you need to manage logs at scale
Production-ready features your engineering, SRE, and DevOps teams will actually use every day.
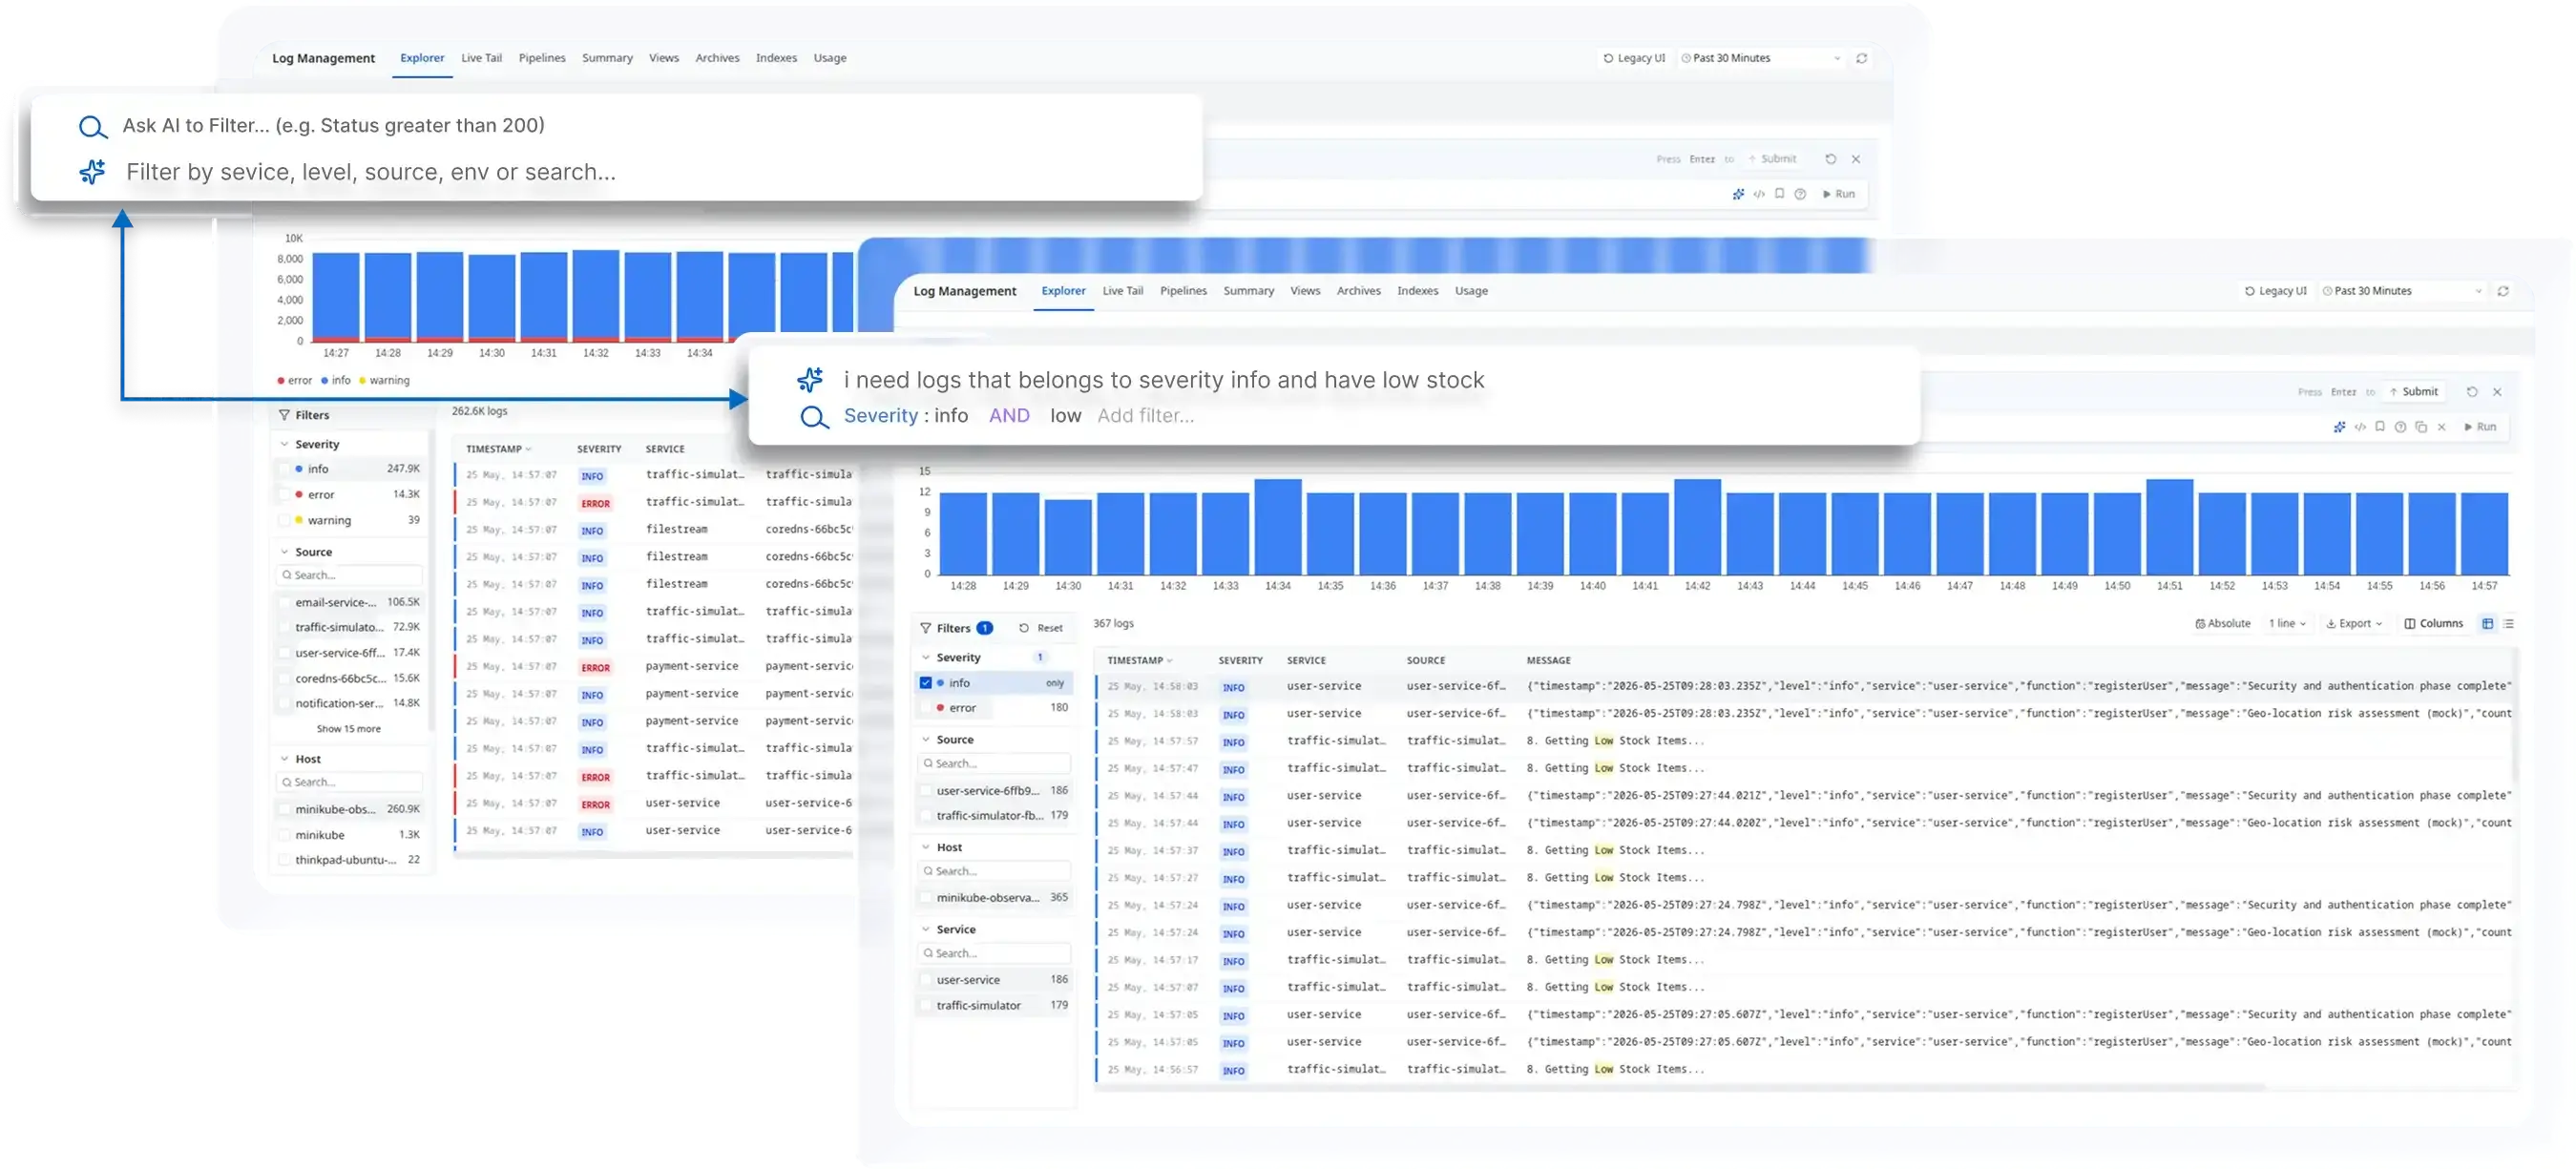
Ask a question. Get the answer instantly
No query syntax. No manual filtering. Type your question in plain English and Atatus surfaces the exact log lines, anomalies, and error patterns your team needs — in seconds.
- Ask "show all 4xx errors from payment-service in the last 30 minutes" — Atatus understands intent, not just keywords.
- Clusters of recurring errors are automatically grouped — no manual scanning through 262K log lines.
- Eliminate the noise, get to root cause in seconds. AI-powered log management that actually accelerates debugging.
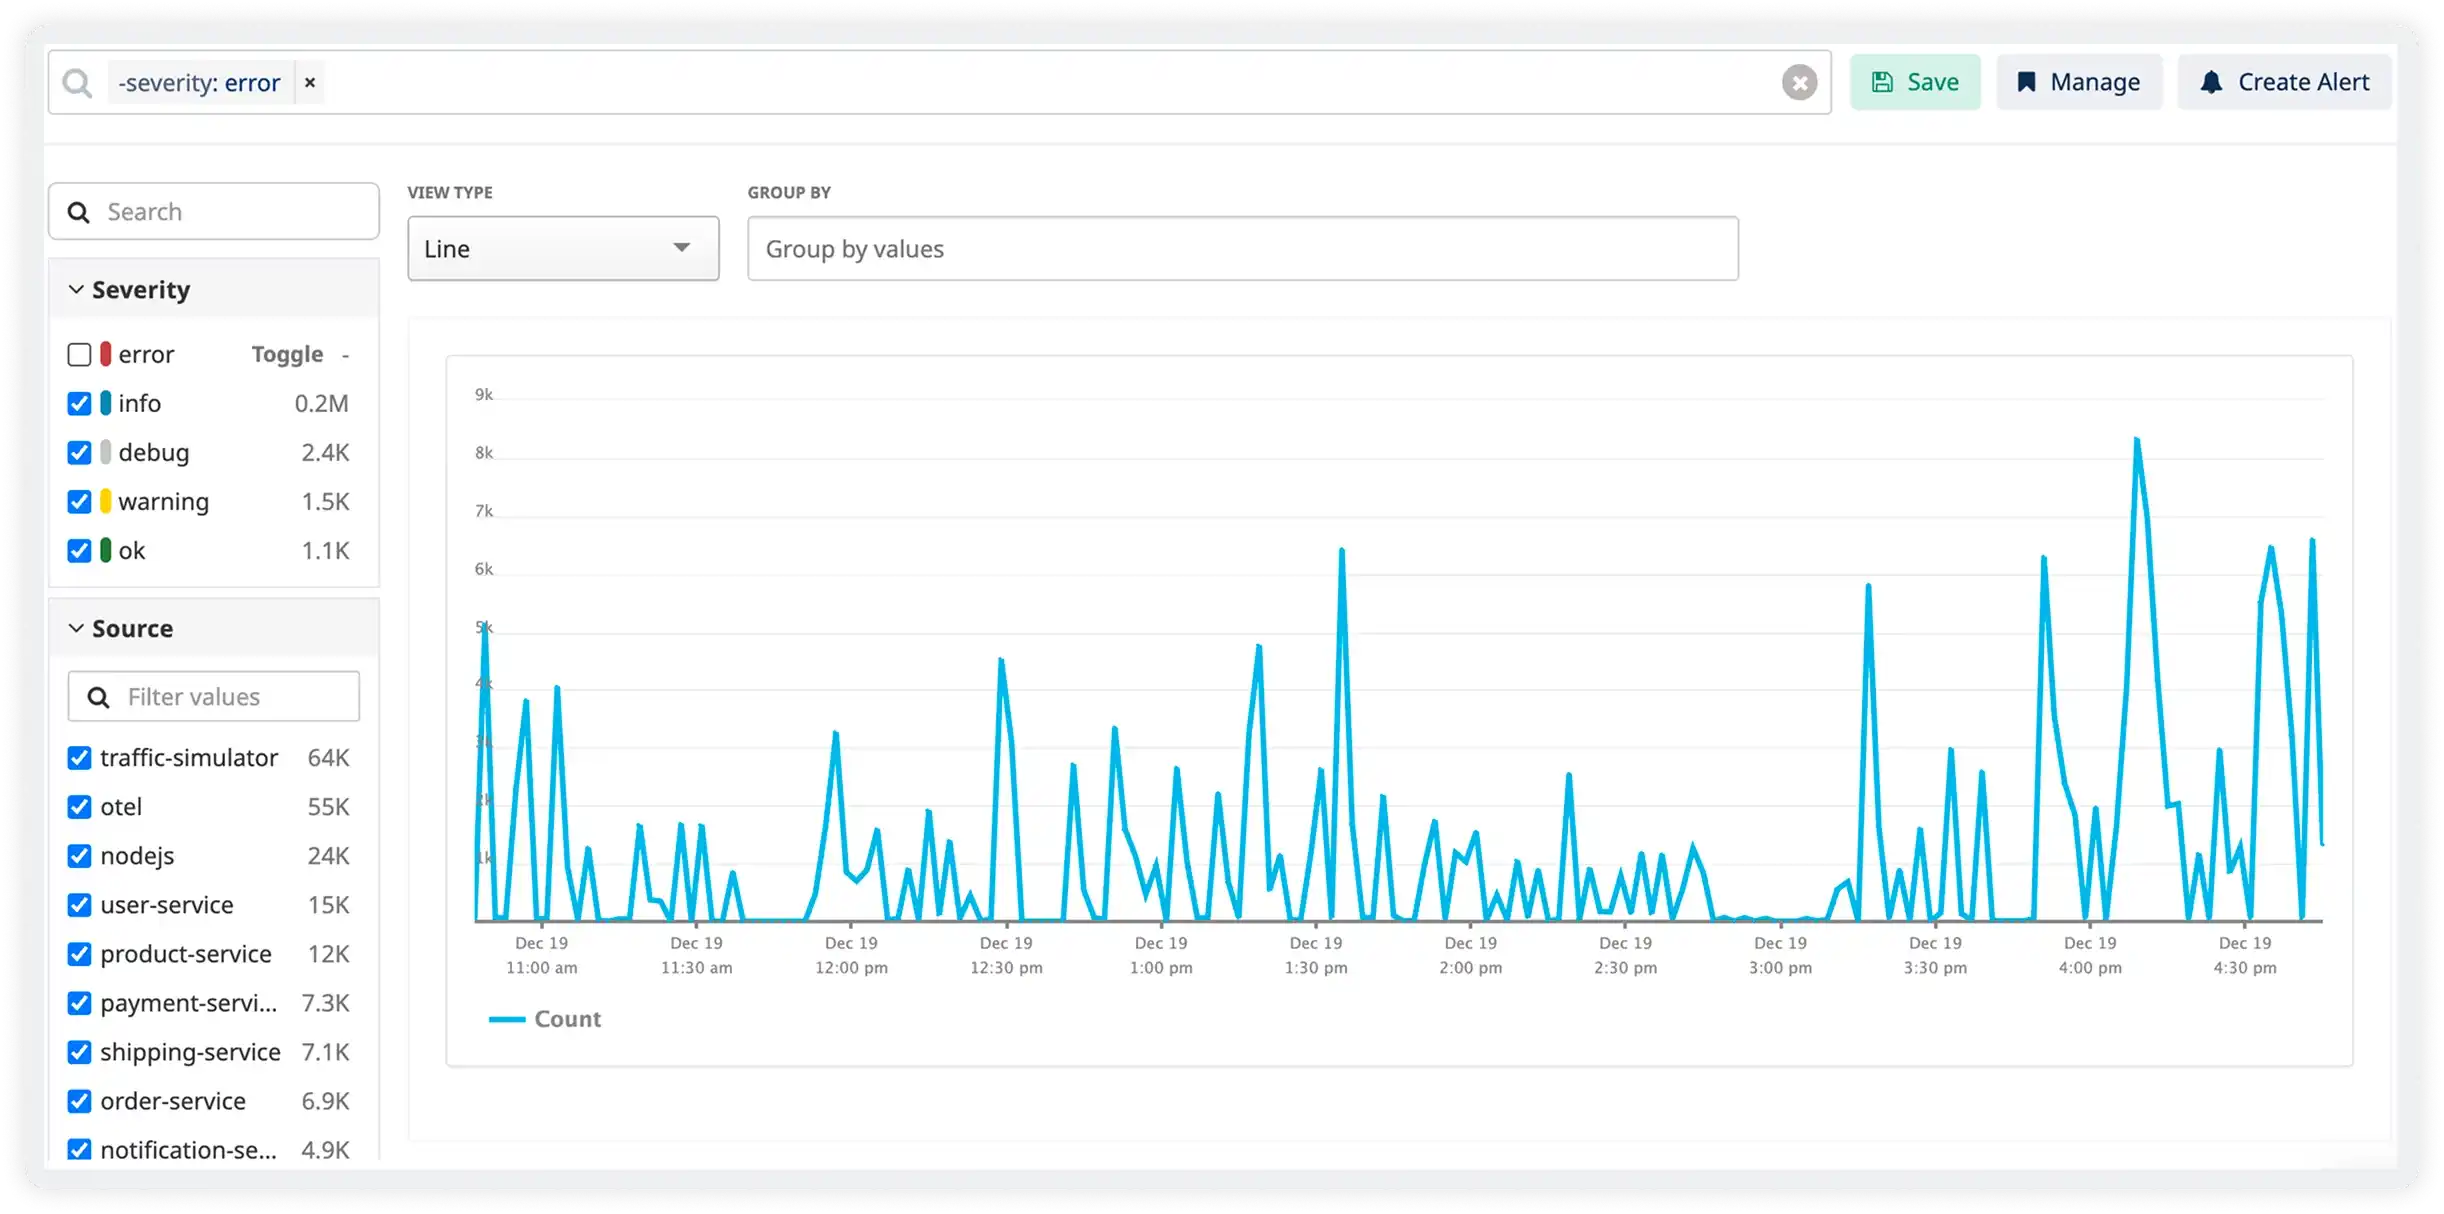
Turn raw logs into clear operational intelligence
Slice, filter, and query massive log volumes to uncover performance trends, error spikes, and service-level patterns. Stop staring at raw log lines — get answers that teams can act on immediately.
- Visual analytics dashboards with drill-down into any log attribute — service, host, severity, environment
- Group, aggregate, and compare log volumes across time ranges without leaving the explorer
- Share saved queries and analysis views across your engineering and SRE team instantly
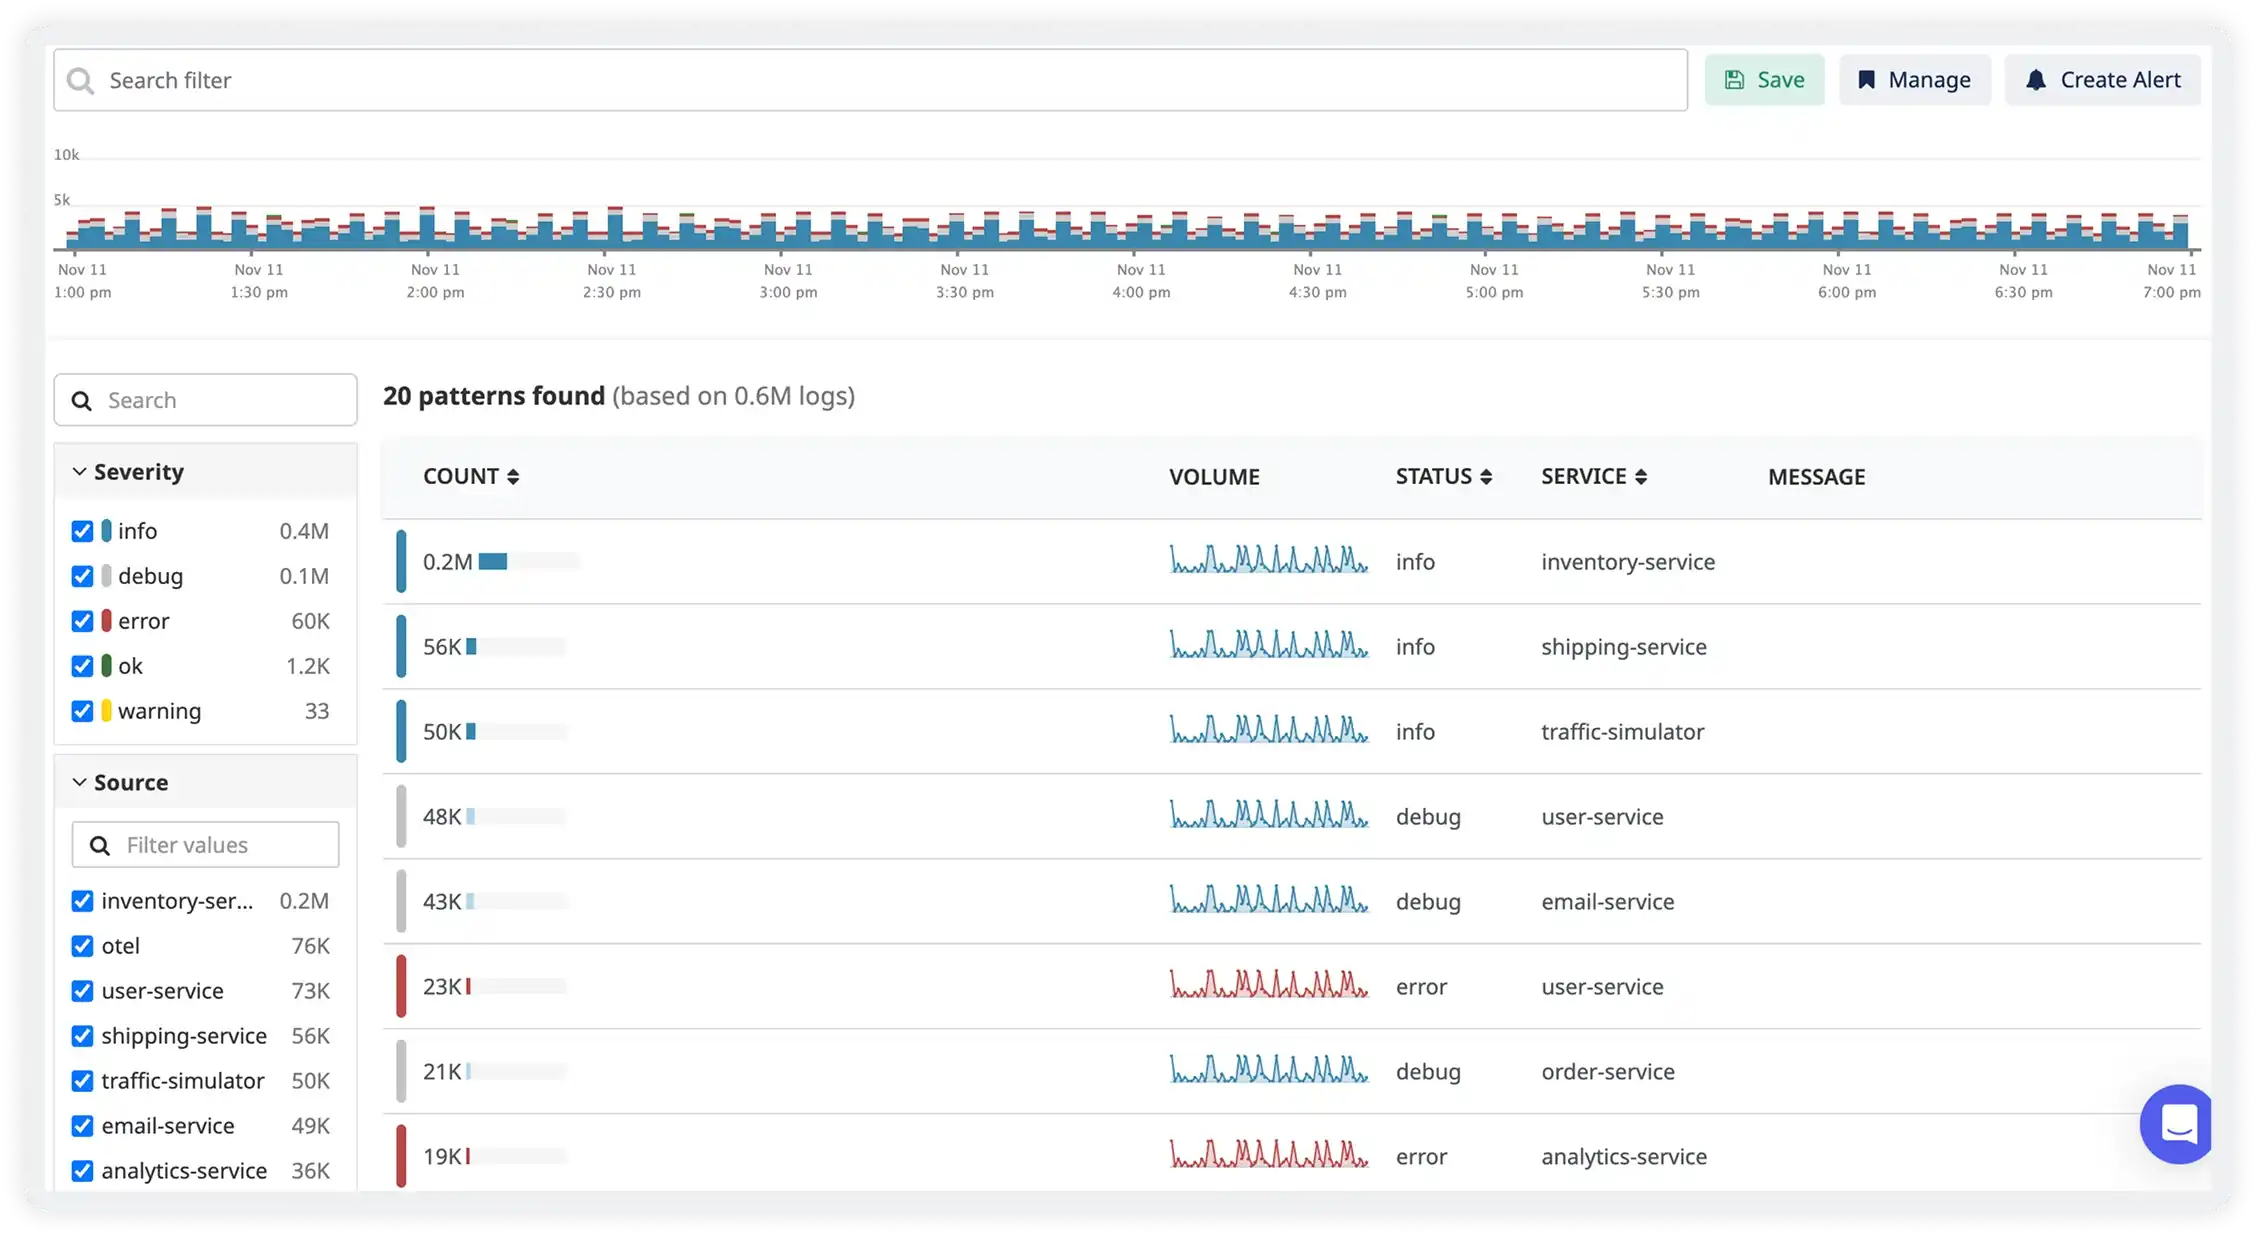
Spot repeating failures before they become incidents
Atatus automatically clusters recurring log patterns and surfaces anomalies in real time. No more scanning through thousands of identical error lines — the AI identifies what's new, what's recurring, and what needs your attention first.
- Automatic log pattern clustering — groups identical errors so you see frequency, not noise
- AI-detected anomalies alert your team before error volumes reach a critical threshold
- Distinguish between known patterns and novel failures — reduce false positive alert fatigue by 60%
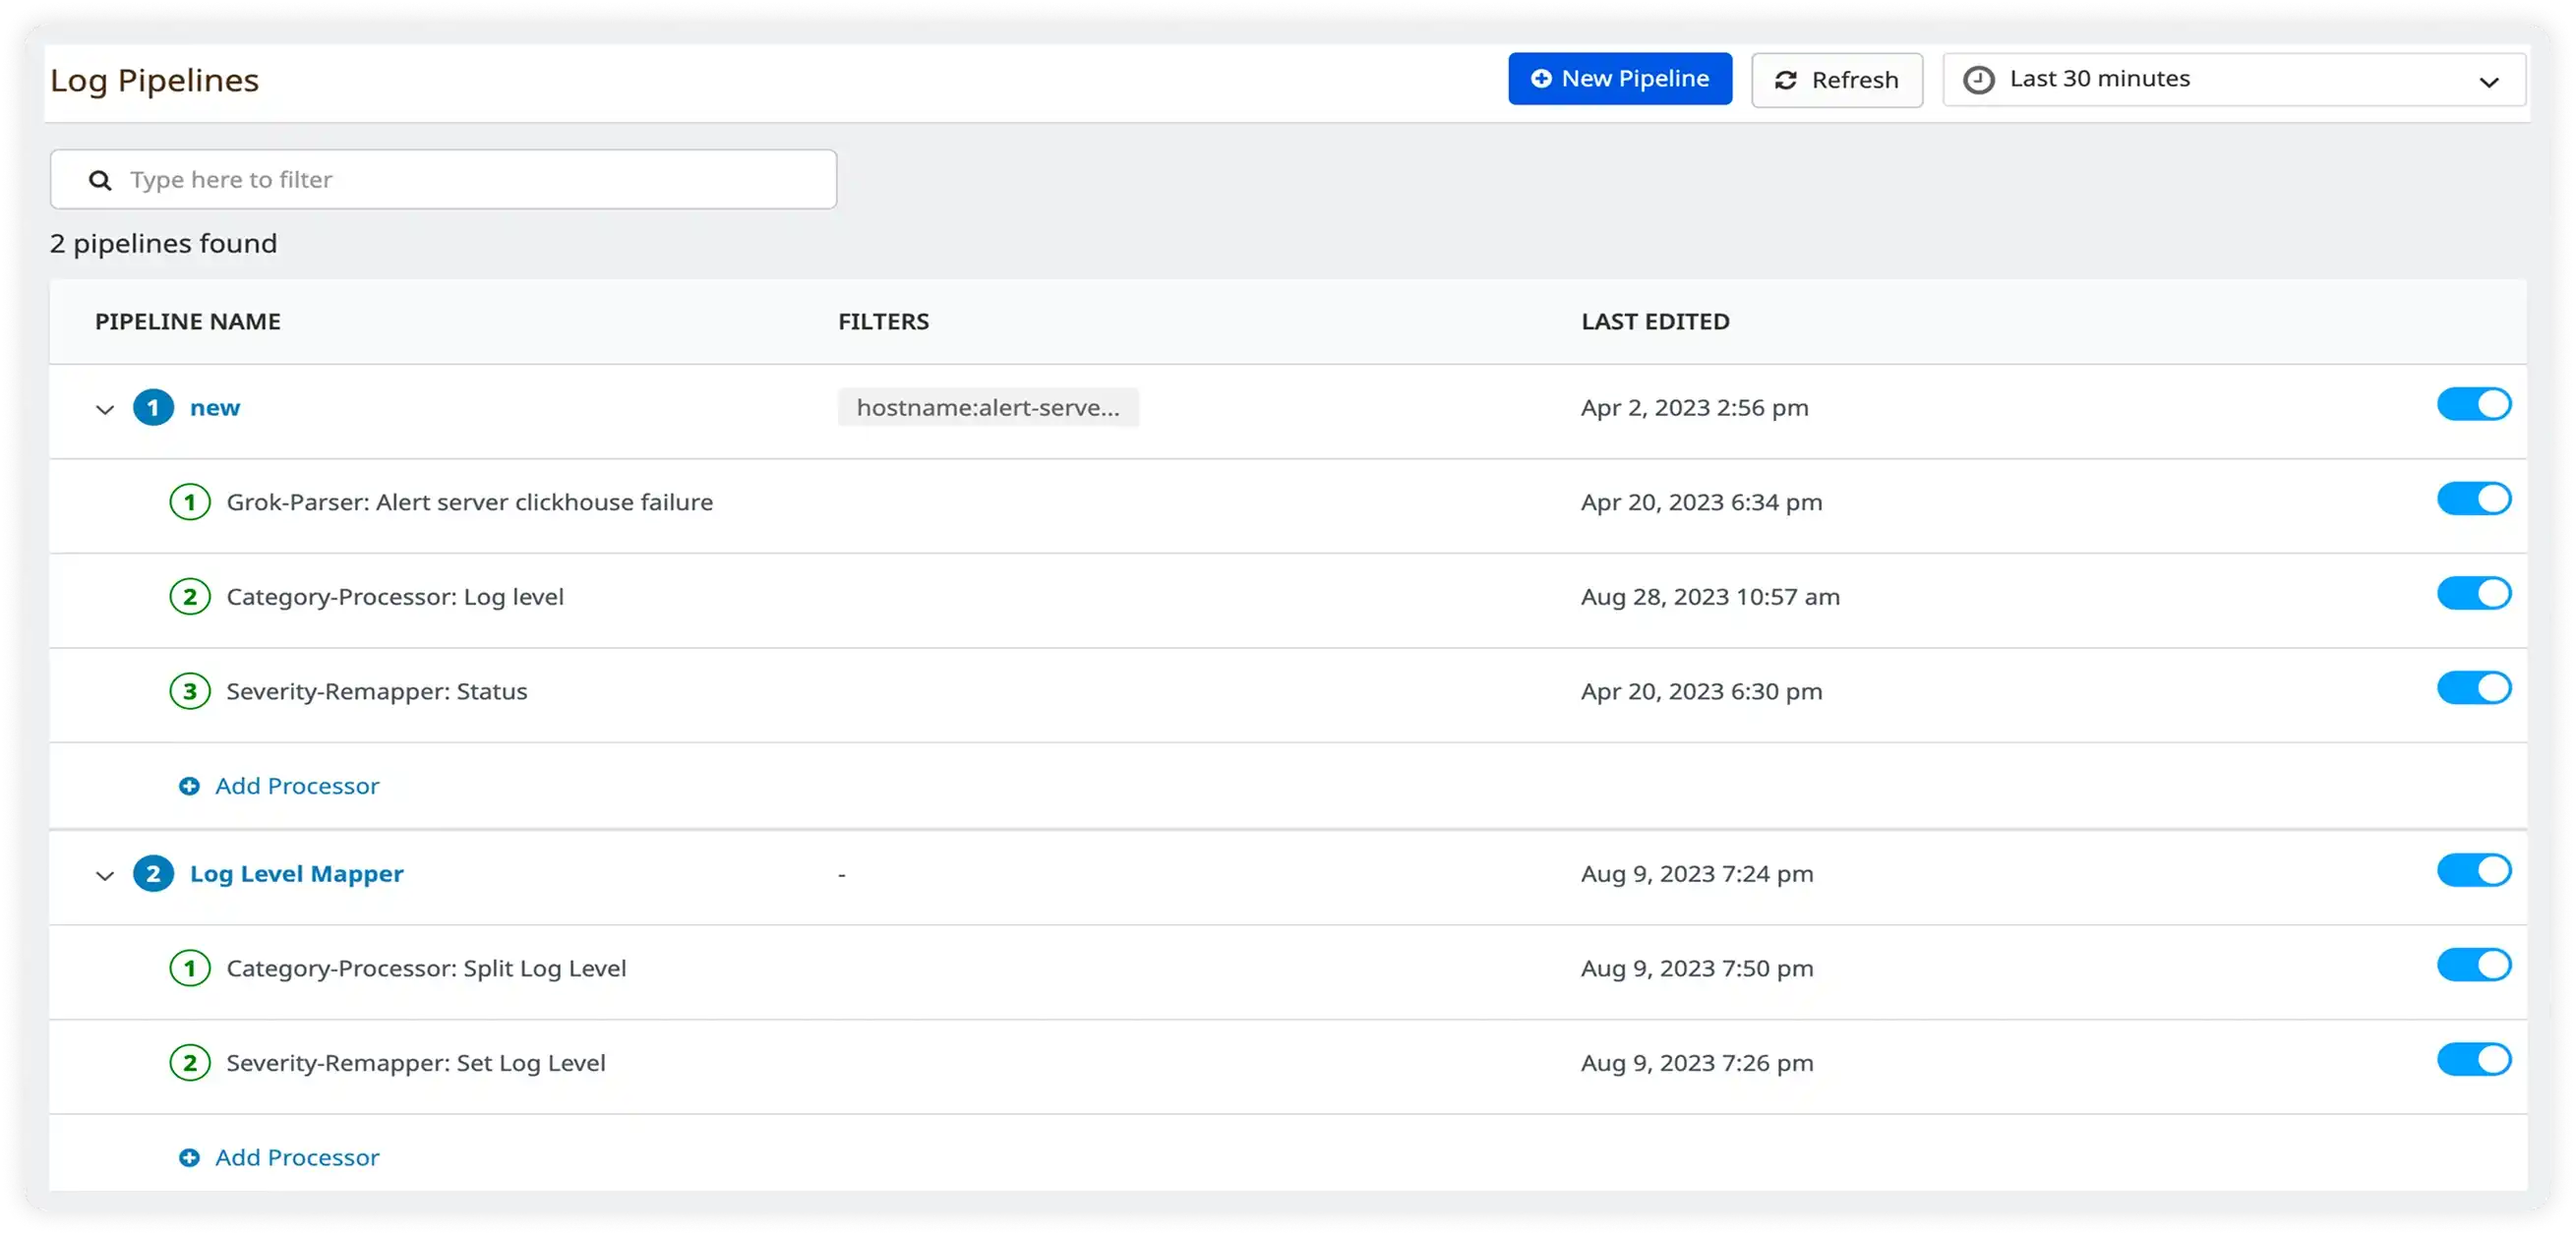
Shape logs before they cost you at the source
Parse, enrich, filter, and route logs in real time using pipeline rules. Control exactly what gets ingested, transformed, and stored — reducing unnecessary volume and improving signal quality before logs reach storage.
- Drop, sample, or route noisy logs before ingestion cut costs without losing critical signal
- Auto-parse JSON, syslog, Apache, Nginx, and custom log formats, no per-service custom parsers
- Enrich logs in transit with service metadata, geo-location, and custom fields for faster investigation
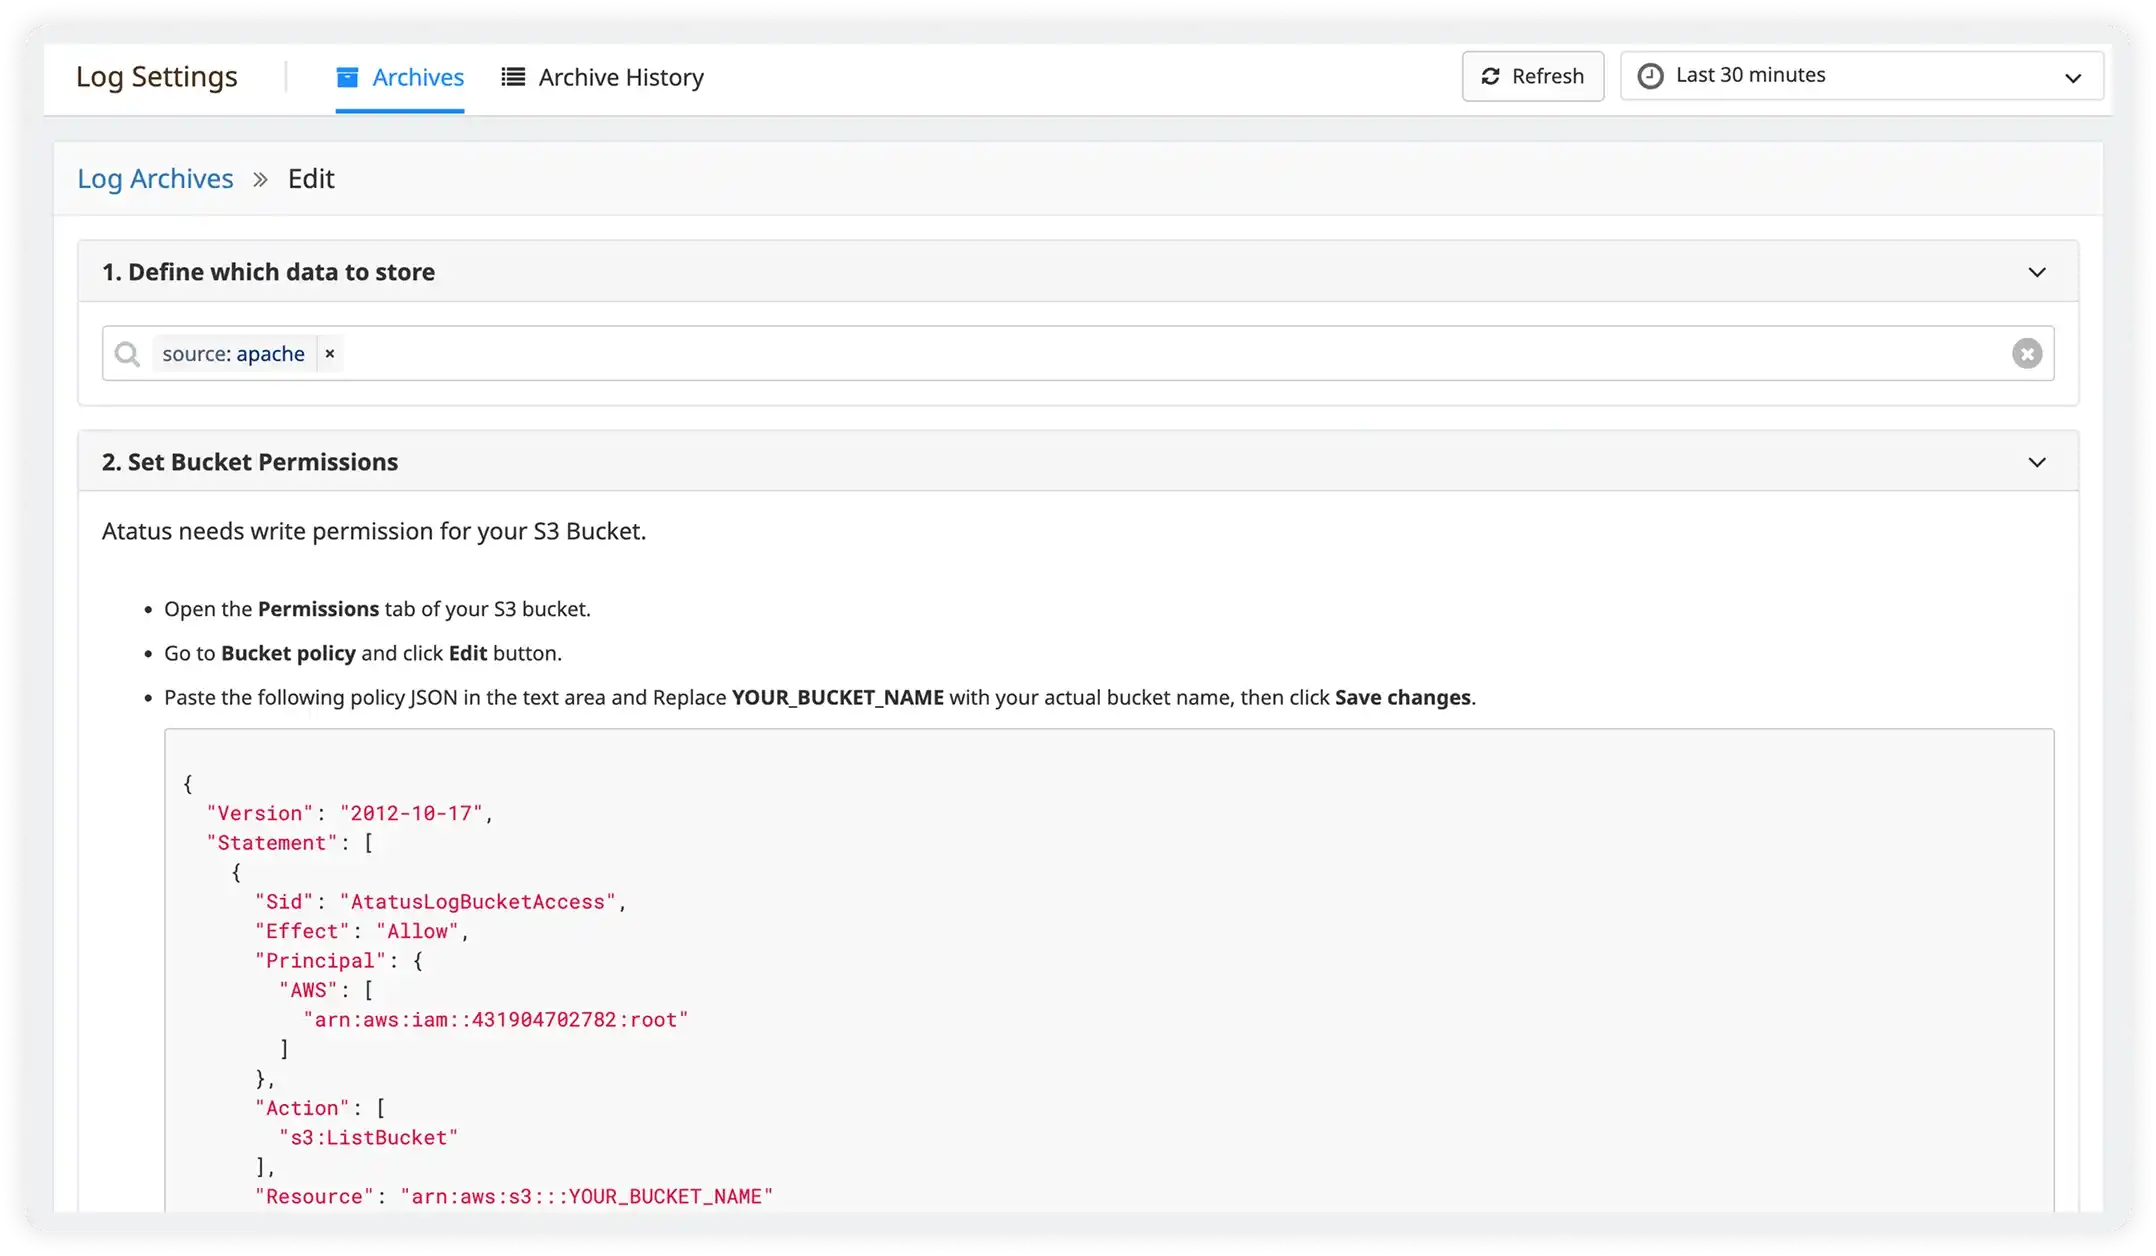
Archive logs for compliance. Retrieve them in seconds
Securely archive logs for long-term retention without sacrificing searchability. Tiered hot, warm, and cold storage keeps compliance requirements met while eliminating the budget shock of storing everything at index-speed cost.
- Tiered storage architecture — hot for recent logs, cold archives for compliance at a fraction of the cost
- Full-text search across archived logs without manual restore or export workflows
- Meet SOC 2, GDPR, HIPAA, and PCI-DSS log retention requirements without engineering overhead
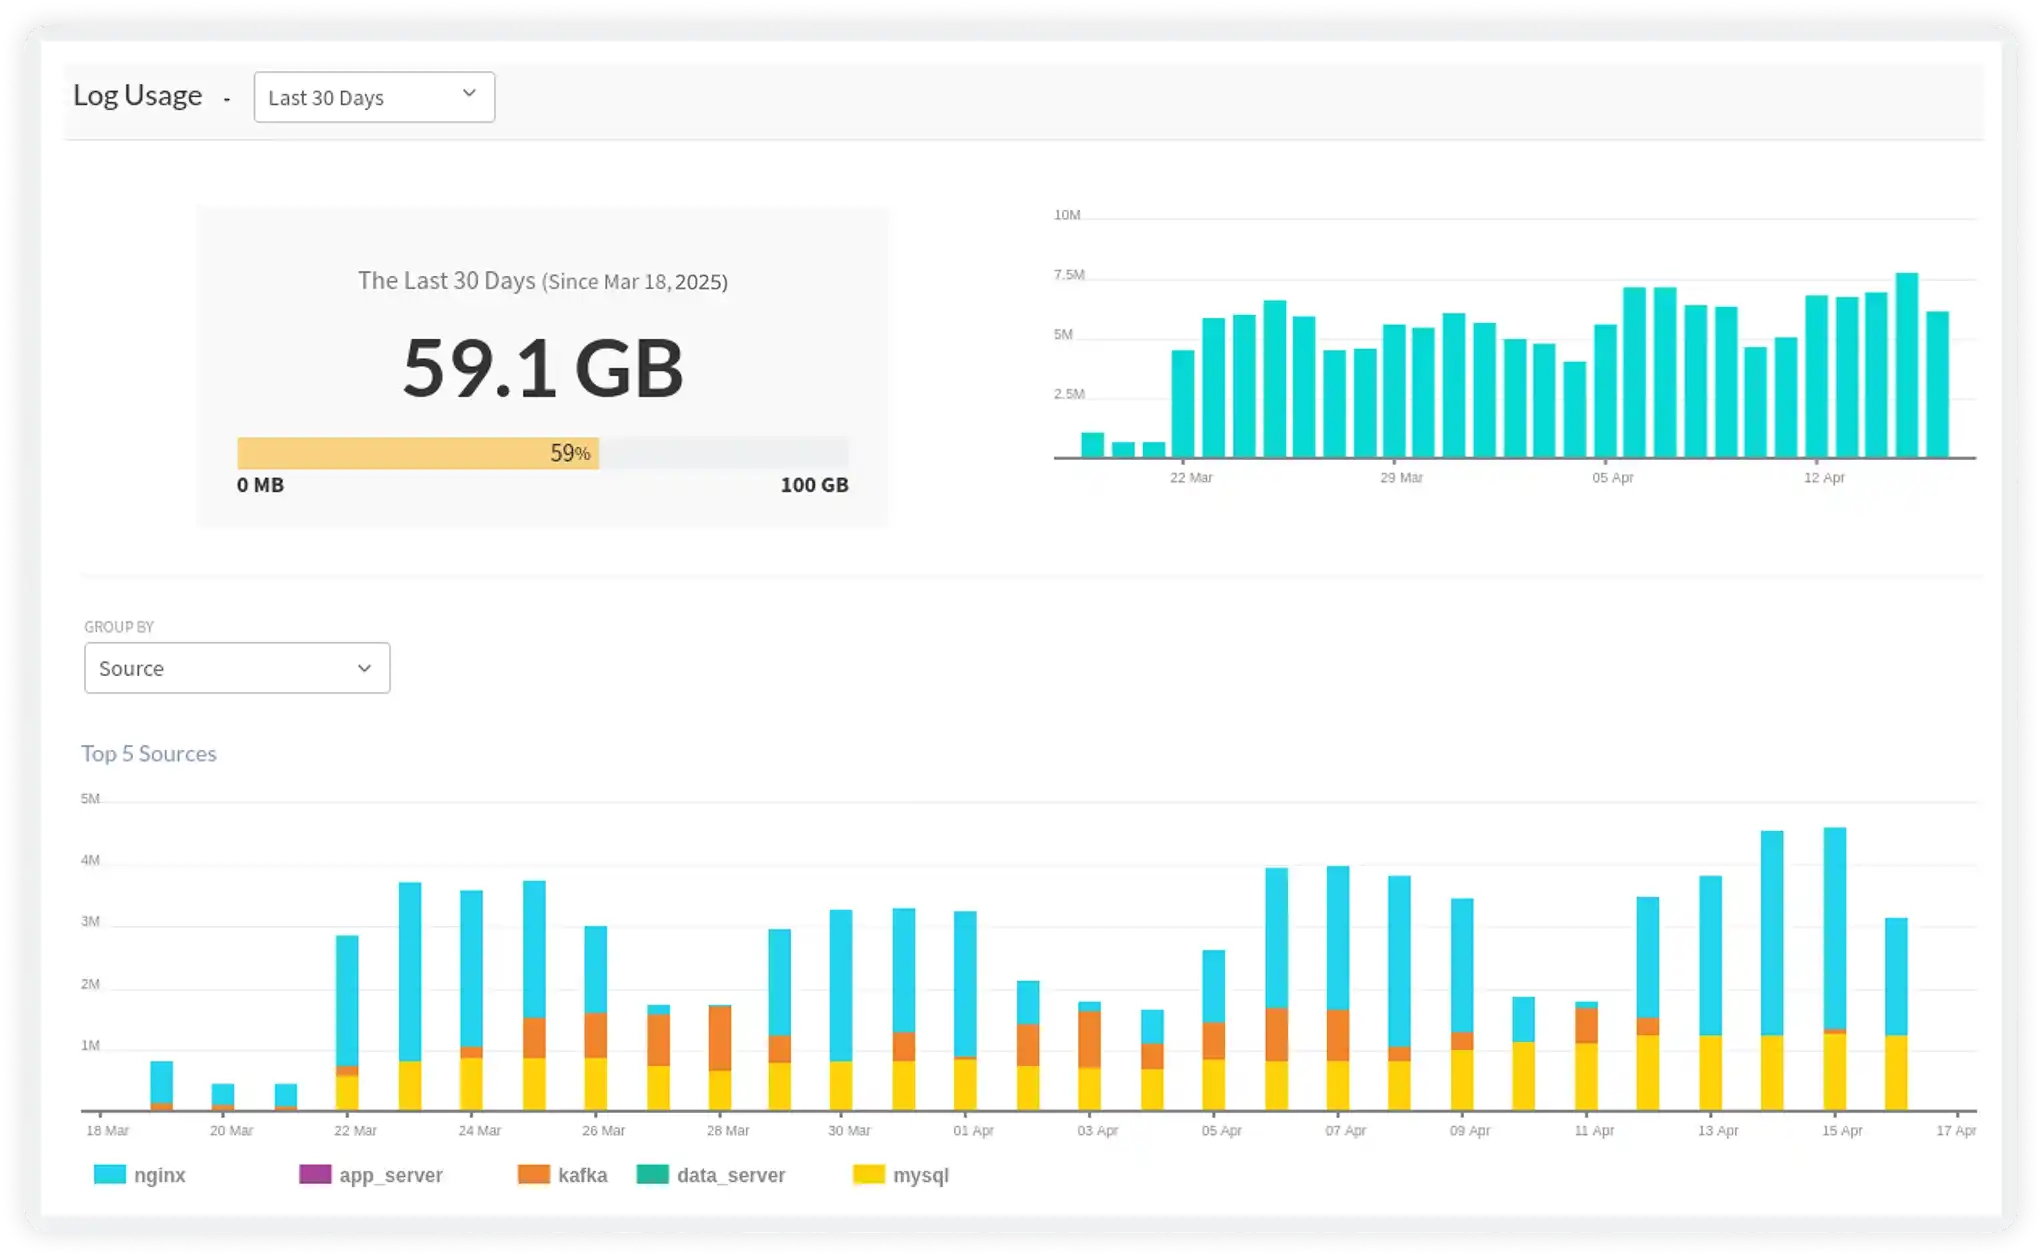
Full visibility into your log consumption and costs
Track ingestion volume, retention, and usage trends by service, team, and environment. Identify which log sources are generating the most volume — and take action before the bill arrives. No more surprise log storage overruns.
- Real-time usage dashboards broken down by service, host, environment, and log level
- Predictable, usage-based pricing — no hidden indexing fees or per-user licensing surprises
- Set ingestion budgets and usage alerts so FinOps and engineering are always aligned
Unified Monitoring for Your Entire Application Stack
Designed to support applications built with popular languages and frameworks, providing unified visibility across the entire application stack.



















Everything You Need for
Full API Observability
Built specifically for engineering teams who need powerful observability without the overhead.
Real-time Log Ingestion
Centralize logs from all your services in milliseconds. No agent delays, no data loss.
AI-Powered Search
Natural language queries — no learning curve. Find what you need in seconds, not hours.
End-to-End Correlation
Correlate logs with traces and metrics. One click from error to root cause.
Dynamic Dashboards & Alerts
Get alerted to real issues, not noise. AI deduplication cuts alert fatigue by 60%.
Low-Cost Storage Architecture
Tiered hot/warm/cold storage. Cut storage bills by up to 60% vs Datadog or Splunk.
Compliance & Security
SOC 2, HIPAA, GDPR, and PCI-DSS compliant. On-premises deployment available.
Troubleshooting workflow
From detection to resolution a smarter path
How Atatus compresses hours of log investigation into minutes for engineering and SRE teams.
Reduce MTTR dramatically
AI log search and one-click trace correlation eliminate the back-and-forth between tools that inflates incident resolution time.
Cut alert fatigue
AI deduplication and pattern clustering mean on-call engineers get paged for real issues — not noise from recurring known patterns.
Built for every role
DevOps gets pipeline control. SREs get intelligent alerts. Developers get the exact logs they need without waiting on ops.
Start Monitoring in Under 5 Minutes
Three simple steps to complete observability. No credit card required.
Real-time alerting
Immediate notification of high-priority incidents through advanced configurations based on error logs or custom queries.
Filter Context
Enhance debugging by adding/deleting related streams like host, service, source, severity for focused analysis.
Seek by Time
Pinpoint events in distributed logs for detailed issue resolution—critical for understanding specific occurrences across systems.