Unified Observability for Cloud-Native Infrastructure
See CPU, memory, disk, load and every process on each host, run HTTP and TCP health checks, and collect metrics from the services you run. One agent for Linux, macOS and Windows.
Every host. One glance.
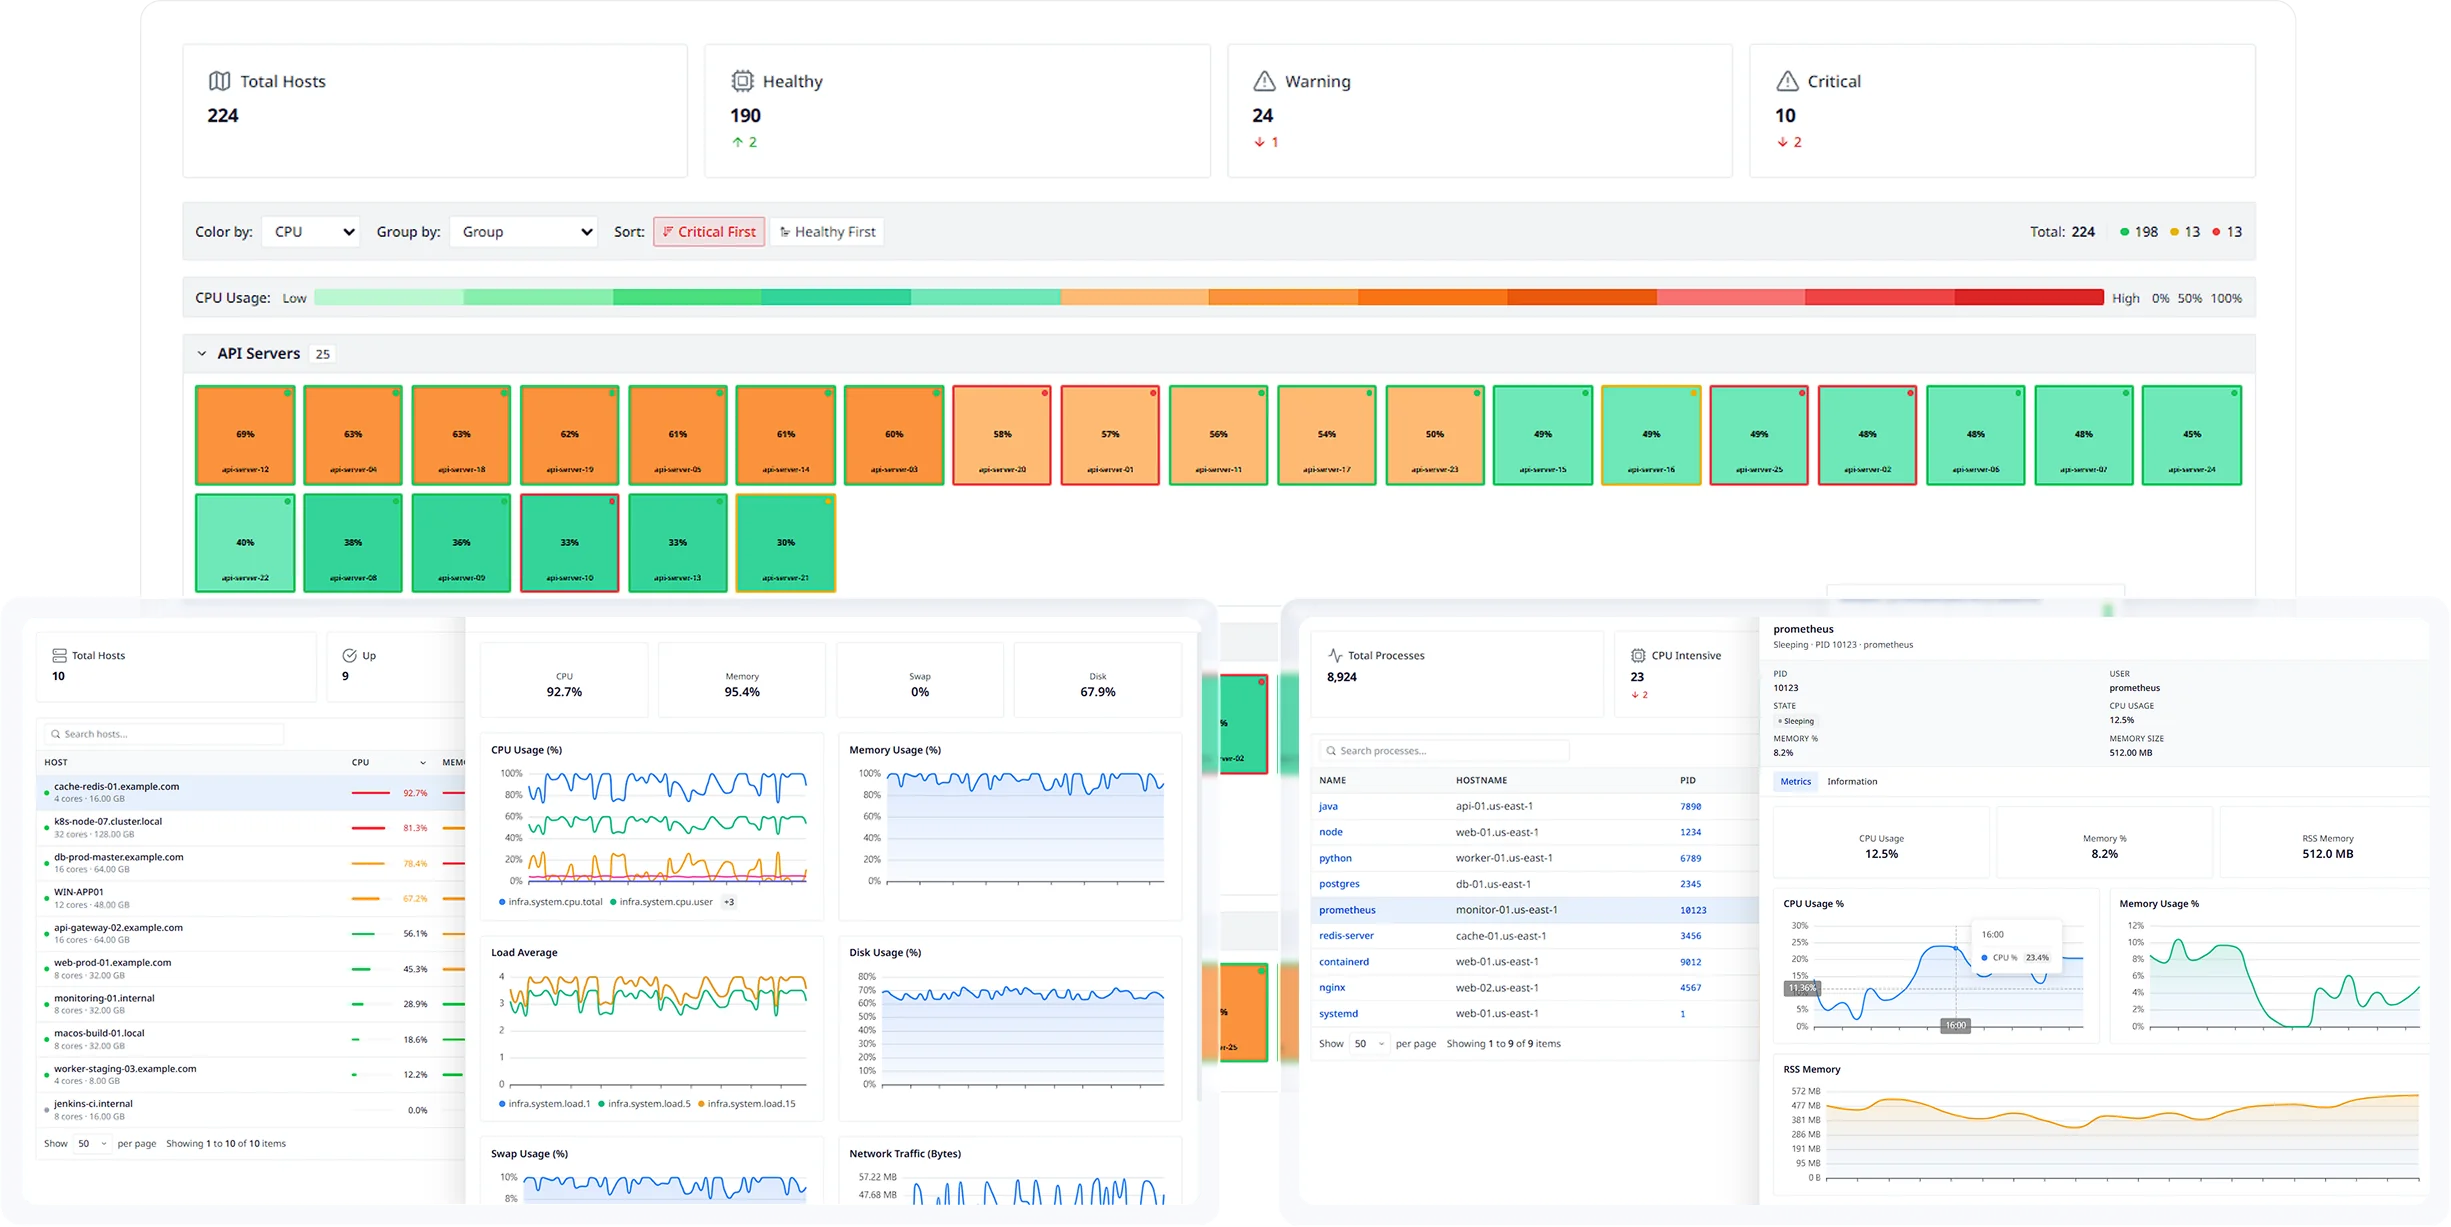
Colour the fleet by CPU, memory, I/O wait or load. Group it by the labels you set on the agent. Click a host.
Is it up? Checked every 10 seconds.
HTTP and TCP checks for your APIs, databases and queues. Break one and watch the next run catch it.
- upapiHTTP · http://localhost:8080/health · web-019 ms
14:02 bucket6 of 6 runs passed
- upelasticsearchHTTP · http://localhost:9200 · search-039 ms
14:02 bucket6 of 6 runs passed
- uppostgresTCP · localhost:5432 · db-011 ms
14:02 bucket6 of 6 runs passed
- upredisTCP · localhost:6379 · cache-024 ms
14:02 bucket6 of 6 runs passed
Runs every 10 s, replayed faster here · sample data
Break something
The next run picks it up. One down run fails that minute's bucket.
HTTP passes on any 2xx. TCP passes when the port accepts the connection.
# conf.d/http_check.d/http_check.yml
checks:
  - type: http
    name: api
    urls: ["http://localhost:8080/health"]
  - type: http
    name: elasticsearch
    urls: ["http://localhost:9200"]
# conf.d/tcp_check.d/tcp_check.yml
checks:
  - type: tcp
    name: postgres
    hosts: ["localhost:5432"]
  - type: tcp
    name: redis
    hosts: ["localhost:6379"]
Copy each .yml.template, then list your checks.
One agent. Plugins included.
Linux, macOS and Windows. Pick a plugin, copy its template, restart the agent.
# conf.d/nginx.d/nginx.yml
metrics:
  - hosts: ["http://127.0.0.1"]
    # Path to server status. Default nginx_status
    #status_path: "nginx_status"
sudo cp nginx.yml.template nginx.yml
sudo service atatus-infra-agent restartMetrics you get6 of the documented metrics
- nginx.stubstatus.acceptsnot collected
- nginx.stubstatus.handlednot collected
- nginx.stubstatus.droppednot collected
- nginx.stubstatus.requestsnot collected
- nginx.stubstatus.activenot collected
- nginx.stubstatus.waitingnot collected
sudo ATATUS_LICENSE_KEY="INFRA_LIC_KEY" apt-get install atatus-infra-agent -yAll install optionsFrom fleet to process, in one view.
Host map, host metrics and processes, as they look in Atatus.
- AI agent
Or just ask. The Atatus AI agent does all four from plain English, like “Which hosts are running hot right now?”
Questions about infrastructure monitoring
Pricing, deployment, data and the agent. If something is missing, a person will answer it on a demo call.
Infrastructure Monitoring provides real-time visibility into the health and performance of your servers, containers, cloud resources, and network. It tracks CPU, memory, disk usage, network traffic, and other critical metrics to ensure your infrastructure runs optimally.
The Atatus Infrastructure agent monitors Linux, macOS and Windows hosts: CPU, memory, disk, load, network and every process. Its bundled plugins cover Nginx, Apache, HAProxy, MySQL, PostgreSQL, MongoDB, Redis and Memcached, and it also runs health checks and monitors Docker containers and Kubernetes. AWS and Azure connect through their integrations, and network devices through Network Device Monitoring.
Hosts in any cloud or data center run the Infrastructure agent. For cloud services, Atatus connects to AWS with a read-only IAM role and to Azure with an Entra ID app registration, then collects CloudWatch or Azure Monitor metrics, resource metadata and, if you turn it on, logs. Those integrations need no agent.
Yes. Infrastructure alert rules cover system, process, network and storage metrics, plus a host that stops reporting, a failing health check and a process that stops running. Set warning and critical thresholds and a 5 to 60 minute window, and get notified by email, Slack, Microsoft Teams, PagerDuty, OpsGenie, webhooks and more.
Add tags, labels and custom data in the agent's atatus.yml. Labels such as host_group, env and data_center group hosts in the UI, and tags and custom data let you filter them. You can also set a custom hostname for each host.
Infrastructure Monitoring is priced per host: $20 per host per month, or $15 per host per month with yearly billing. A host is a machine that sends data to Atatus for 720 hours in a month. Containers on a host are included at no extra charge, and there is no per-user pricing.
HTTP and TCP checks. An HTTP check sends a GET request every 10 seconds and passes on any 2xx response. A TCP check tries to connect to a host and port every 10 seconds and passes when the connection is accepted. You list checks in http_check.yml and tcp_check.yml, and a Checks Failing alert tells you when one goes down.
The agent installs on Debian and Ubuntu, RedHat-based systems, Musl-based systems such as Alpine, macOS and Windows, and there are tar archives for Linux, including arm64. It also runs in Docker, as a sidecar container or inside your own image.