1. Home
  2. Solutions
  3. Retail & E-Commerce
Solutions

Stop Losing Revenue to Slow Checkouts and Cart Abandonment

Every millisecond counts when customers are ready to buy. Monitor checkout performance, track conversion bottlenecks, and prevent cart abandonment with real-time insights into your e-commerce stack—from payment gateways to database queries.

OpenTelemetry nativeSaaS, on-prem, hybrid or BYOCNo per-user pricing
The problem

Common Challenges You Face

Real problems experienced by teams like yours every day

Cart Abandonment Spikes

“Customers abandon carts during checkout, but we can't pinpoint if it's slow page loads, payment gateway issues, or broken checkout flow.”

Revenue Loss During Peak Sales

“Site crashes or slows down during Black Friday, Cyber Monday, losing thousands in revenue while competitors capture our customers.”

Invisible Performance Issues

“Conversion rates drop but we only discover slow product pages, broken search, or API failures after customers complain.”

Payment Processing Failures

“Transactions fail silently, customers get frustrated, and we lose sales without knowing the root cause—payment gateway, timeout, or database issue.”
Protect Your Revenue at the Point of Sale

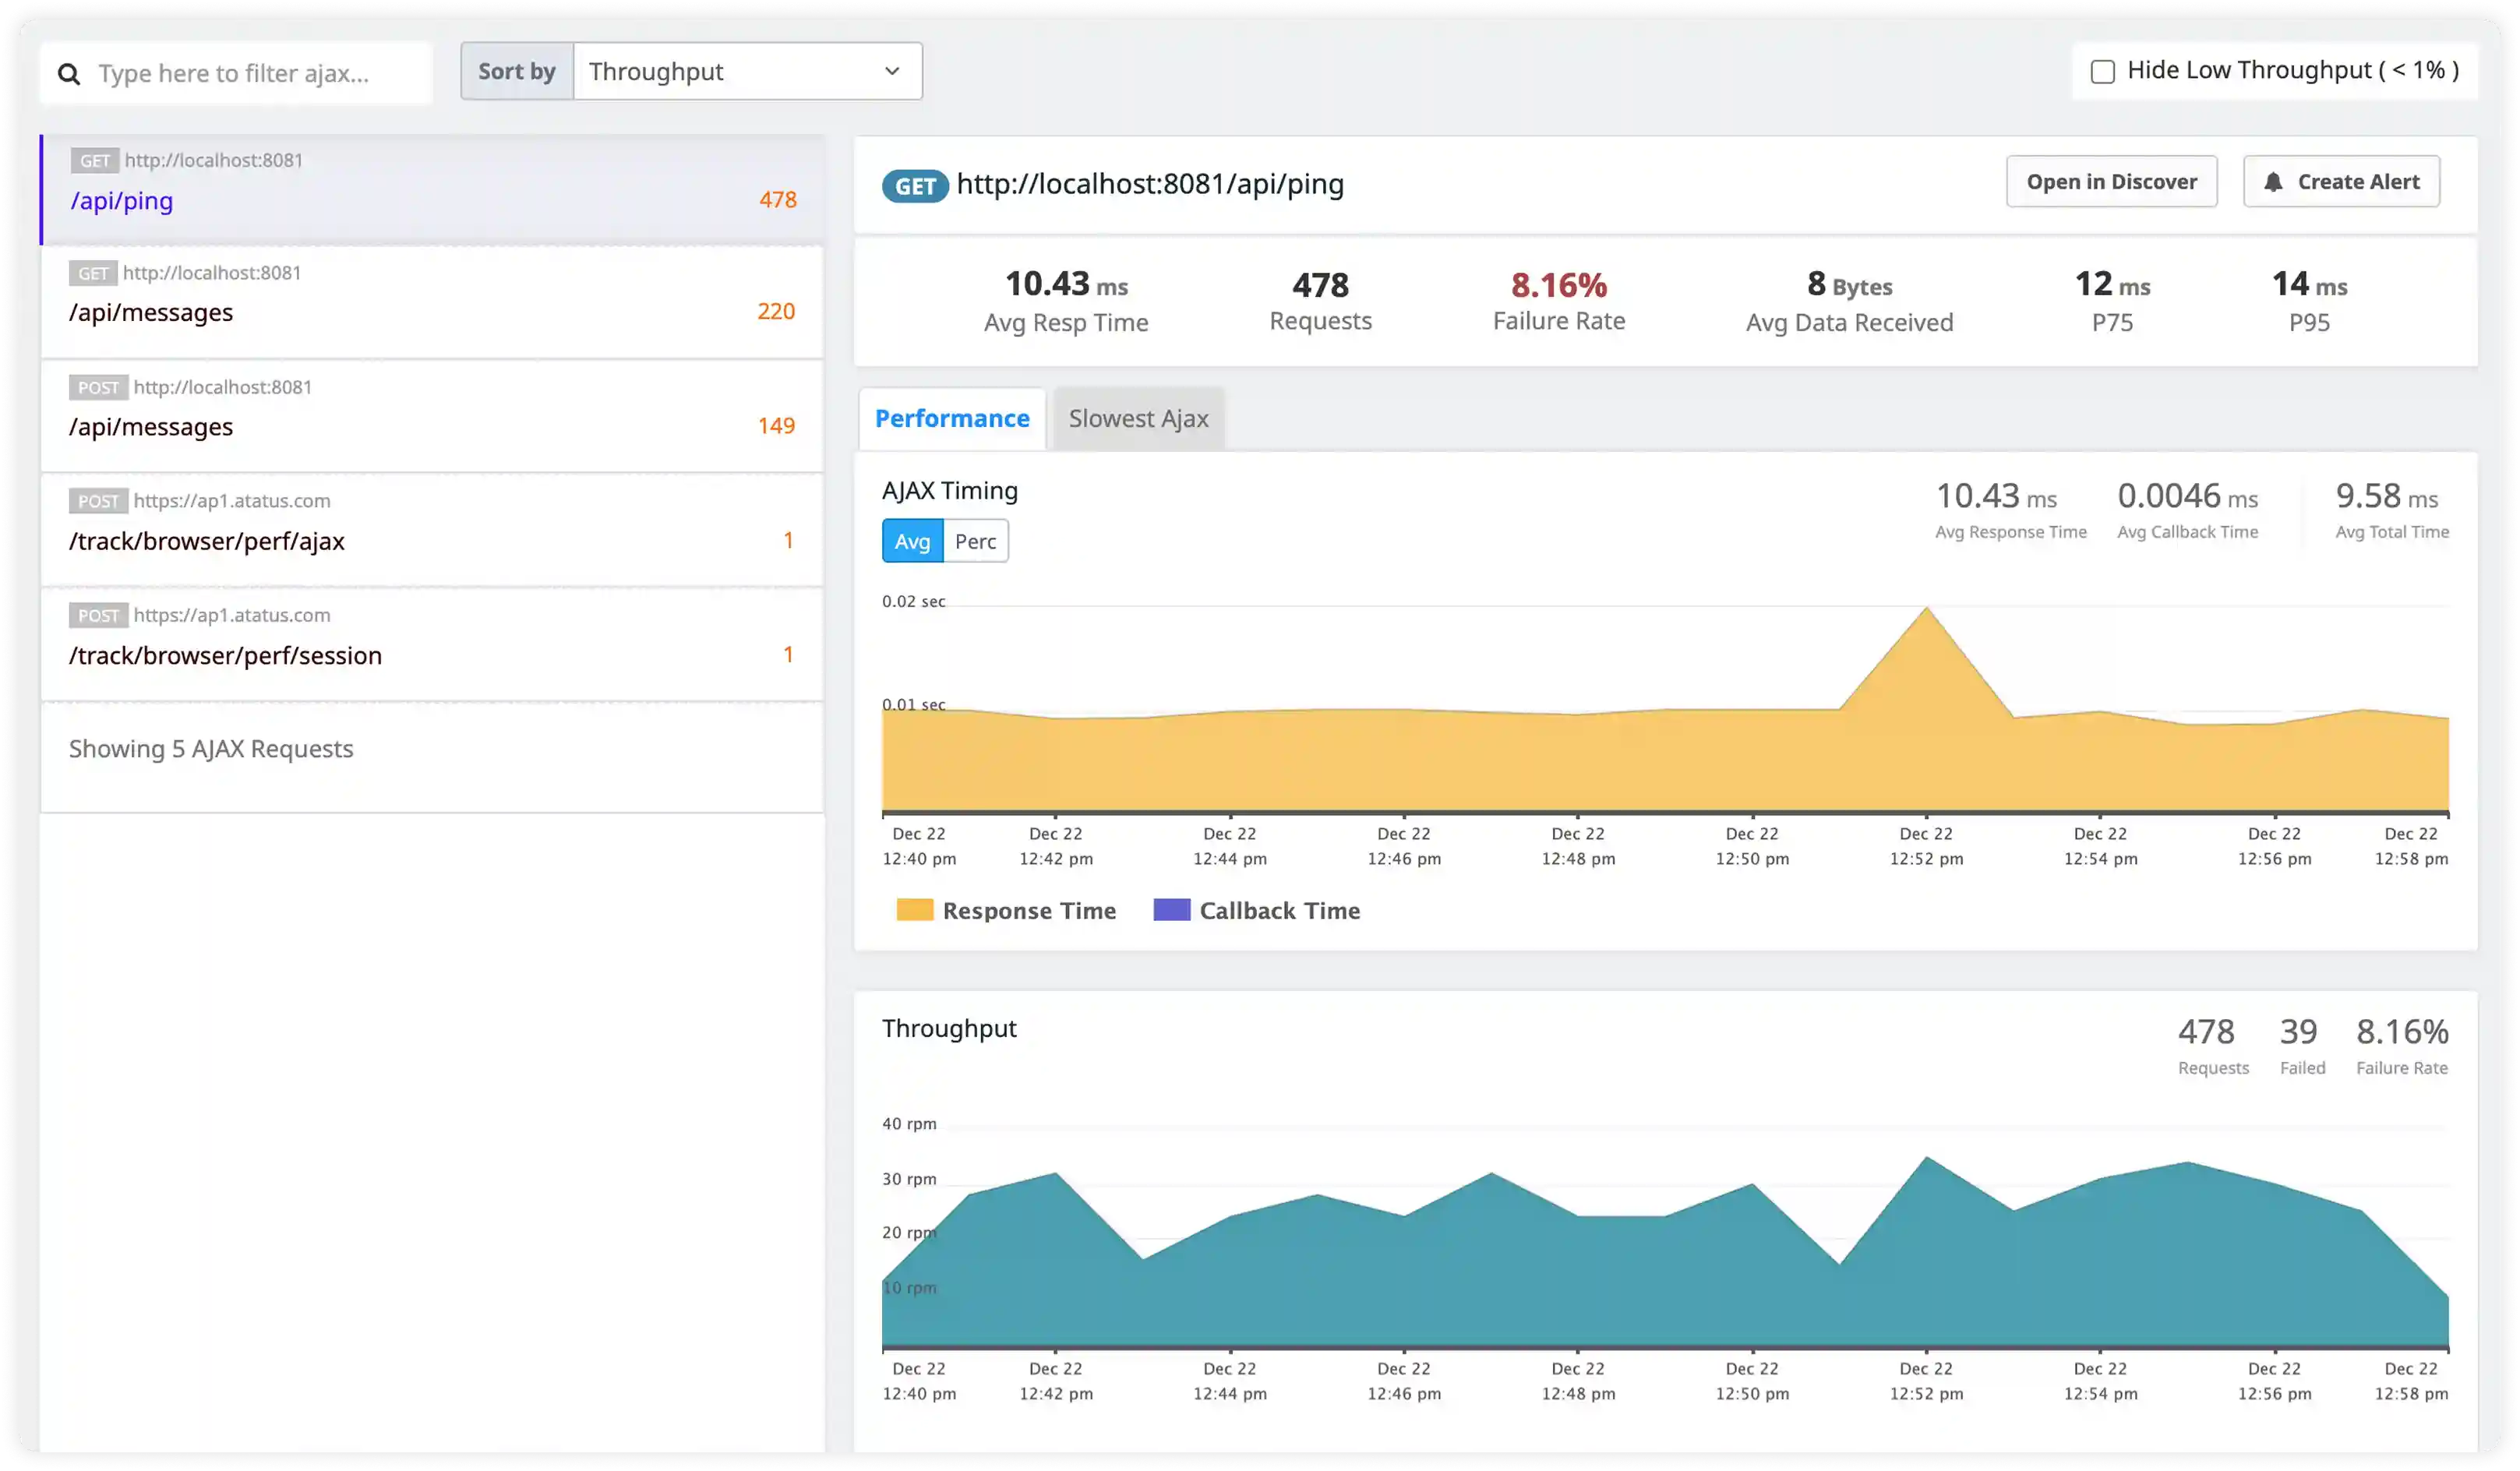
  • Real User Monitoring tracks every checkout API call to see failed payment requests, broken coupon codes, and slow inventory checks with exact error codes.
  • Error Tracking captures JavaScript errors breaking your checkout flow so you know which browser or device causes "Place Order" button failures.
  • Distributed Tracing follows orders across microservices to identify if delays come from your payment gateway, inventory service, or database.
  • Error Analytics shows which bugs cause the most cart abandonment so you can fix high-impact issues first.
Protect Your Revenue at the Point of Sale

Handle Peak Traffic Surges Without Downtime

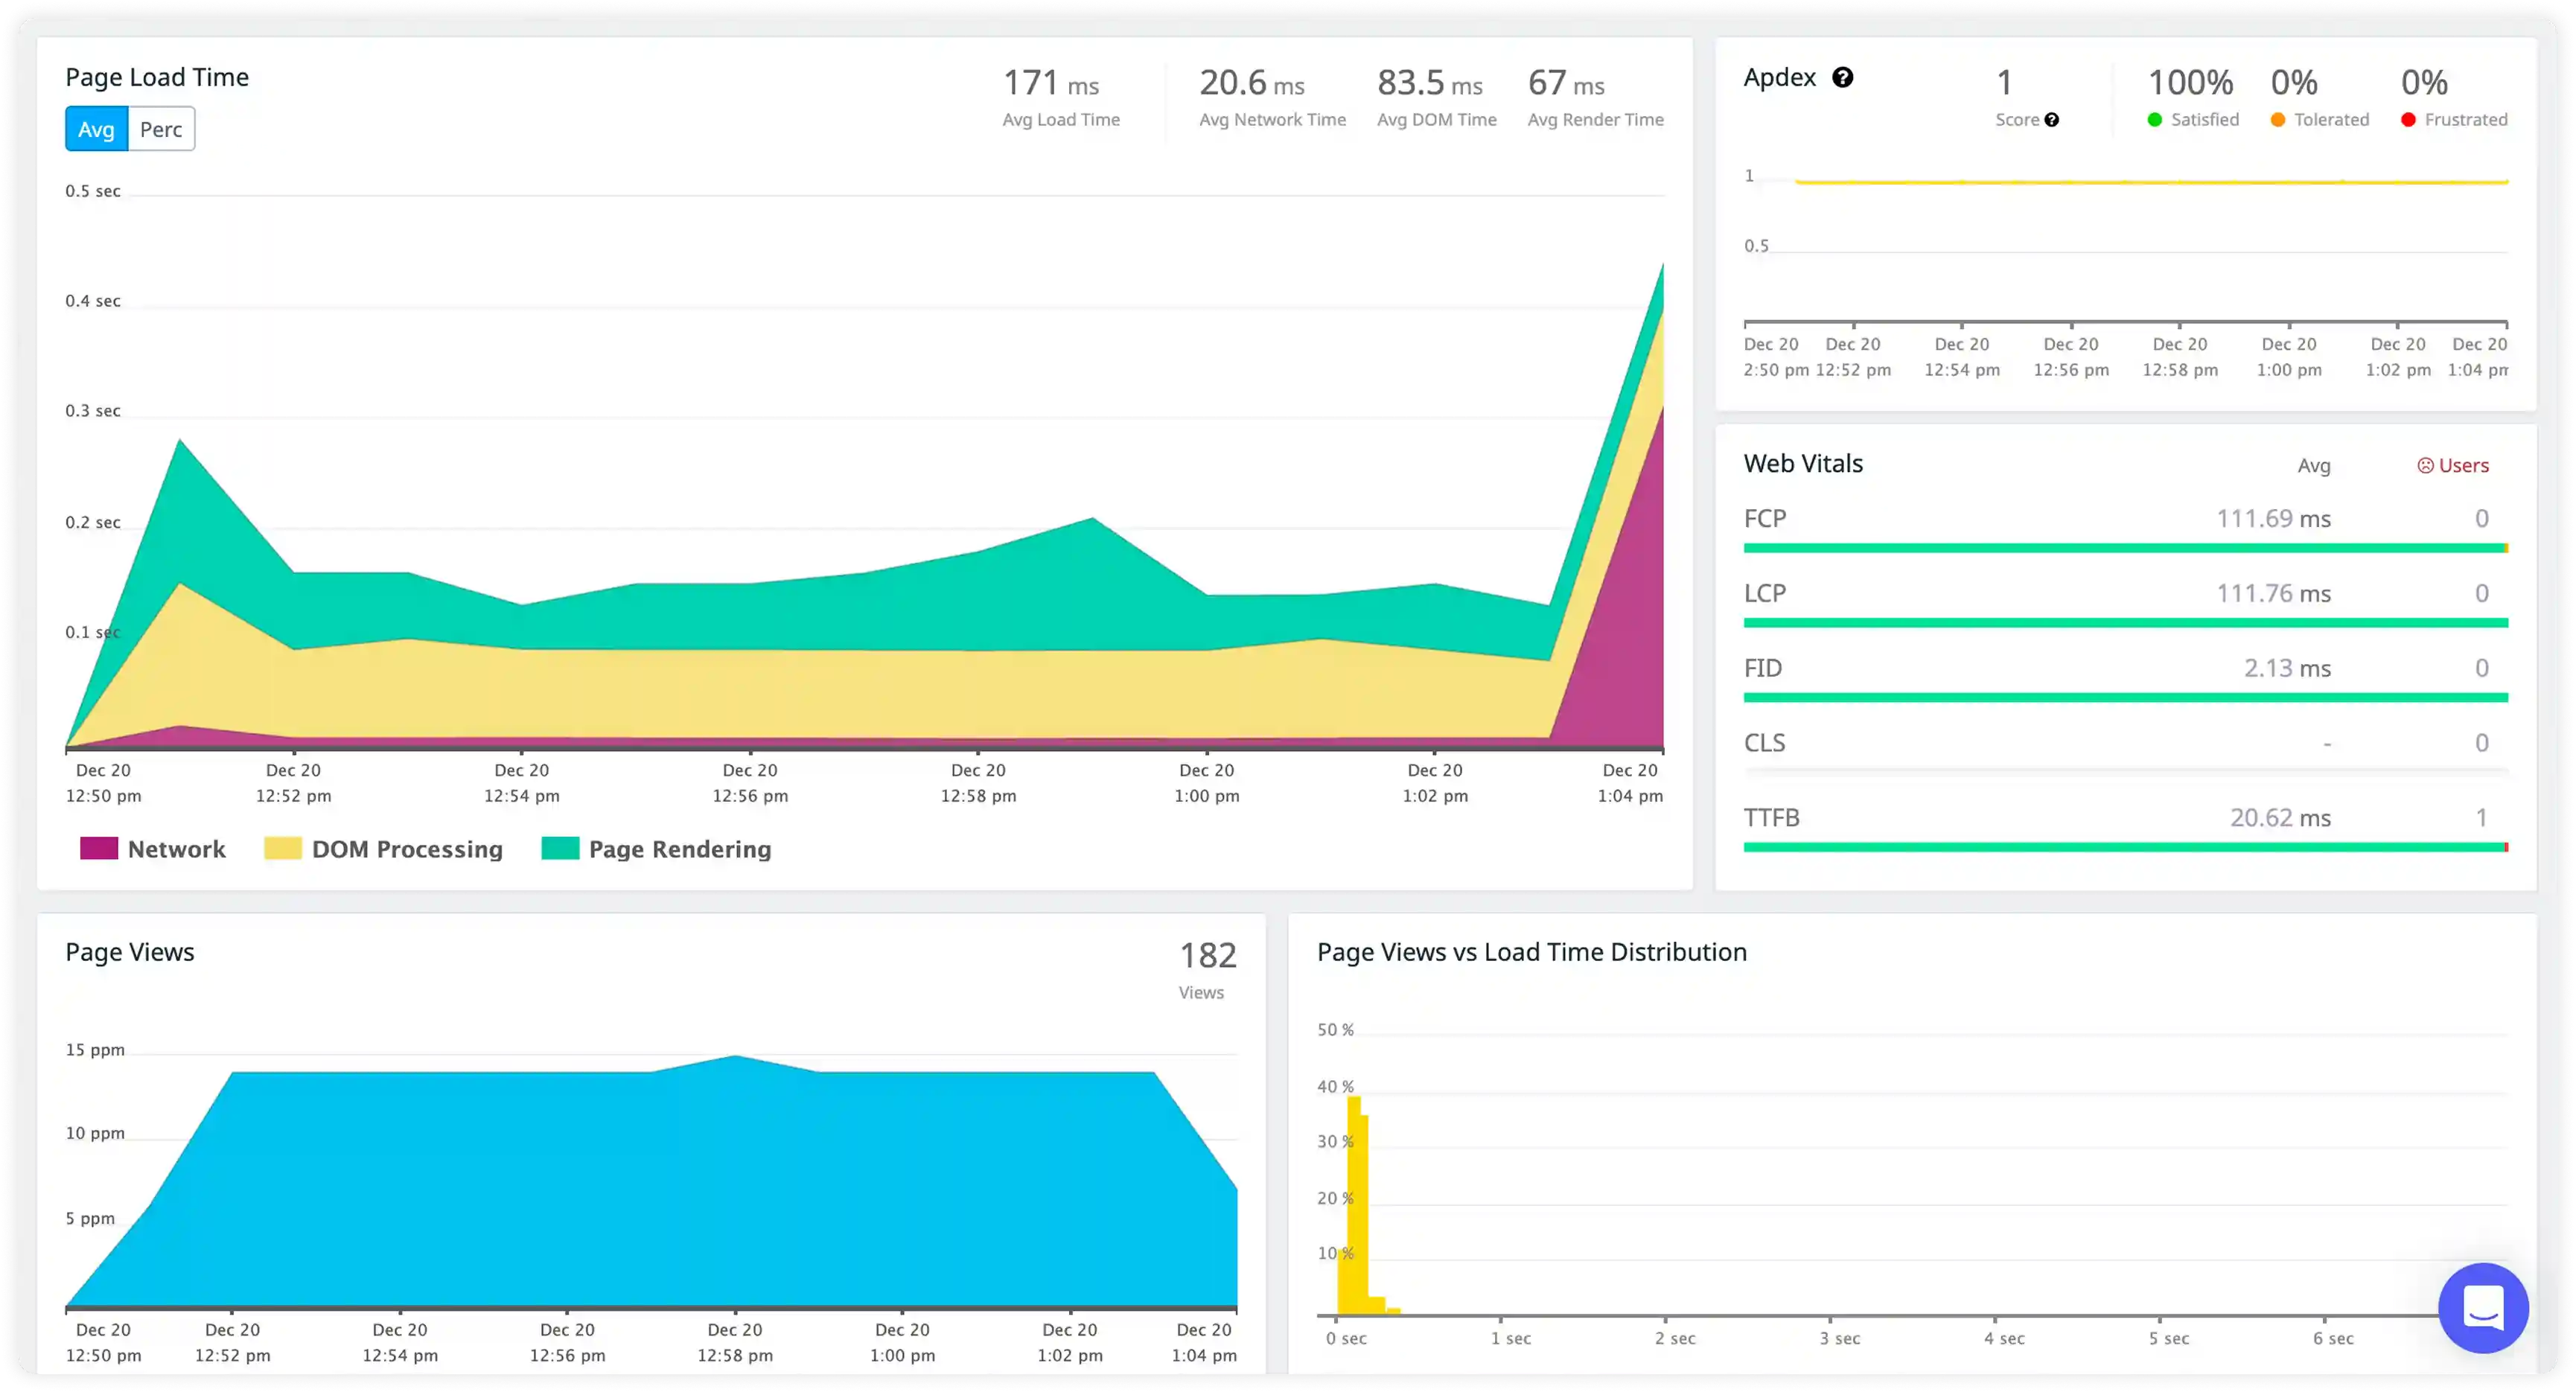
  • APM identifies slow database queries under load to catch N+1 queries before they crash during peak traffic.
  • Infrastructure Monitoring tracks CPU, memory, and disk usage in real-time with alerts when servers hit capacity limits.
  • External Requests Monitoring shows CDN and third-party API slowdowns to prove performance issues aren't your code.
  • Deployment Tracking links performance drops to code releases so you know if traffic or deployments caused the issue.
Handle Peak Traffic Surges Without Downtime

Improve Page Speed and Search Rankings

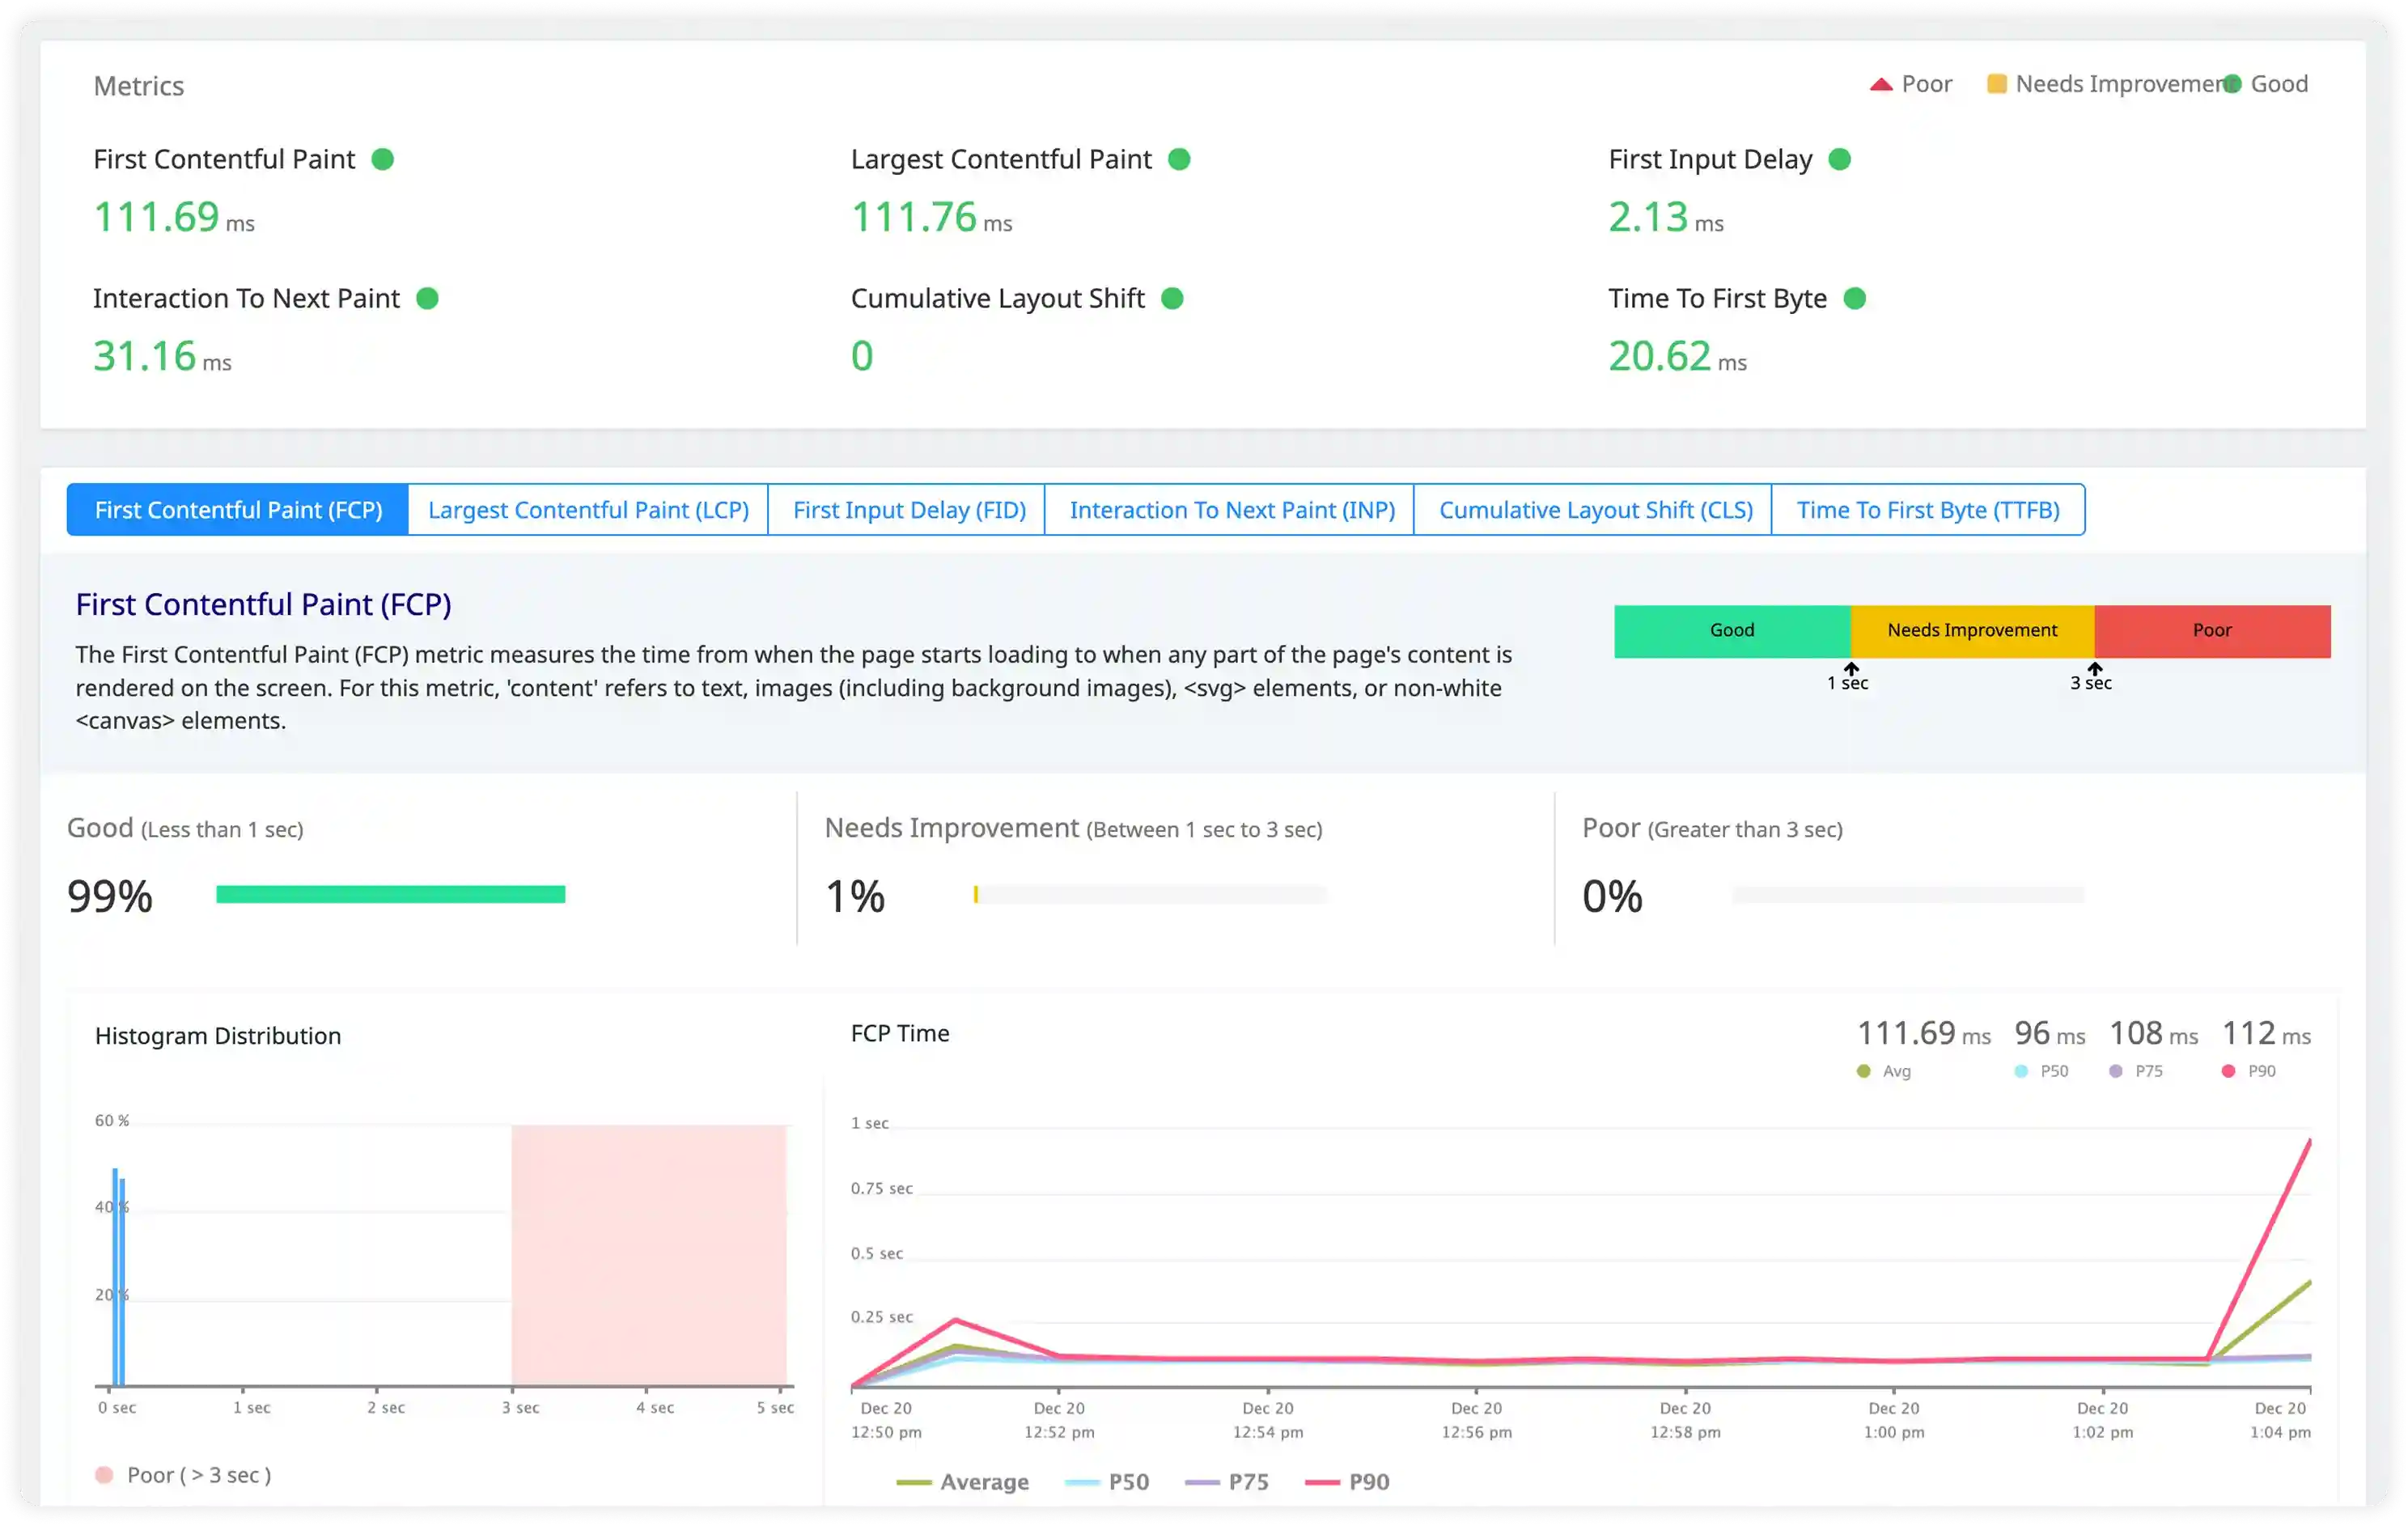
  • RUM measures Core Web Vitals (LCP, FID, CLS) to see which images or scripts hurt your Google rankings.
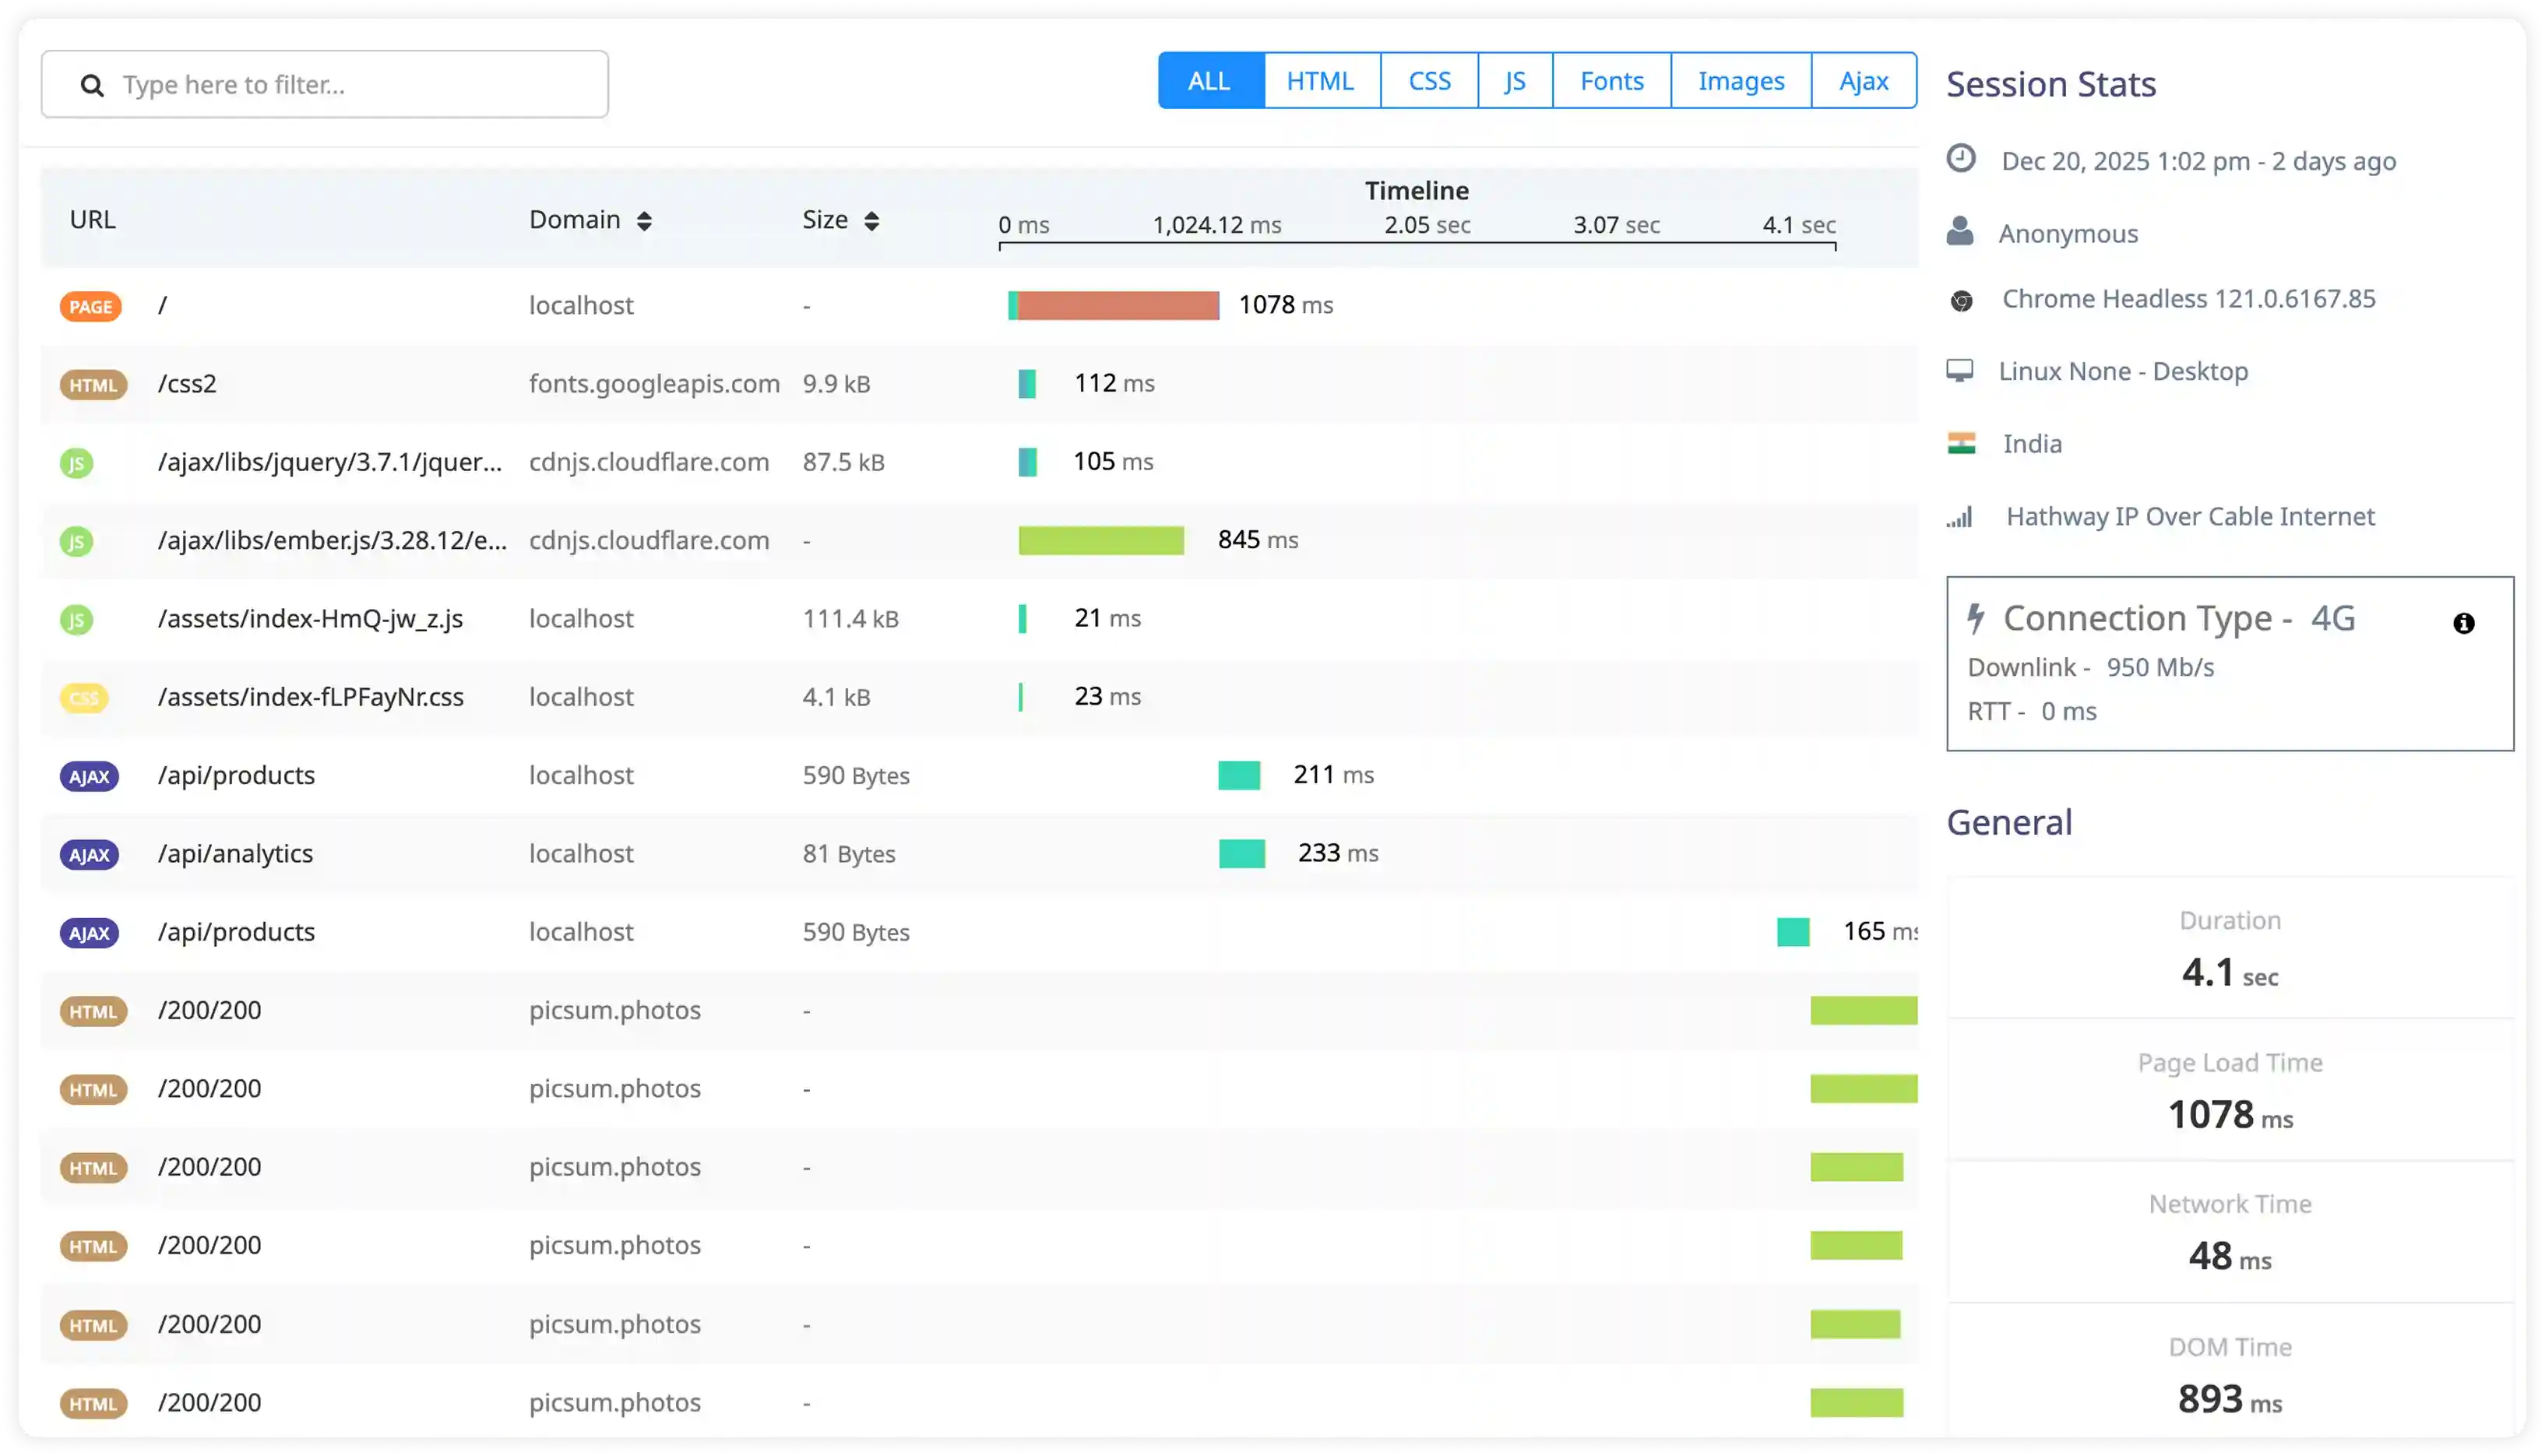
  • Resource Timing identifies render-blocking scripts to find third-party tags slowing down "Add to Cart" clicks.
  • Session Replay shows layout shifts so you can watch how late-loading ads frustrate users.
  • Custom Metrics prove ROI by correlating faster load times with lower bounce rates and higher conversions.
Improve Page Speed and Search Rankings

Monitor Third-Party Integrations and Payment Gateways

  • External Services Dashboard monitors Stripe, PayPal, and shipping APIs to track uptime and response times for all integrations.
  • Distributed Tracing shows error origins so you can see if checkout failures are your bug or their outage.
  • API Monitoring verifies SLA compliance to check if vendors meet their uptime promises.
  • Log correlation with trace IDs connects payment failures across services to diagnose issues faster.
Monitor Third-Party Integrations and Payment Gateways
Outcomes

How Atatus Transforms Your Operations

Measurable improvements across your DevOps workflows and business metrics

  1. 01

    Reduce Cart Abandonment by 40%

    40% reduction in cart abandonment

    Track every checkout step, identify slow database queries, failing payment APIs, and page load issues causing drop-offs.

    DevOps impact
    Pinpoint exact queries slowing checkout pages and external API failures in real-time
    Business impact
    Recover lost revenue by fixing friction points before customers abandon
  2. 02

    Handle 10x Traffic Spikes Without Crashes

    99.99% uptime during peak events

    Monitor server capacity, database performance, and API response times during peak sales events with historical data for capacity planning.

    DevOps impact
    Proactive alerts for capacity issues with auto-scaling insights from historical trends
    Business impact
    No revenue loss during critical sales periods like Black Friday
  3. 03

    Detect Issues Before Customers Do

    80% faster issue detection

    Real-time monitoring of product pages, search functionality, and checkout flow with instant alerts for performance degradation.

    DevOps impact
    Synthetic monitoring catches broken pages and slow APIs before they impact users
    Business impact
    Maintain brand reputation and customer trust with proactive issue resolution
Teams

Unified Observability for Every Engineering Team

Atatus adapts to how engineering teams work across development, operations, and reliability.

Customers

Powering better performance for modern teams

"Solid Product even better support." The integration path is incredibly simple/easy and the overall interface is very intuitive. That said, I had a handful of odd use cases that the support team was incredibly responsive in helping me work through.

Wes DSite Reliability Engineer
FAQ

Questions Engineers Ask Before Buying

Pricing, deployment, data and the agent. If something is missing, a person will answer it on a demo call.

  • Cart abandonment often happens due to slow page loads, payment processing delays, or unexpected errors during checkout. Atatus helps you identify the exact step where customers drop off by tracking each checkout stage with distributed tracing.

    We show you slow database queries loading shipping options, payment gateway timeouts, or third-party API failures that frustrate customers. With this visibility, you can fix bottlenecks before they cost you sales.

  • Use Atatus to monitor your infrastructure capacity and plan for traffic spikes:

    • Track historical traffic patterns from previous sales events to predict load
    • Monitor server CPU, memory, and database connections in real-time
    • Set up alerts when resources approach capacity limits before crashes occur
    • Use load testing data to determine your breaking points and scale proactively

    Our customers handle 10x normal traffic during peak events without downtime by planning with Atatus data.

  • Yes! Atatus shows you exactly what's slowing down your product pages:

    • Slow database queries fetching product data, reviews, or inventory
    • Unoptimized images that aren't properly cached or compressed
    • Third-party scripts (analytics, reviews, chat widgets) blocking page rendering
    • API calls to recommendation engines or pricing services taking too long

    You'll see Core Web Vitals metrics and can drill down into each slow element to fix it. Most customers reduce page load time by 40-60% after identifying issues with Atatus.

  • Atatus monitors all payment API calls (Stripe, PayPal, etc.) and alerts you when failures occur. You'll see:

    • Response times for each payment provider with trend analysis
    • Error rates and specific error codes from payment gateways
    • Which transactions failed with complete context (order amount, customer ID, timestamp)
    • Whether the issue is on your side (timeouts, network) or the provider's side

    This lets you quickly determine if you need to failover to a backup payment processor or contact your provider's support team.

  • Real User Monitoring (RUM) tracks actual customer experiences - you see exactly how real users experience your site including their device, location, and network speed. This shows you problems customers actually face.

    Synthetic Monitoring runs automated tests from different locations 24/7, even when you have no traffic. This catches issues proactively before customers encounter them.

    For e-commerce, you should use both: RUM to understand real customer pain points, and Synthetic to catch issues during off-hours or in regions you don't have many customers yet.

  • Yes! Atatus helps improve conversion by showing the connection between performance and business metrics:

    • Track how page load time correlates with bounce rate and conversion
    • Identify which slow pages in your funnel are causing the biggest drop-offs
    • See if mobile users have worse performance than desktop (common issue)
    • Monitor checkout flow completion rates and pinpoint friction points

    E-commerce customers typically see 20-40% conversion improvement after fixing performance issues identified by Atatus, because every second of delay reduces conversions significantly.

  • No - while Atatus provides deep technical insights for developers, business stakeholders can use pre-built dashboards showing:

    • Site uptime and availability
    • Page load speeds and performance trends
    • Conversion funnel completion rates
    • Revenue impact of performance issues

    Setup requires some technical work (installing monitoring code), but once configured, anyone can view dashboards and understand site health.

Get started

See the root cause first.

Start free and send your first trace with OpenTelemetry or the Atatus agents. APM, logs, RUM, infrastructure and SIEM, all on one timeline.

  • SaaS
  • On-premises
  • Hybrid
  • BYOC
  • No per-user pricing