Scrape Prometheus endpoints with one agent
The Atatus Infrastructure Agent reads any Prometheus-compatible endpoint, keeps the metrics you choose and stores them as custom metrics. Chart and alert on them next to your traces and logs.
Point at an endpoint. Keep what you need.
Type include and exclude globs and a namespace. Lines on the endpoint drop out as you type.
- http_requests_total{code="200",handler="/api/checkout"} 184220
- http_requests_total{code="500",handler="/api/checkout"} 312
- http_request_duration_seconds_bucket{le="0.25"} 9812
- http_request_duration_seconds_sum 2104.7
- http_request_duration_seconds_count 10124
- process_cpu_seconds_total 3412.4
- process_resident_memory_bytes 1.95e+08
- go_goroutines 212
- go_gc_duration_seconds{quantile="0.5"} 0.0014
- checkout.http_requests_totalstored
- checkout.http_request_duration_seconds_bucketstored
- checkout.http_request_duration_seconds_sumstored
- checkout.http_request_duration_seconds_countstored
- process_cpu_seconds_totalfiltered
- process_resident_memory_bytesfiltered
- go_goroutinesfiltered
- go_gc_duration_secondsfiltered
- hosts: ["localhost:9090"] metrics_path: /metrics enabled: true namespace: checkout metrics_filters: include: ["http_*"]
Sample endpoint · separate several globs with commas
Pick the endpoints. Check them first.
Your app, RabbitMQ and CockroachDB all expose Prometheus metrics. Add each one as an entry and curl it to see what the agent will read.
- hosts: ["localhost:9090"] metrics_path: /metrics enabled: true namespace: checkout- hosts: ["localhost:15692"] metrics_path: /metrics enabled: true namespace: rabbitmq
- Nothing to installBundled with the Atatus Infrastructure Agent
- Agent 4.0.0 or laterLinux and Windows
- Custom metricsEvery kept metric, ready to chart and alert on
- Then restart
sudo service atatus-infra-agent restart
Every scraped metric, typed and tagged.
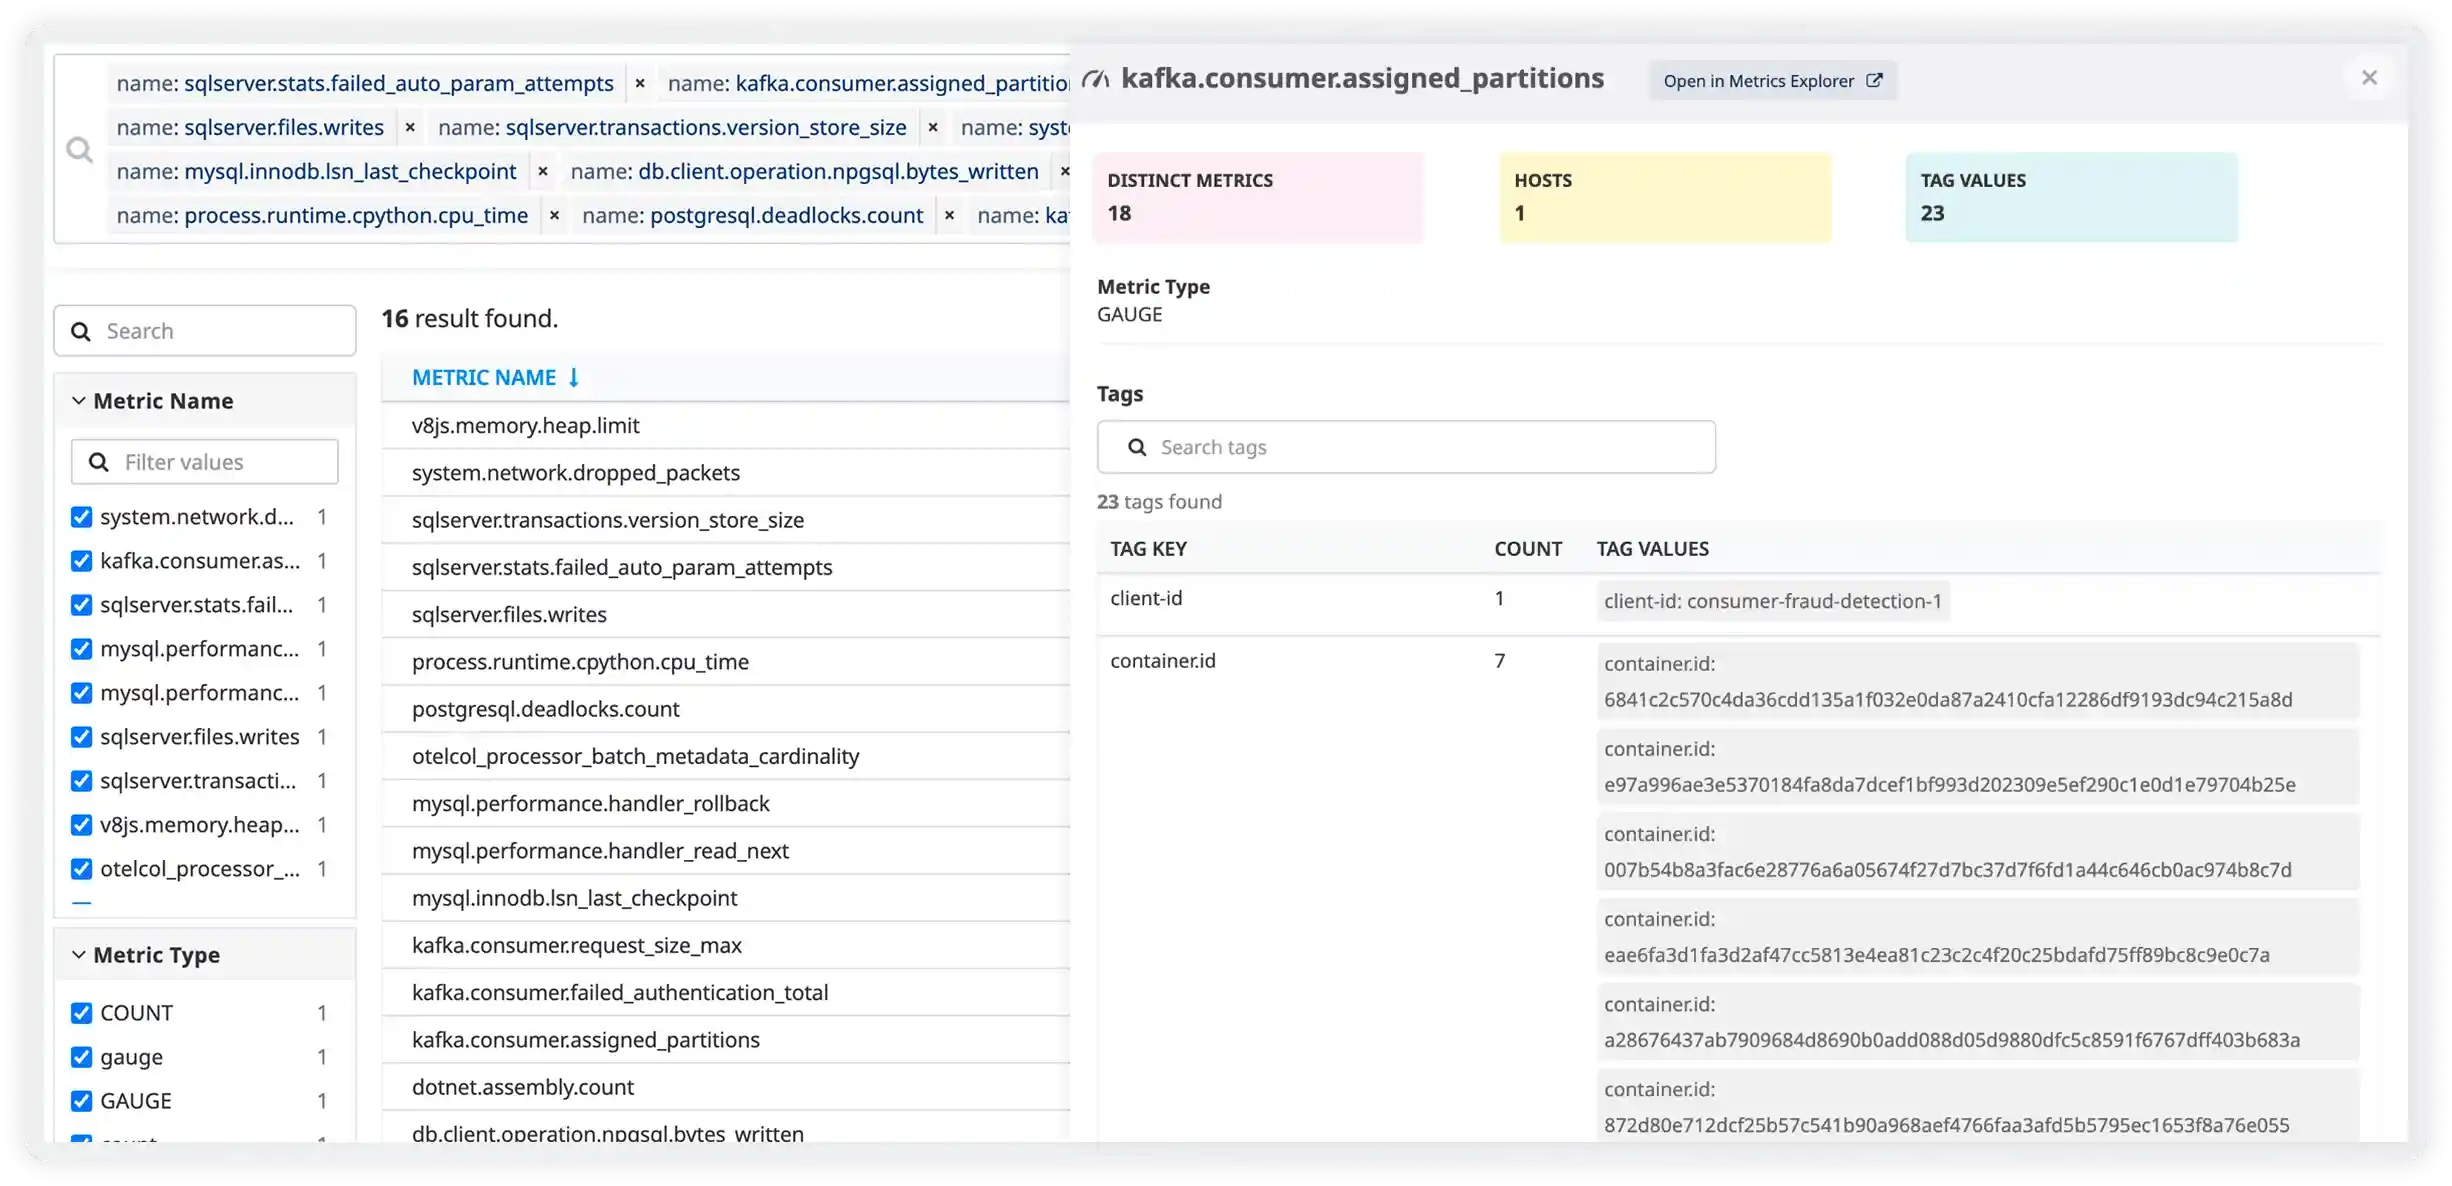
Scraped metrics sit with every other metric in Metrics. Open one to see its hosts and tags.
Questions about Prometheus monitoring
Pricing, deployment, data and the agent. If something is missing, a person will answer it on a demo call.
Yes. The Atatus Infrastructure Agent scrapes any endpoint that exposes metrics in the Prometheus format, such as your app's /metrics, the RabbitMQ Prometheus plugin or CockroachDB's /_status/vars. Your exporters and endpoints stay as they are.
Nothing new to install: the Prometheus integration is bundled with the Atatus Infrastructure Agent 4.0.0 or later on Linux and Windows. Add hosts, metrics_path and namespace to /etc/atatus-infra-agent/conf.d/prometheus.d/prometheus.yaml, then restart the agent with sudo service atatus-infra-agent restart.
As custom metrics. The namespace you set is added as a prefix to every metric name, so metrics from your app, RabbitMQ and CockroachDB stay apart. You can chart them and alert on them like any other metric in Atatus.
Yes. Each entry in prometheus.yaml has its own hosts list, metrics_path, namespace and filters, so one agent can scrape your apps and services side by side.
Yes. Set metrics_filters with include and exclude name patterns, for example include http_* or exclude go_*. Only matching metrics are stored, which keeps your custom metric volume down.
Run curl against the endpoint before you add it, for example curl http://localhost:15692/metrics for RabbitMQ or curl http://localhost:8080/_status/vars for CockroachDB. What that returns in the Prometheus format is what the agent scrapes.