Comprehensive Azure coverage
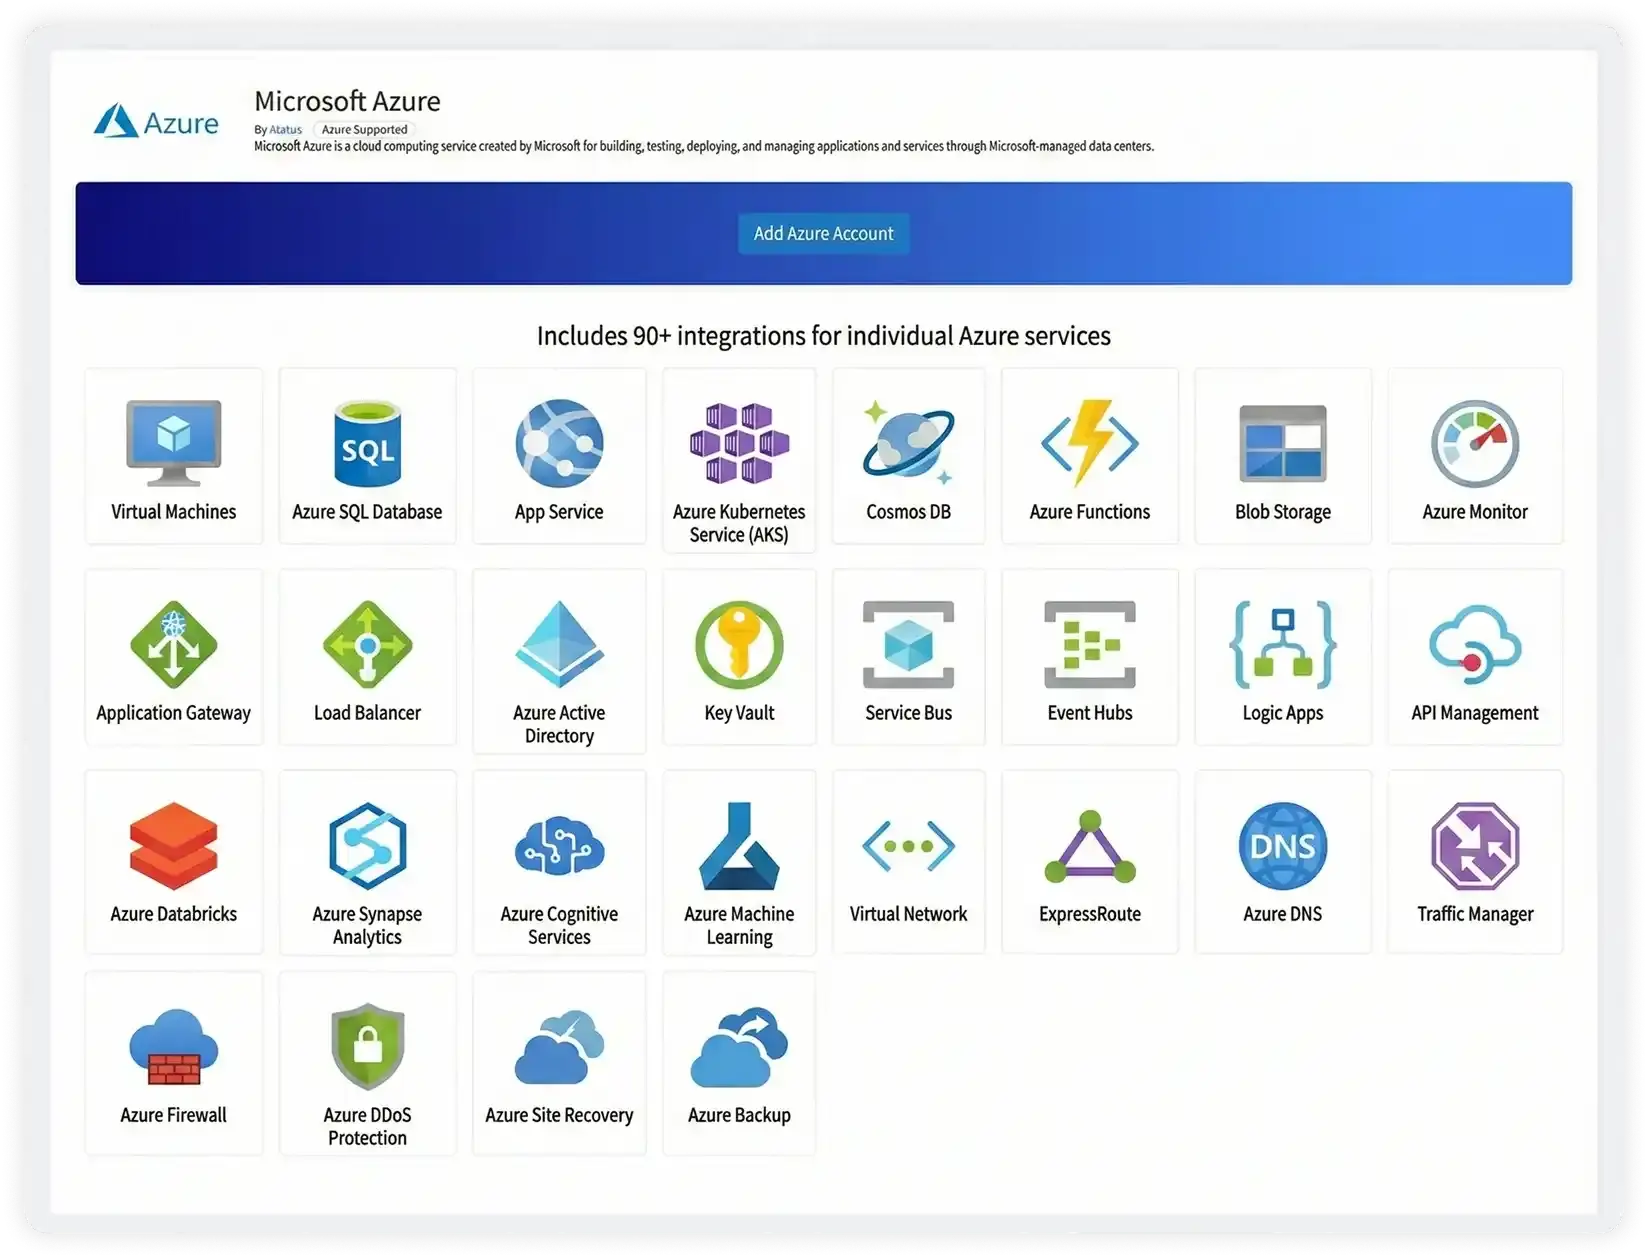
Observe workloads running on Virtual Machines, App Services, AKS, Functions, Storage, and networking services.
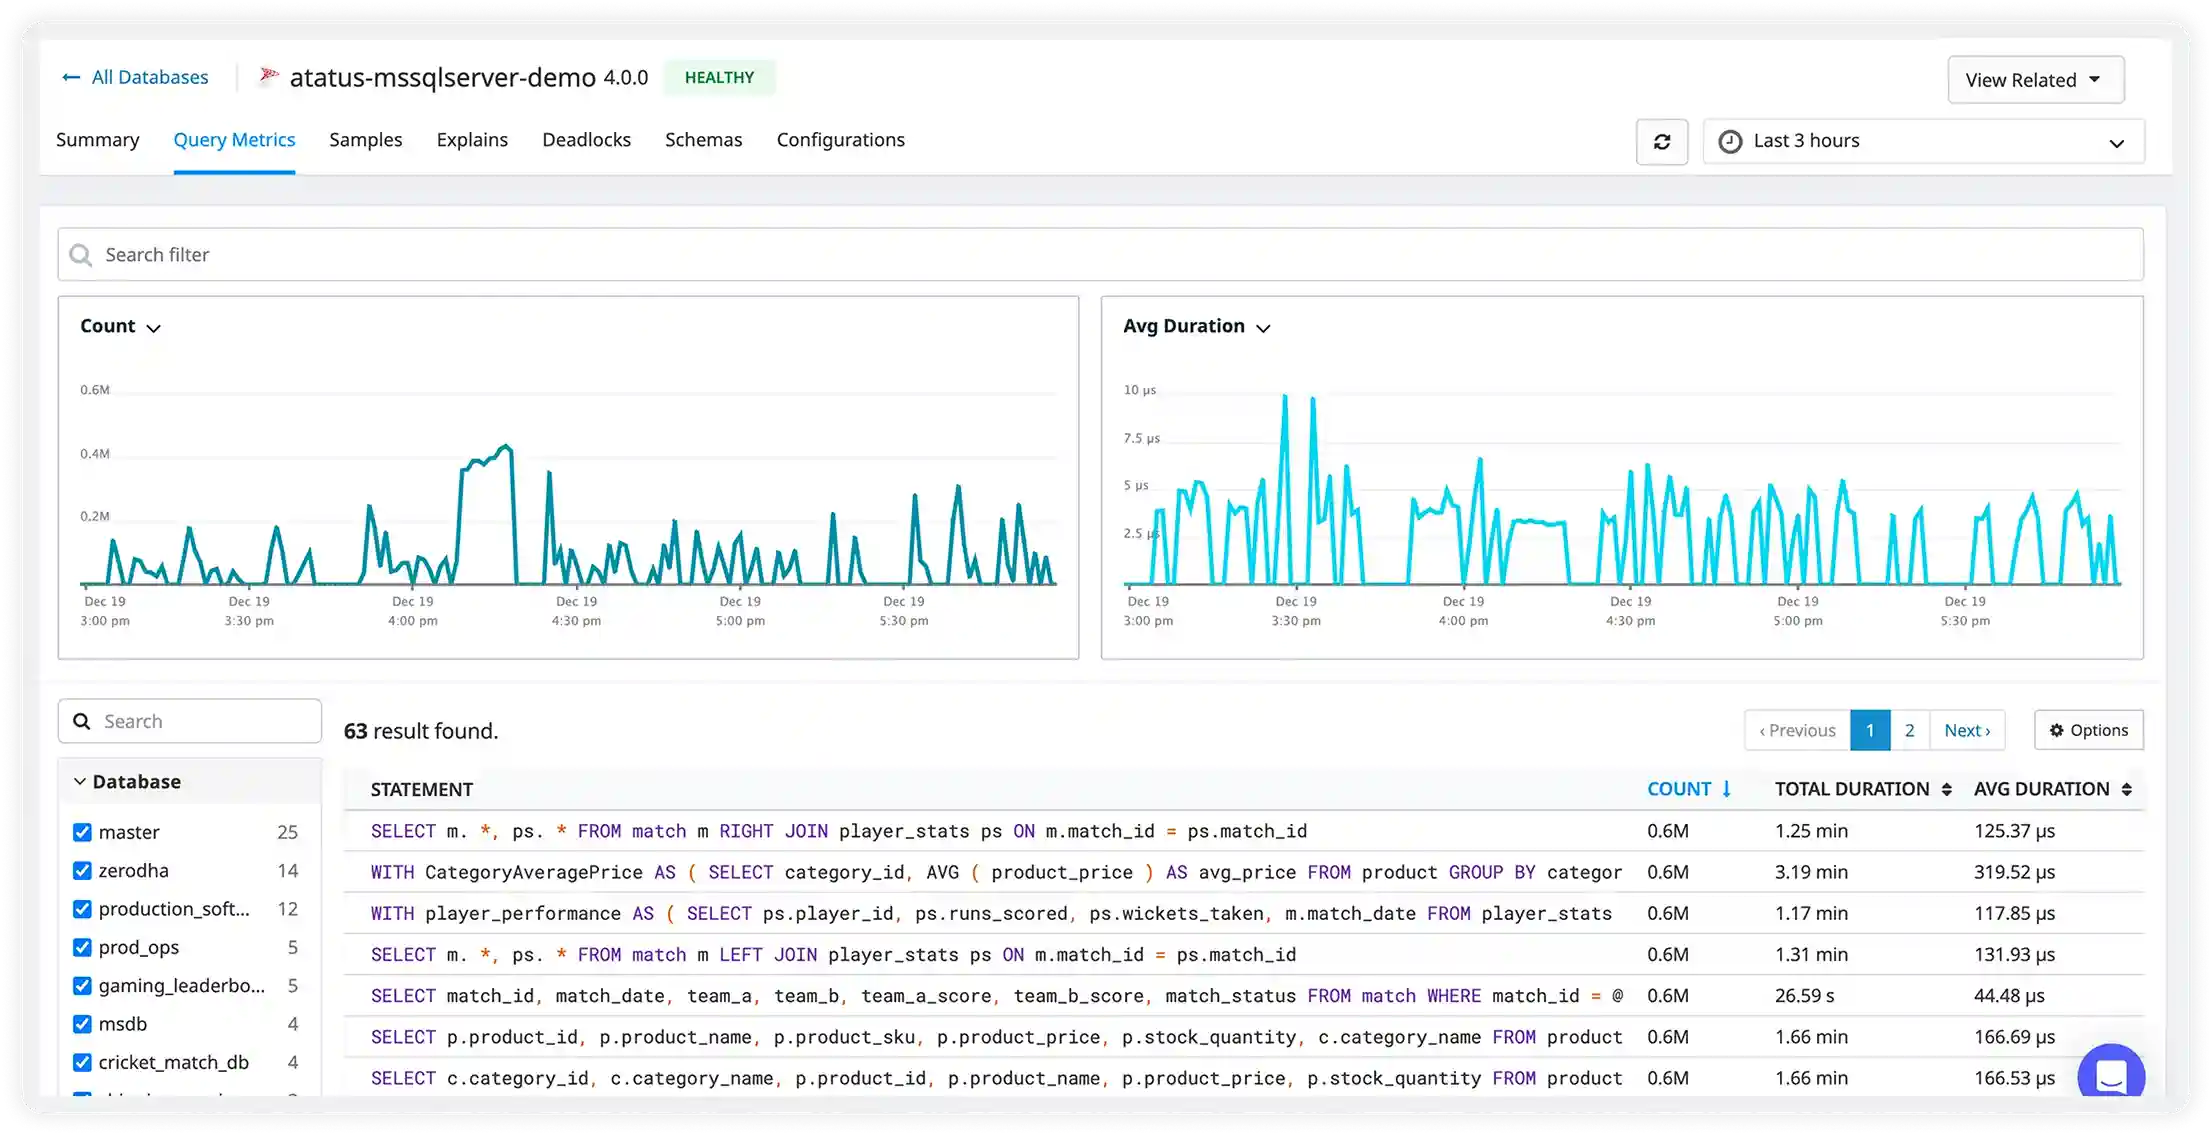
Get comprehensive visibility into your Azure infrastructure including Virtual Machines, App Services, Azure Functions, and Kubernetes. Monitor performance, availability, and costs across your Azure environment with unified dashboards and proactive alerting.
Observe workloads running on Virtual Machines, App Services, AKS, Functions, Storage, and networking services.
Track pod, node, and service behavior inside AKS clusters with application context intact.
Maintain visibility into Azure Functions where instances scale dynamically and execution is short-lived.
Follow requests across gateways, application services, background workers, and databases.
Interpret CPU, memory, and network metrics based on real application demand.
Investigate issues using a single timeline that correlates logs, metrics, and traces.
Retain consistent visibility as subscriptions, services, and regions expand.
Provide platform, SRE, and backend teams a shared operational understanding of production.
Azure teams choose Atatus for consistent observability across managed platforms, virtualized compute, and distributed services.
Atatus maps naturally to how Azure services are deployed and operated in production.
Engineers can trace behavior across services without manual correlation.
Visibility persists as Azure resources scale and rebalance under load.
Teams reach root cause faster with coherent production context.
Developers and SREs gain value quickly without deep platform rework.
Teams deploy and scale knowing production behavior remains visible.
Atatus adapts to how engineering teams work across development, operations, and reliability.
Debug errors and slow paths with the full context of what happened.
Atatus for developersTrack deployments and see how each release affects stability.
Atatus for DevOpsWatch latency and error rates to ship with less production risk.
Atatus for release engineers"Solid Product even better support." The integration path is incredibly simple/easy and the overall interface is very intuitive. That said, I had a handful of odd use cases that the support team was incredibly responsive in helping me work through.
Pricing, deployment, data and the agent. If something is missing, a person will answer it on a demo call.
Atatus provides comprehensive monitoring for all major Azure services including:
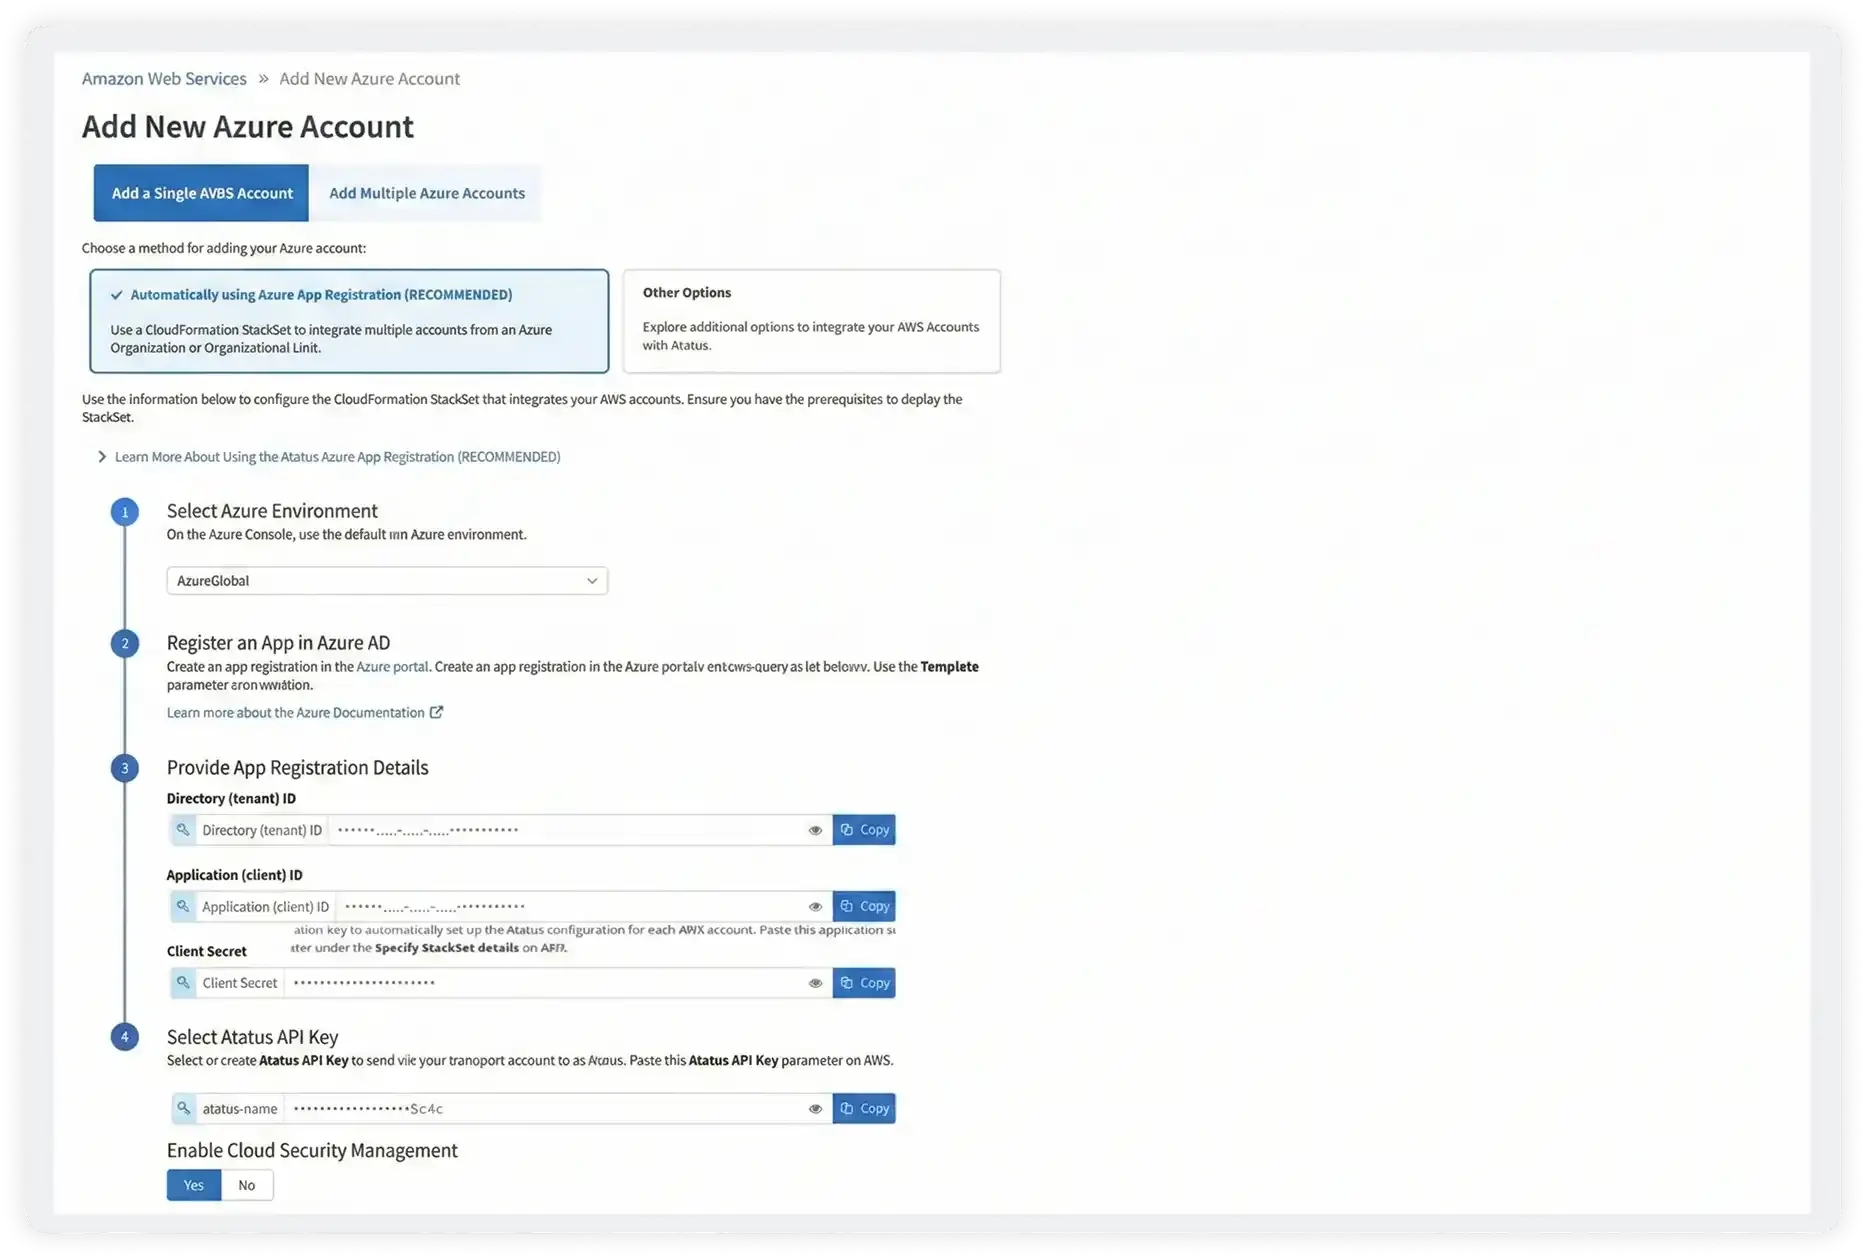
Atatus integrates with Azure through Azure Monitor metrics collection via service principals, direct agent installation on VMs, Azure Functions extensions, and OpenTelemetry collectors for AKS.
Deploy in minutes using our ARM templates or Terraform modules. Atatus automatically discovers Azure resources and begins monitoring without manual configuration.
Yes, Atatus can monitor Azure AD authentication flows, sign-in latency, and failed authentication attempts. Track conditional access policy impacts and identify authentication bottlenecks.
Get alerts on unusual sign-in patterns, track MFA enrollment rates, and monitor B2C/B2B authentication for customer-facing applications.
Atatus provides detailed Azure Functions monitoring including execution time, memory usage, trigger counts, and dependency calls. Track cold starts separately from warm invocations.
Distributed tracing shows the complete request flow through your Functions, including calls to databases, storage, and external APIs. Identify slow dependencies and optimize function execution.
Yes, Atatus supports hybrid monitoring across Azure cloud and Azure Stack or on-premises infrastructure. See all resources in a unified dashboard regardless of where they're deployed.
Monitor Azure Arc-enabled servers, track data synchronization between cloud and on-premises, and get consistent alerting across your entire hybrid environment.
Yes, Atatus provides comprehensive Kubernetes monitoring for AKS clusters. Track node pools, pod scheduling, horizontal pod autoscaling, and application-level metrics.
Integrate with Azure Container Registry to track image pull times and vulnerabilities. Monitor ingress controllers, service mesh performance, and cross-cluster communication.
Start free and send your first trace with OpenTelemetry or the Atatus agents. APM, logs, RUM, infrastructure and SIEM, all on one timeline.