Real-Time Error Tracking
Catch every exception the moment it happens. Full stack traces, user context, environment metadata, and smart grouping out of the box.
Real-time insights into errors, distributed traces, and performance bottlenecks. Unified in one workflow to diagnose production issues with clarity.
Atatus pins every deployment directly to your error rates, latency, and service health. The moment code hits production, you see its impact, not 20 minutes later when support tickets arrive.
Unclear Error Origins Your PR passed all tests, deployed clean, then customers hit a 500 error you've never seen before. No stack trace, no breadcrumb, no clue where it started.
Tool Sprawl Errors in Sentry, logs in CloudWatch, traces in Jaeger, metrics in Grafana. You're not debugging, you're tab managing across four dashboards simultaneously.
Distributed System Debugging A request hits your API gateway, travels through 4 microservices, then fails somewhere in the middle. Tracing that manually across services takes hours, not minutes.
Zero Production Visibility By the time you find out something is broken, the error's been live for 20 minutes and users have already opened support tickets. You're always reacting, never anticipating.
Atatus plugs into your local environment and CI/CD pipeline, so issues surface before users ever see them, not after.
Atatus correlates each deployment with live error rates, latency, and Apdex the moment code hits production. No more waiting for support tickets to know if something broke.
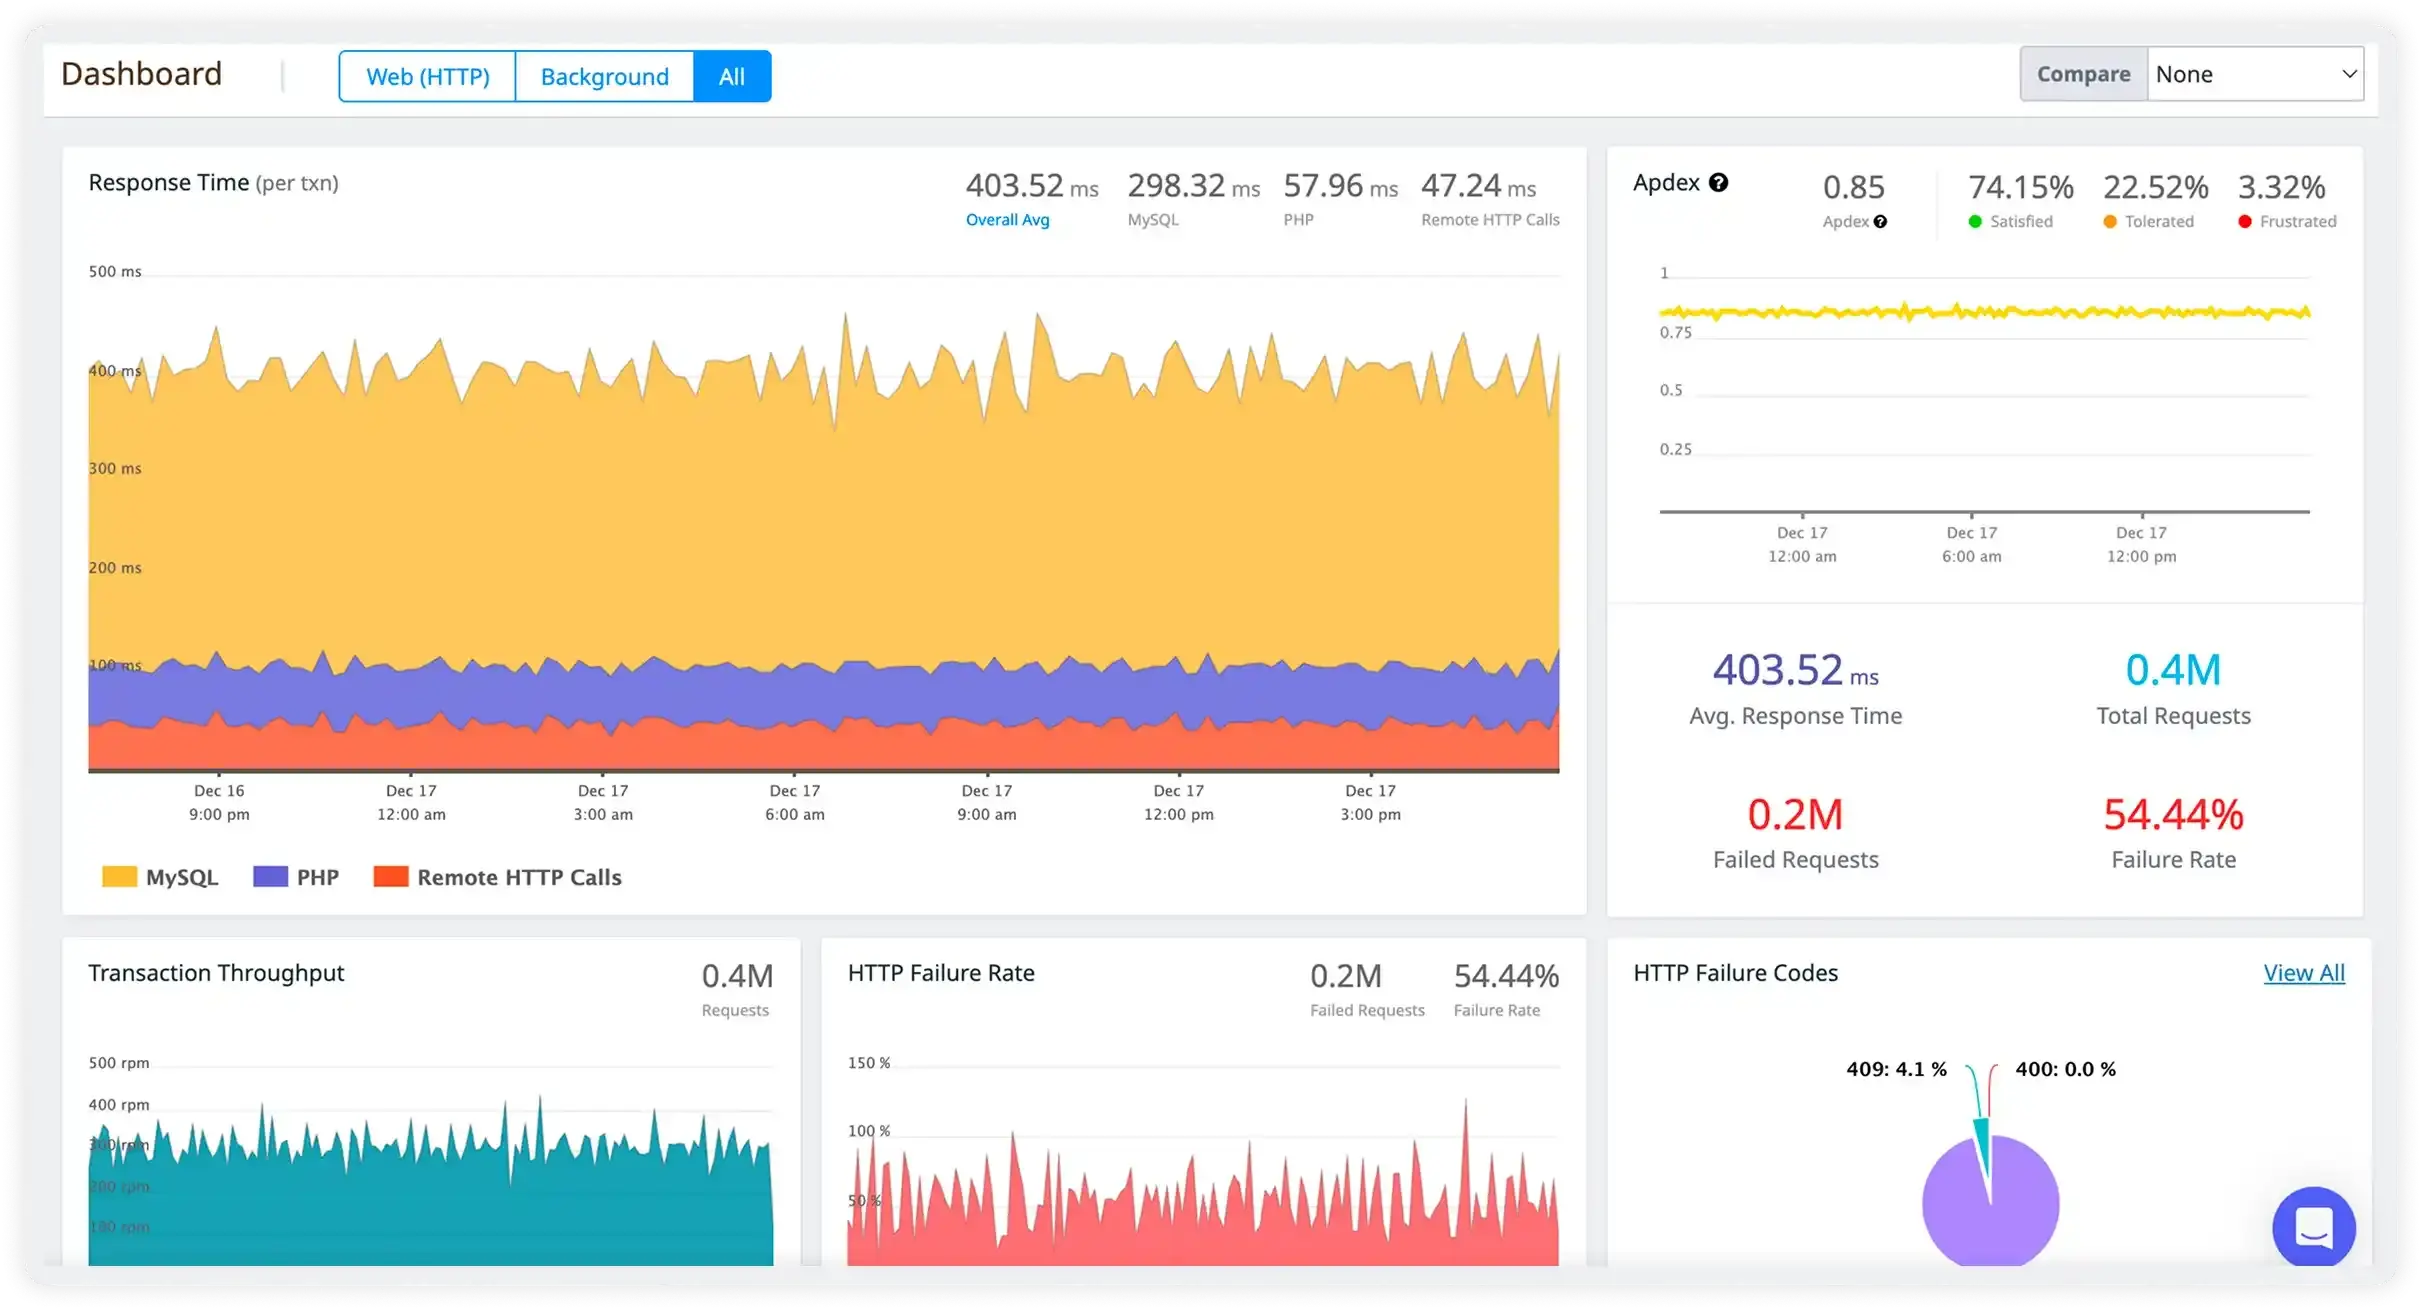
Other tools tell you something broke. Atatus shows you what broke, which deploy caused it, and where in your code to fix it without switching tabs.
Get started in minutes with auto-instrumentation for your stack. No manual setup, no complex configs. Install the SDK and start seeing data right away.
Built to be lightweight in production. Collect the data you need without impacting application performance or increasing latency.
Detect spikes in errors, latency, and throughput automatically. Alerts are based on real patterns, so you're notified when something actually needs attention.
Transparent pricing with clear usage limits. No hidden charges or surprise bills as your usage grows.
Catch every exception the moment it happens. Full stack traces, user context, environment metadata, and smart grouping out of the box.
Follow a request across every service, database call, and external API. Visualize latency waterfalls and pinpoint exactly where time is lost.
Track response times, throughput, and error rates across every endpoint. P95/P99 latencies, apdex scores, and slow transaction profiling.
Logs aren't isolated anymore. Every log line is correlated with the trace and error that generated it. Search, filter, and stream in real time.
Every deployment is marked on your performance timeline. See exactly which release introduced a regression before customers do.
Anomaly-based alerts that learn your baseline. Get paged when it matters, not every time a metric twitches. Slack, PagerDuty, and webhooks built in.
Get alerted instantly with full context. Error message, stack trace, affected users, related deployments, and correlated logs in one view. No more Slack ping archaeology.
Track error rates, performance regressions, and new issues per release. Understand which PRs introduce problems and measure quality trends over time.
Stop the context-switching tax. Everything you need to understand what happened is already correlated. From alert to fix in minutes, not hours.
Watch your release roll out in real time. Canary deployments, error rate comparisons between versions, and automated rollback triggers if things go wrong.
Atatus adapts to how engineering teams work across development, operations, and reliability.
Debug errors and slow paths with the full context of what happened.
Atatus for developersTrack deployments and see how each release affects stability.
Atatus for DevOpsWatch latency and error rates to ship with less production risk.
Atatus for release engineers"Solid Product even better support." The integration path is incredibly simple/easy and the overall interface is very intuitive. That said, I had a handful of odd use cases that the support team was incredibly responsive in helping me work through.
Pricing, deployment, data and the agent. If something is missing, a person will answer it on a demo call.
Yes. Atatus combines error tracking, logs, traces, and metrics in one platform, so developers can move from issue to root cause without switching tools or losing context.
Most teams get started in under 10 minutes. With simple SDK setup or auto-instrumentation, you can begin capturing real production data almost immediately.
Yes. Atatus automatically connects errors, traces, and logs, so developers don't waste time jumping between tools and can identify root causes much faster.
Some benefits include:Yes. Atatus links every deployment with performance changes and errors, making it easy to spot regressions and take action quickly.
Yes. It fits naturally into how developers debug issues, making it a go-to tool during incidents, releases, and performance troubleshooting.
No. Atatus integrates with modern stacks and supports quick setup, allowing teams to migrate gradually without disrupting existing workflows.
Teams typically see faster resolution times, fewer production issues, and reduced costs by consolidating multiple observability tools into one platform.
Start free and send your first trace with OpenTelemetry or the Atatus agents. APM, logs, RUM, infrastructure and SIEM, all on one timeline.