Missing Context
Symfony requests traverse controllers, middleware, services, and async boundaries. When failures appear, teams lack execution context to understand what actually happened within a single request lifecycle.
Get end-to-end visibility into your Symfony performance with application monitoring tools. Gain insightful metrics on performance bottlenecks with PHP monitoring to optimize your application.
Symfony requests traverse controllers, middleware, services, and async boundaries. When failures appear, teams lack execution context to understand what actually happened within a single request lifecycle.
Incidents demand answers in minutes, but Symfony stacks generate fragmented signals. Engineers jump between logs, metrics, and traces, extending mean time to understanding instead of fixing.
Symfony encourages modular design, but production behavior reveals tight coupling between services, workers, and third-party dependencies that are invisible during development.
Queues, background workers, and scheduled jobs run outside normal request flows. When they stall or fail, teams struggle to connect them back to triggering user actions.
Traffic spikes, batch jobs, and cron bursts expose performance cliffs that never appeared in staging. Capacity assumptions break without warning.
One misbehaving endpoint can generate thousands of downstream failures. Without aggregation and correlation, teams drown in noise instead of identifying the real trigger.
Deployments introduce subtle behavioral shifts. Without production-grade visibility, teams cannot confidently separate code regressions from infrastructure side effects.
Platform, SRE, and backend teams see different symptoms of the same issue. Lacking a shared operational view, accountability becomes unclear during incidents.
End-to-end observability for Symfony that helps teams understand runtime behavior, optimize application performance, and maintain reliable production systems.
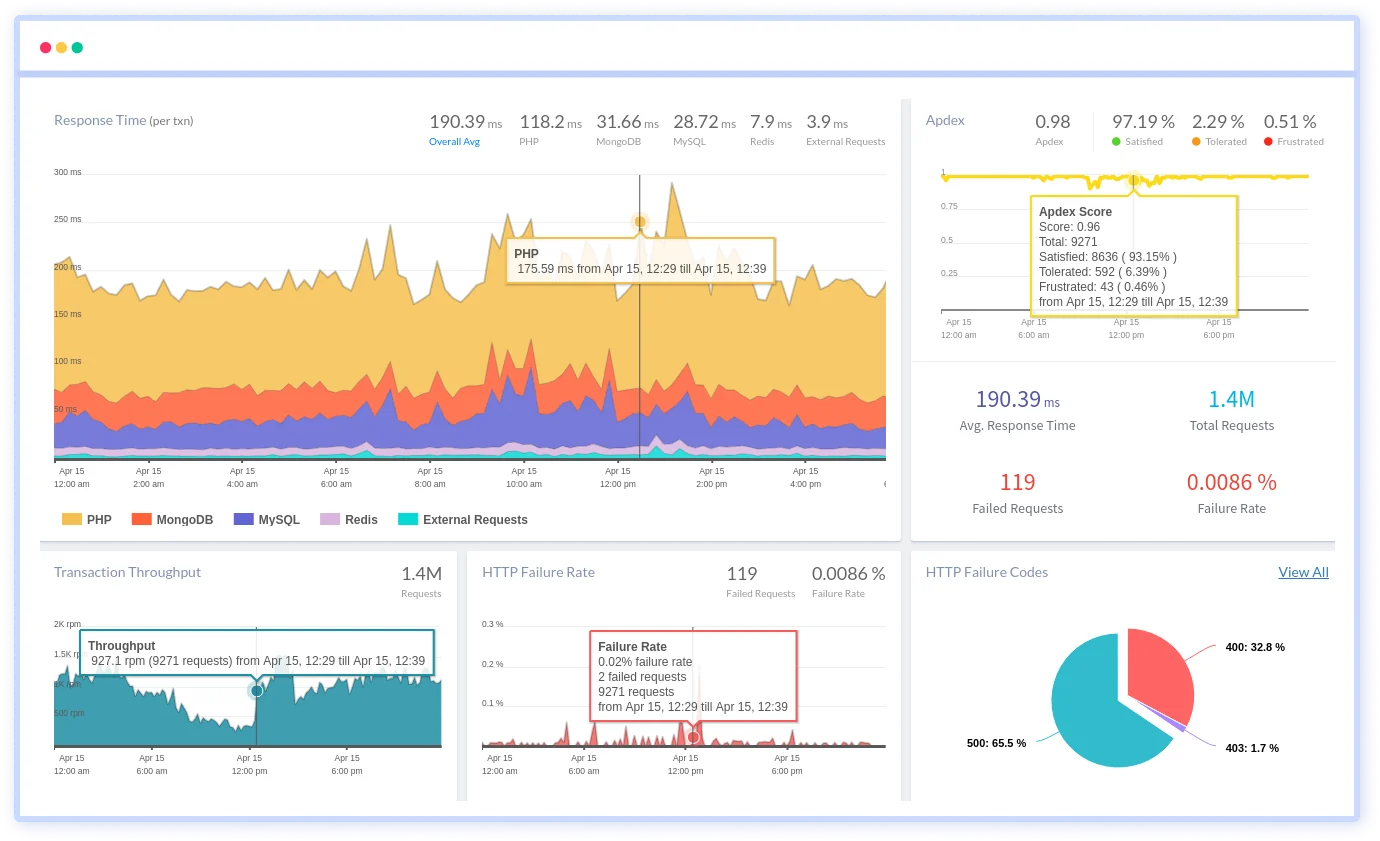
Analyze performance at the route and controller level to identify slow endpoints and traffic-heavy paths. Quickly surface latency issues affecting user requests.
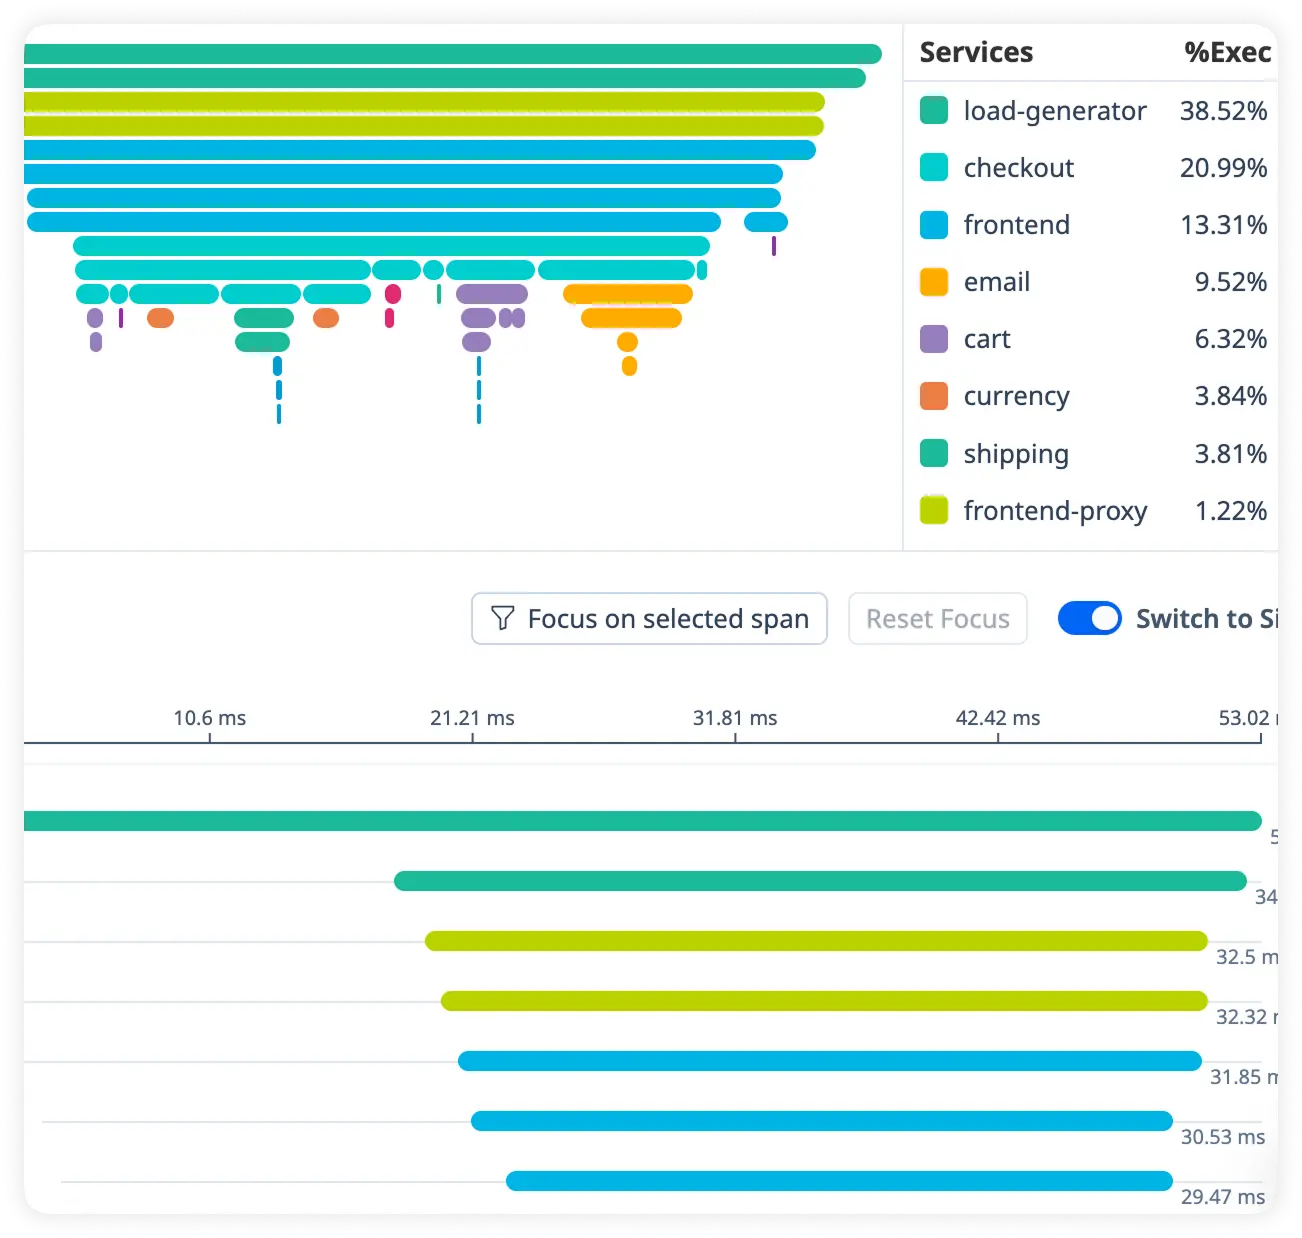
Track how Symfony services interact across the application stack. Detect processing slowdowns inside business logic before they cascade into user-facing performance problems.
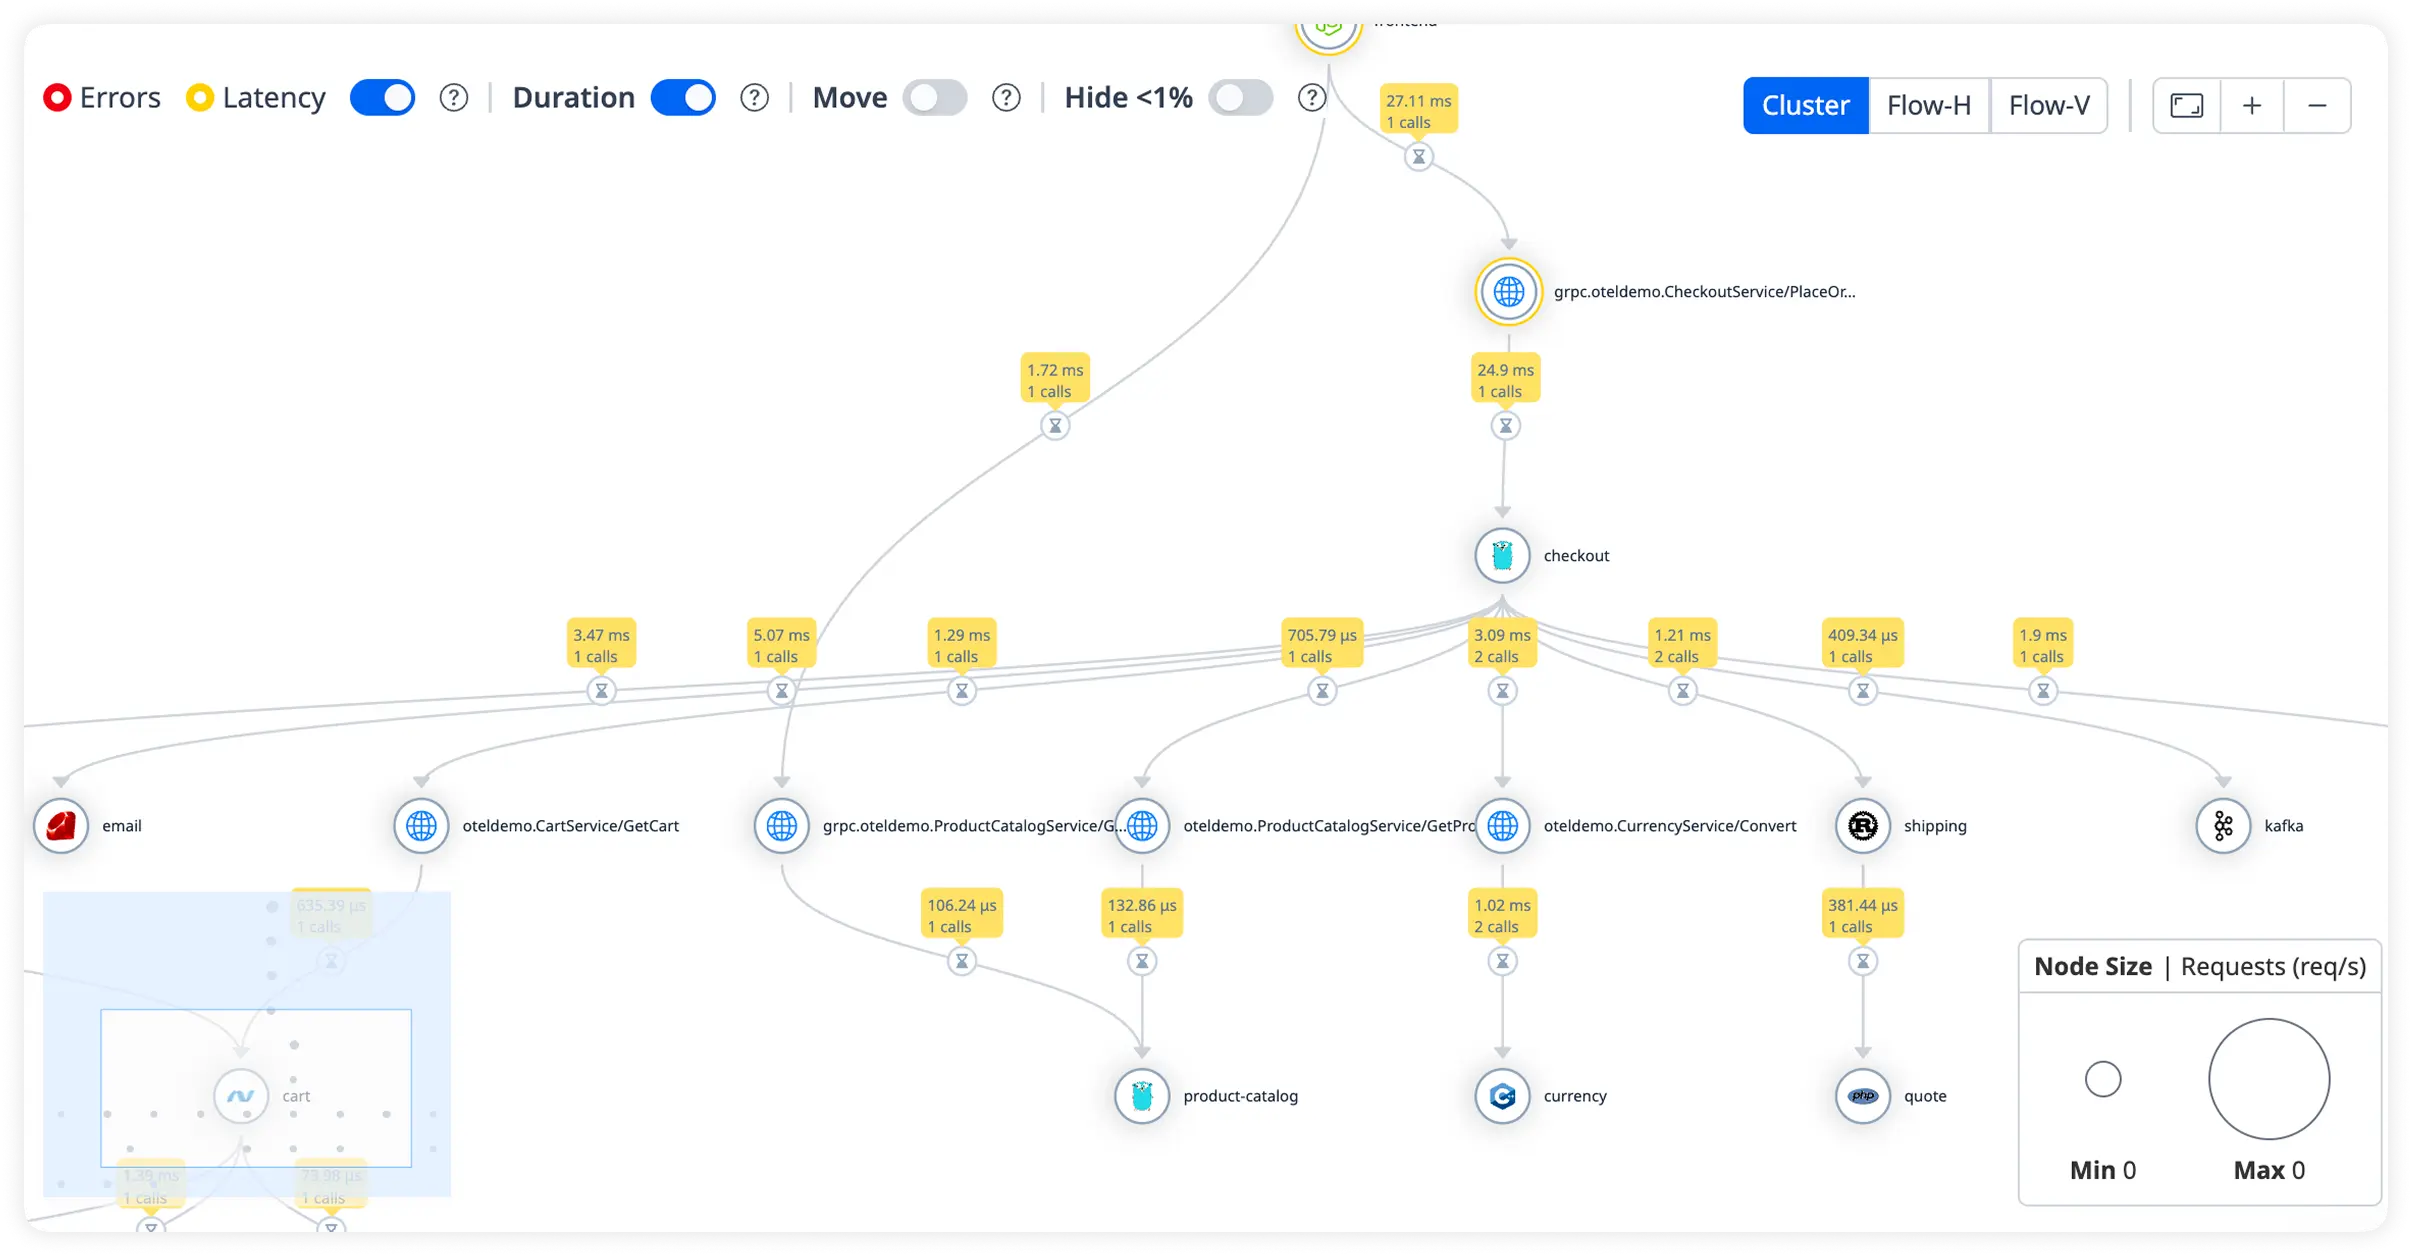
Monitor query execution times, slow queries, and database load in real time. Eliminate inefficiencies that impact application responsiveness.
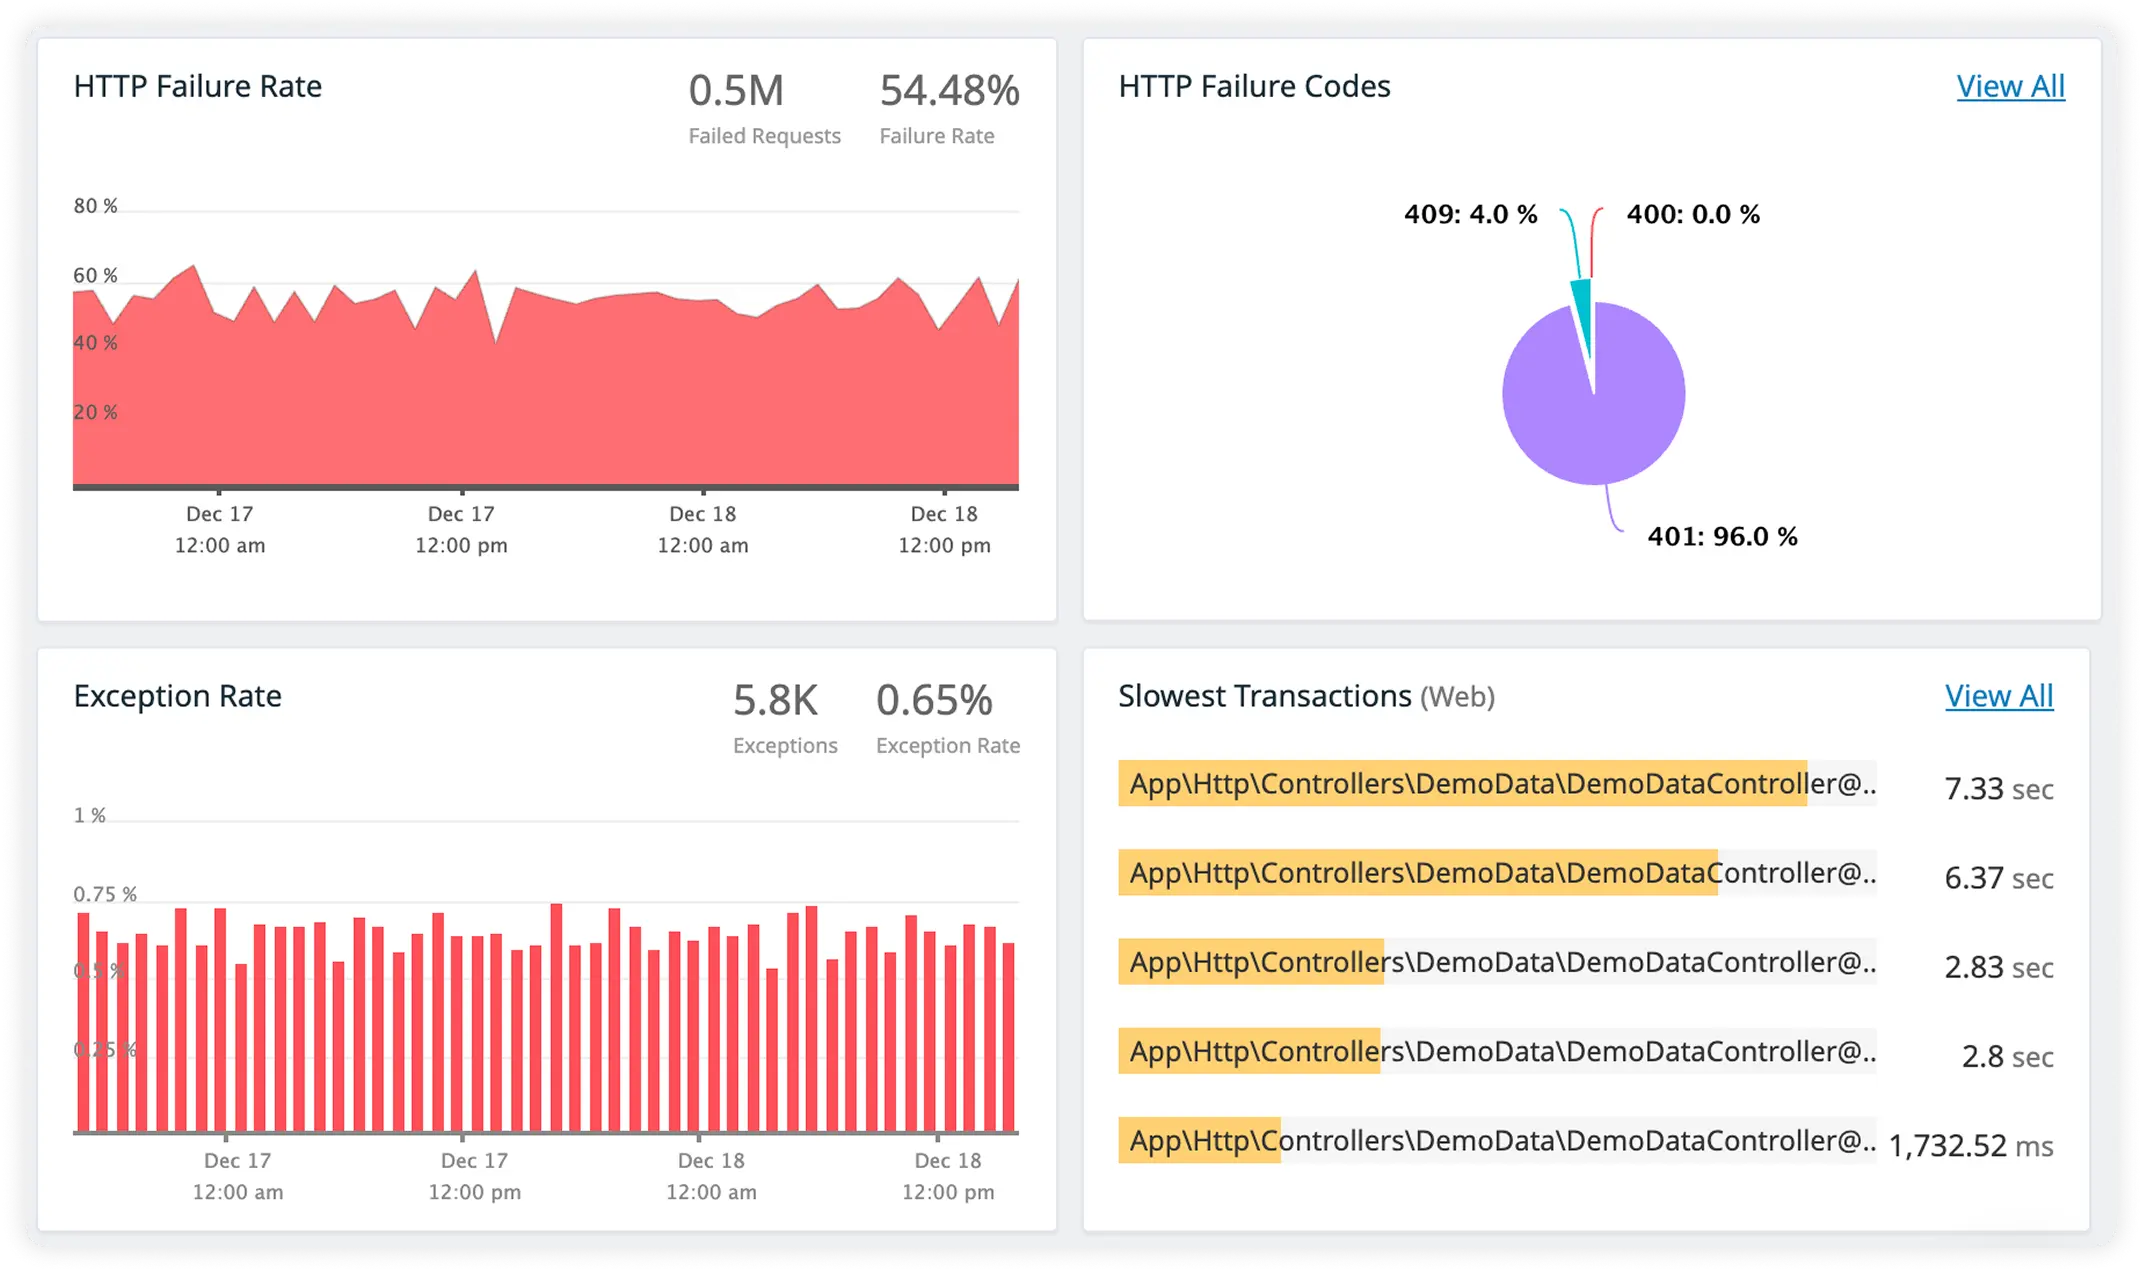
Measure performance of third-party APIs and integrations alongside detailed Symfony error stack traces. Pinpoint failures while understanding how external dependencies affect overall request flow.
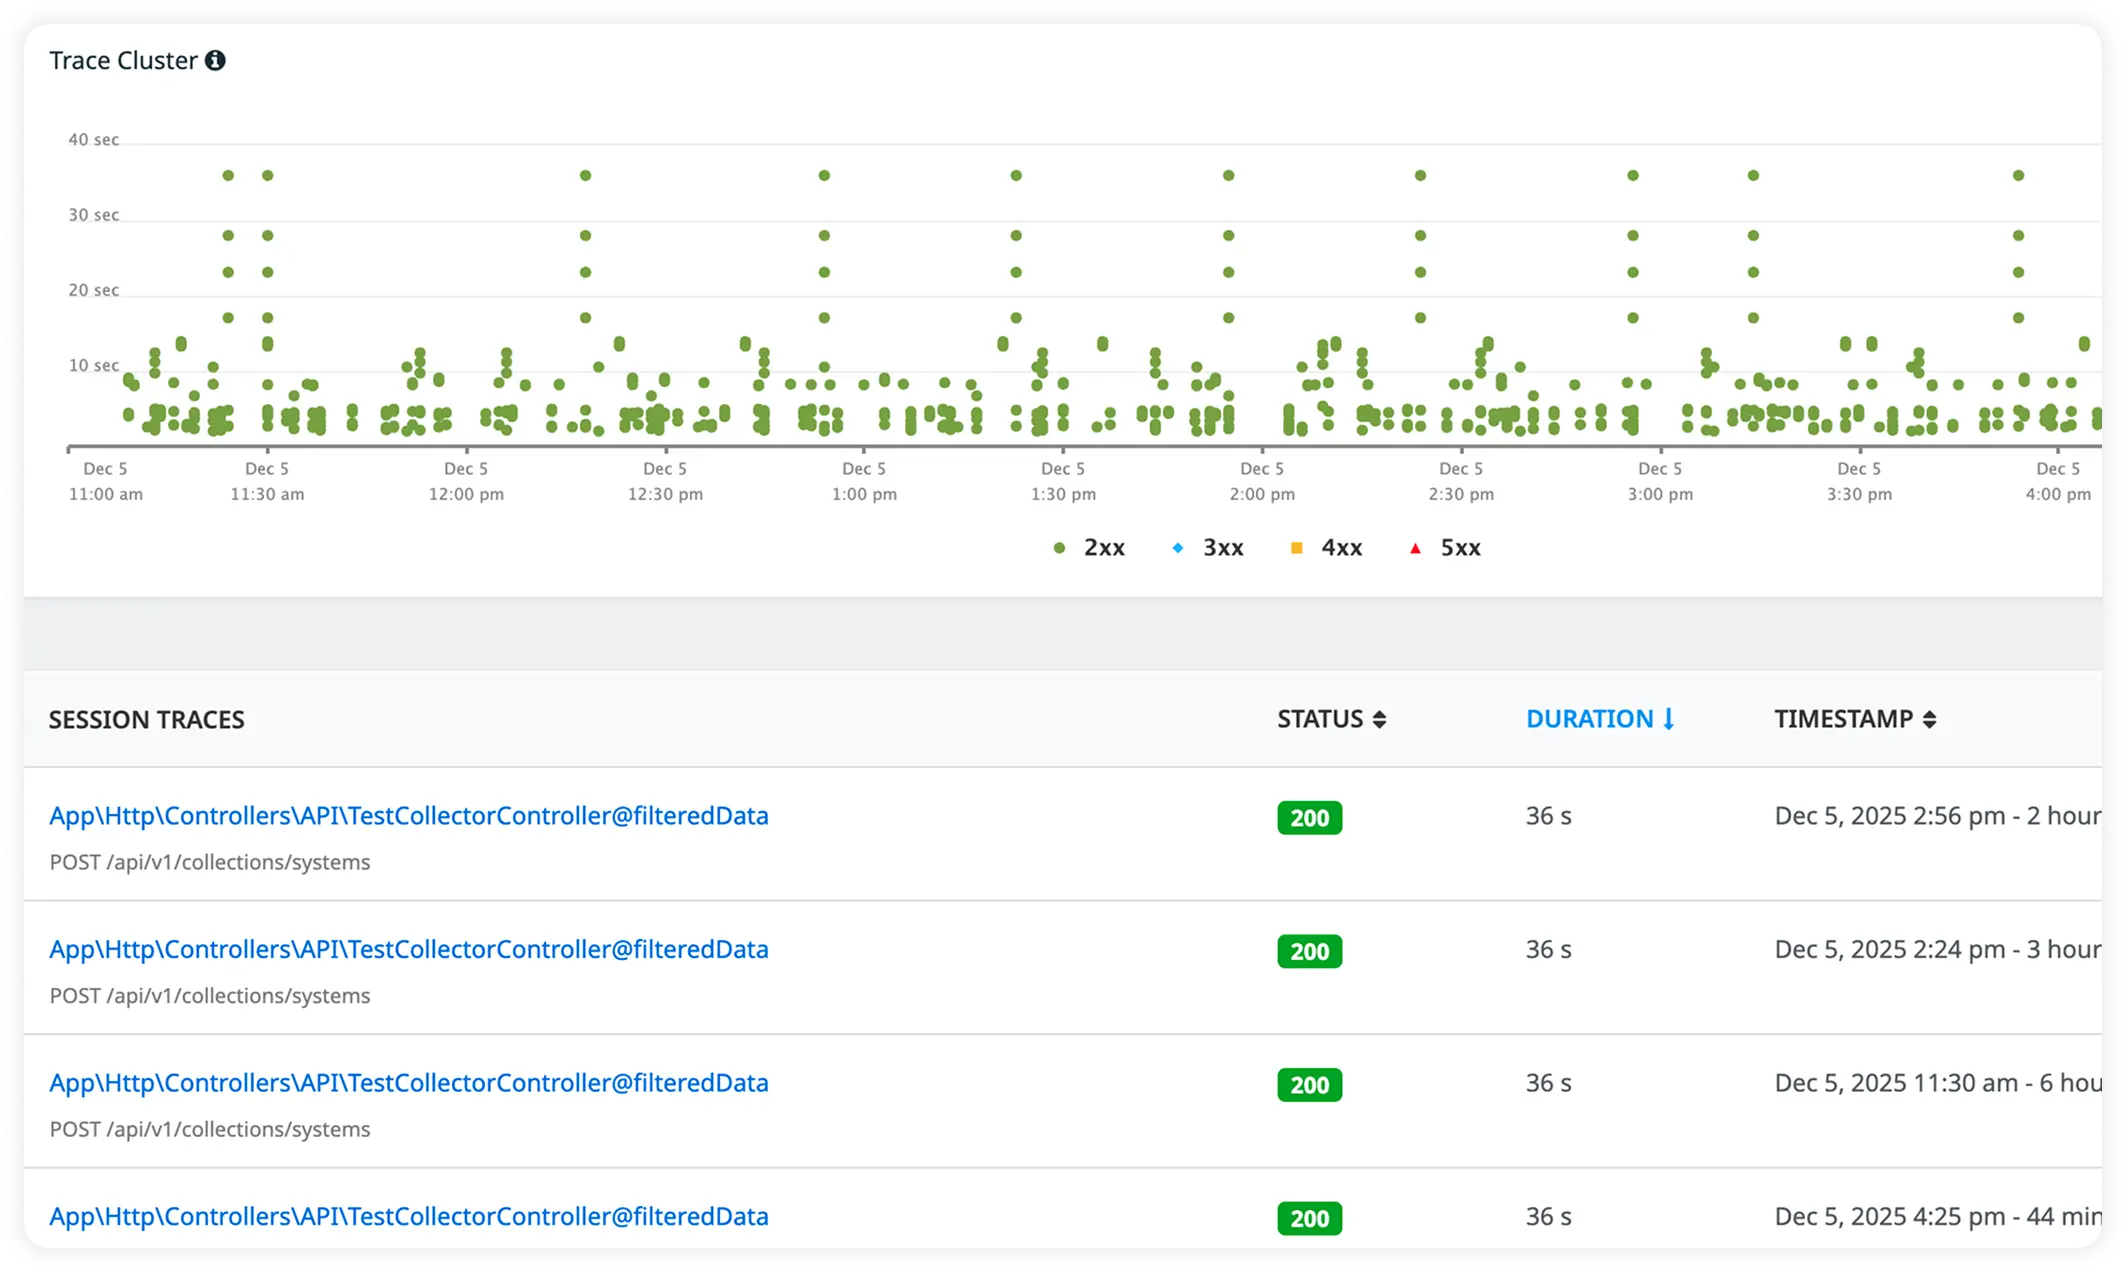
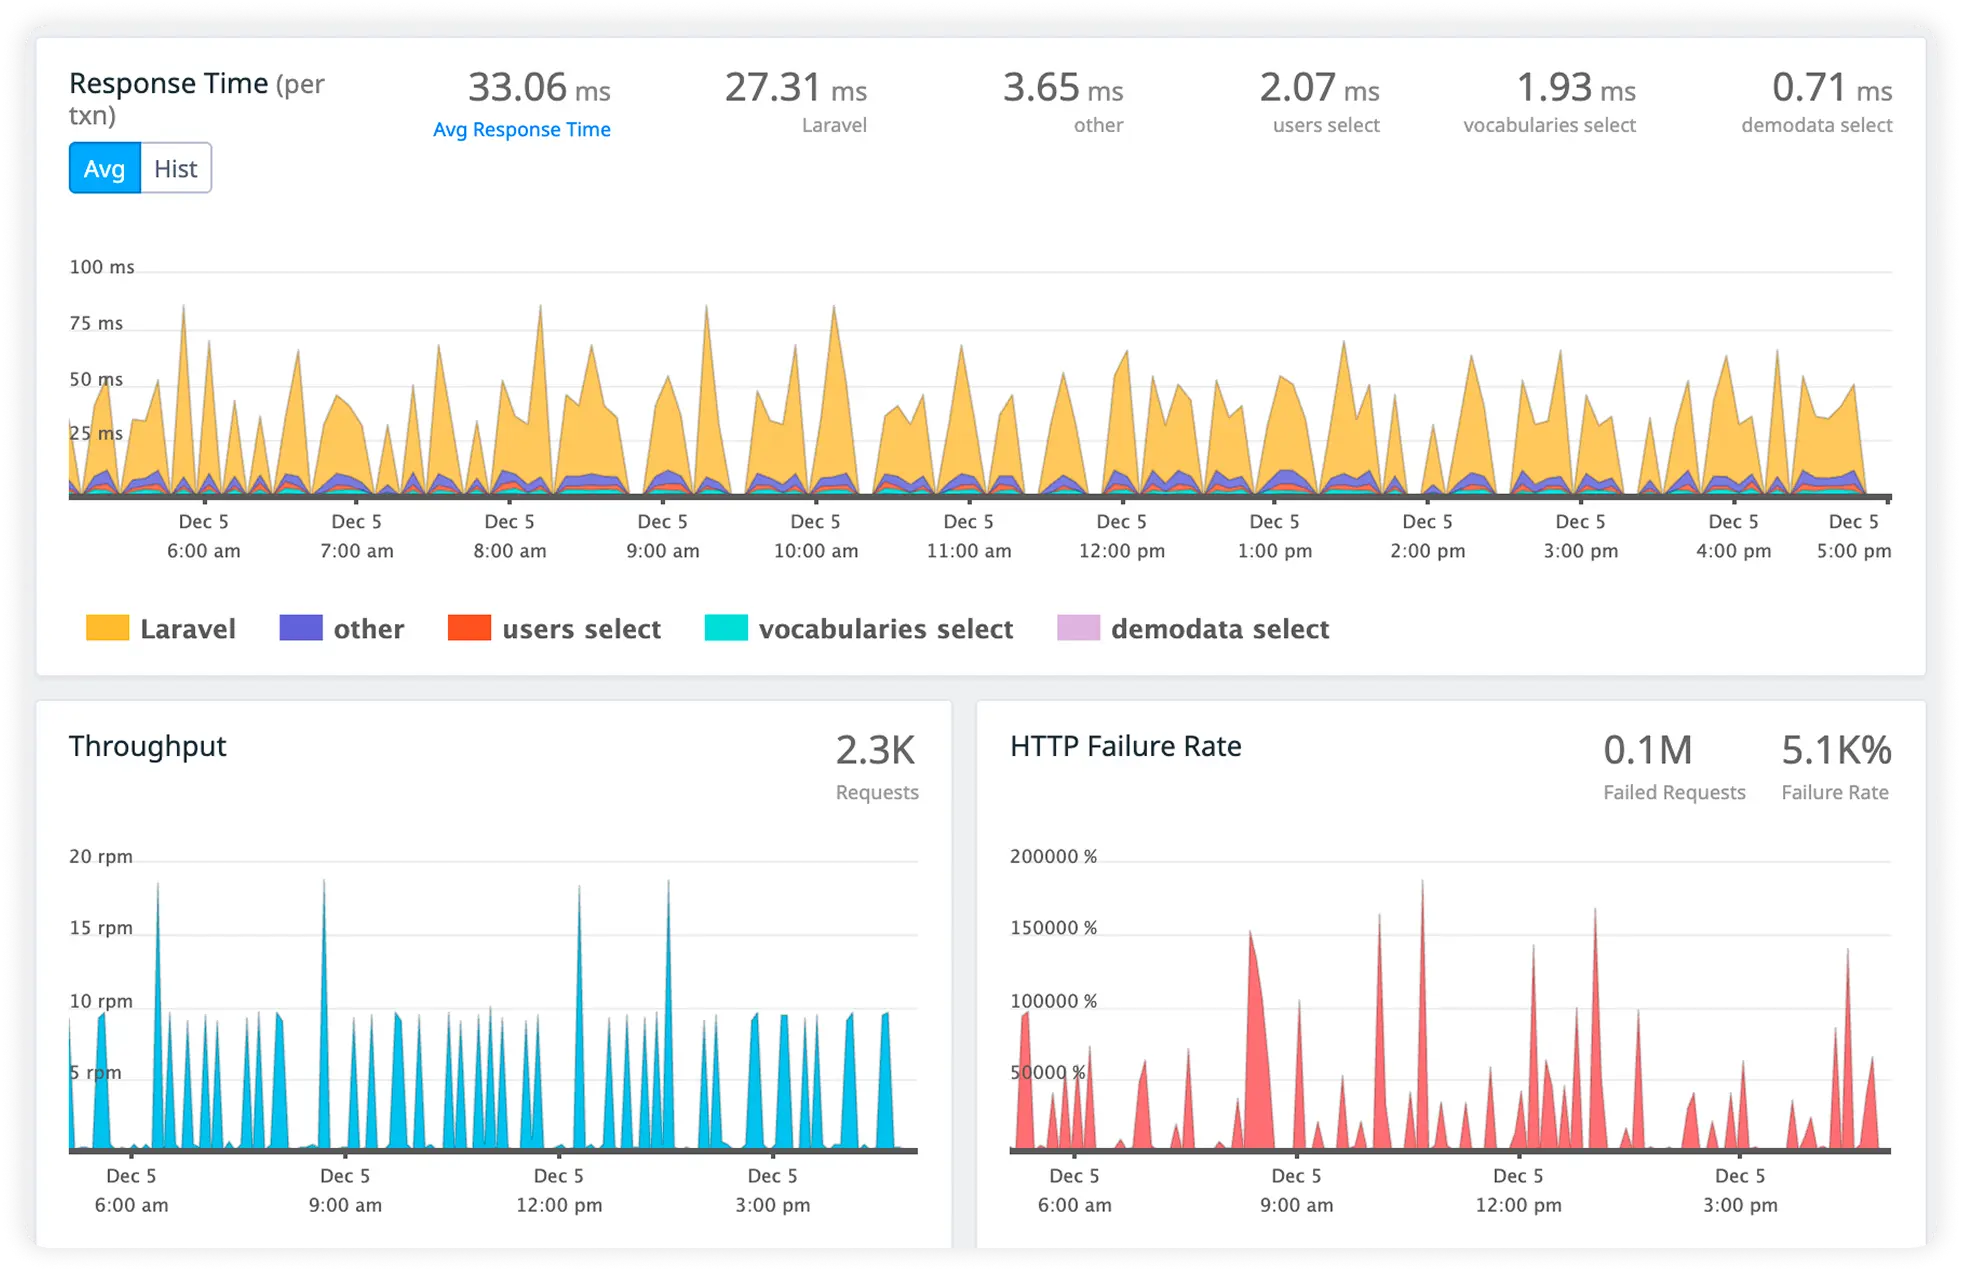
Execution is tracked across the full Symfony kernel flow, from request initialization through controller resolution and response termination, without losing intermediate execution context.
Symfony relies heavily on events and listeners. Atatus helps engineers reason about listener execution order, cumulative cost, and side effects across the request lifecycle.
Service instantiation and dependency resolution occur dynamically at runtime. Atatus exposes when container lookups, lazy loading, or shared services introduce unexpected overhead.
Single events often trigger multiple listeners with cascading effects. Atatus makes it possible to understand how fanout contributes to latency or failures.
Queue consumers and background workers do not exist in isolation. Atatus maintains execution continuity between request-triggered jobs and long-running worker processes.
Long-running Symfony workers accumulate state over time. Atatus surfaces memory behavior patterns that only emerge under sustained execution.
Exceptions in Symfony are frequently wrapped, rethrown, or converted. Atatus allows engineers to follow exception lineage back to the originating execution point.
Production behavior often diverges from staging due to container compilation, cache state, or worker longevity. Atatus helps expose these environment-specific execution differences.
Injected services may change behavior due to configuration or runtime state. Atatus helps teams identify when dependency behavior drifts during long-running processes.
Atatus adapts to how engineering teams work across development, operations, and reliability.
Debug errors and slow paths with the full context of what happened.
Atatus for developersTrack deployments and see how each release affects stability.
Atatus for DevOpsWatch latency and error rates to ship with less production risk.
Atatus for release engineersPricing, deployment, data and the agent. If something is missing, a person will answer it on a demo call.
The Symfony performance monitoring tool helps developers to optimize the Symfony server performance.
A good Symfony APM solution answers the following two questions:
You can easily use application performance monitoring tools to answer, detect and resolve the above issues before they could impact the end users.
In general, there are two types of monitoring:
Every organization should have a well-implemented Symfony APM solution, which allows DevOps teams (and the organization as a whole) to resolve issues and performance bottlenecks efficiently and reduce Mean Time To Resolution (MTTR). This has a substantial impact on the bottom line of the business.
Now organizations do not have to deal with the unnecessary work involved in maintaining an extensive software analysis group.
Your Symfony performance monitoring tools should be easy to use, offer actionable insights, and be able to:
Technical Benefits:
Business Benefits:
With the help of the database monitoring, you can easily identify the database performance bottlenecks.


