Real user session visibility
Understand how real users navigate, interact, and experience your Angular application under live traffic. Track full user sessions to identify friction points that backend monitoring cannot reveal.
Get complete visibility into your Angular errors and performance issues that are impacting your end user experience. Fix critical issues sooner with in depth data points that helps you in analyzing and resolving issues with great speed.
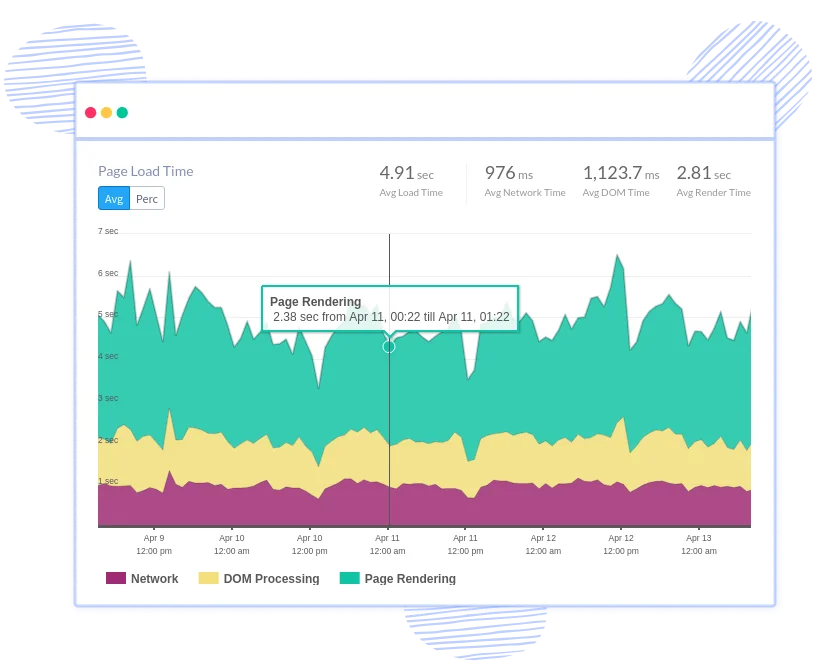
Understand how real users navigate, interact, and experience your Angular application under live traffic. Track full user sessions to identify friction points that backend monitoring cannot reveal.
Monitor Angular Router navigation and virtual page loads to see which routes are slow and why. Identify delays caused by JavaScript execution, API calls, or heavy component rendering.
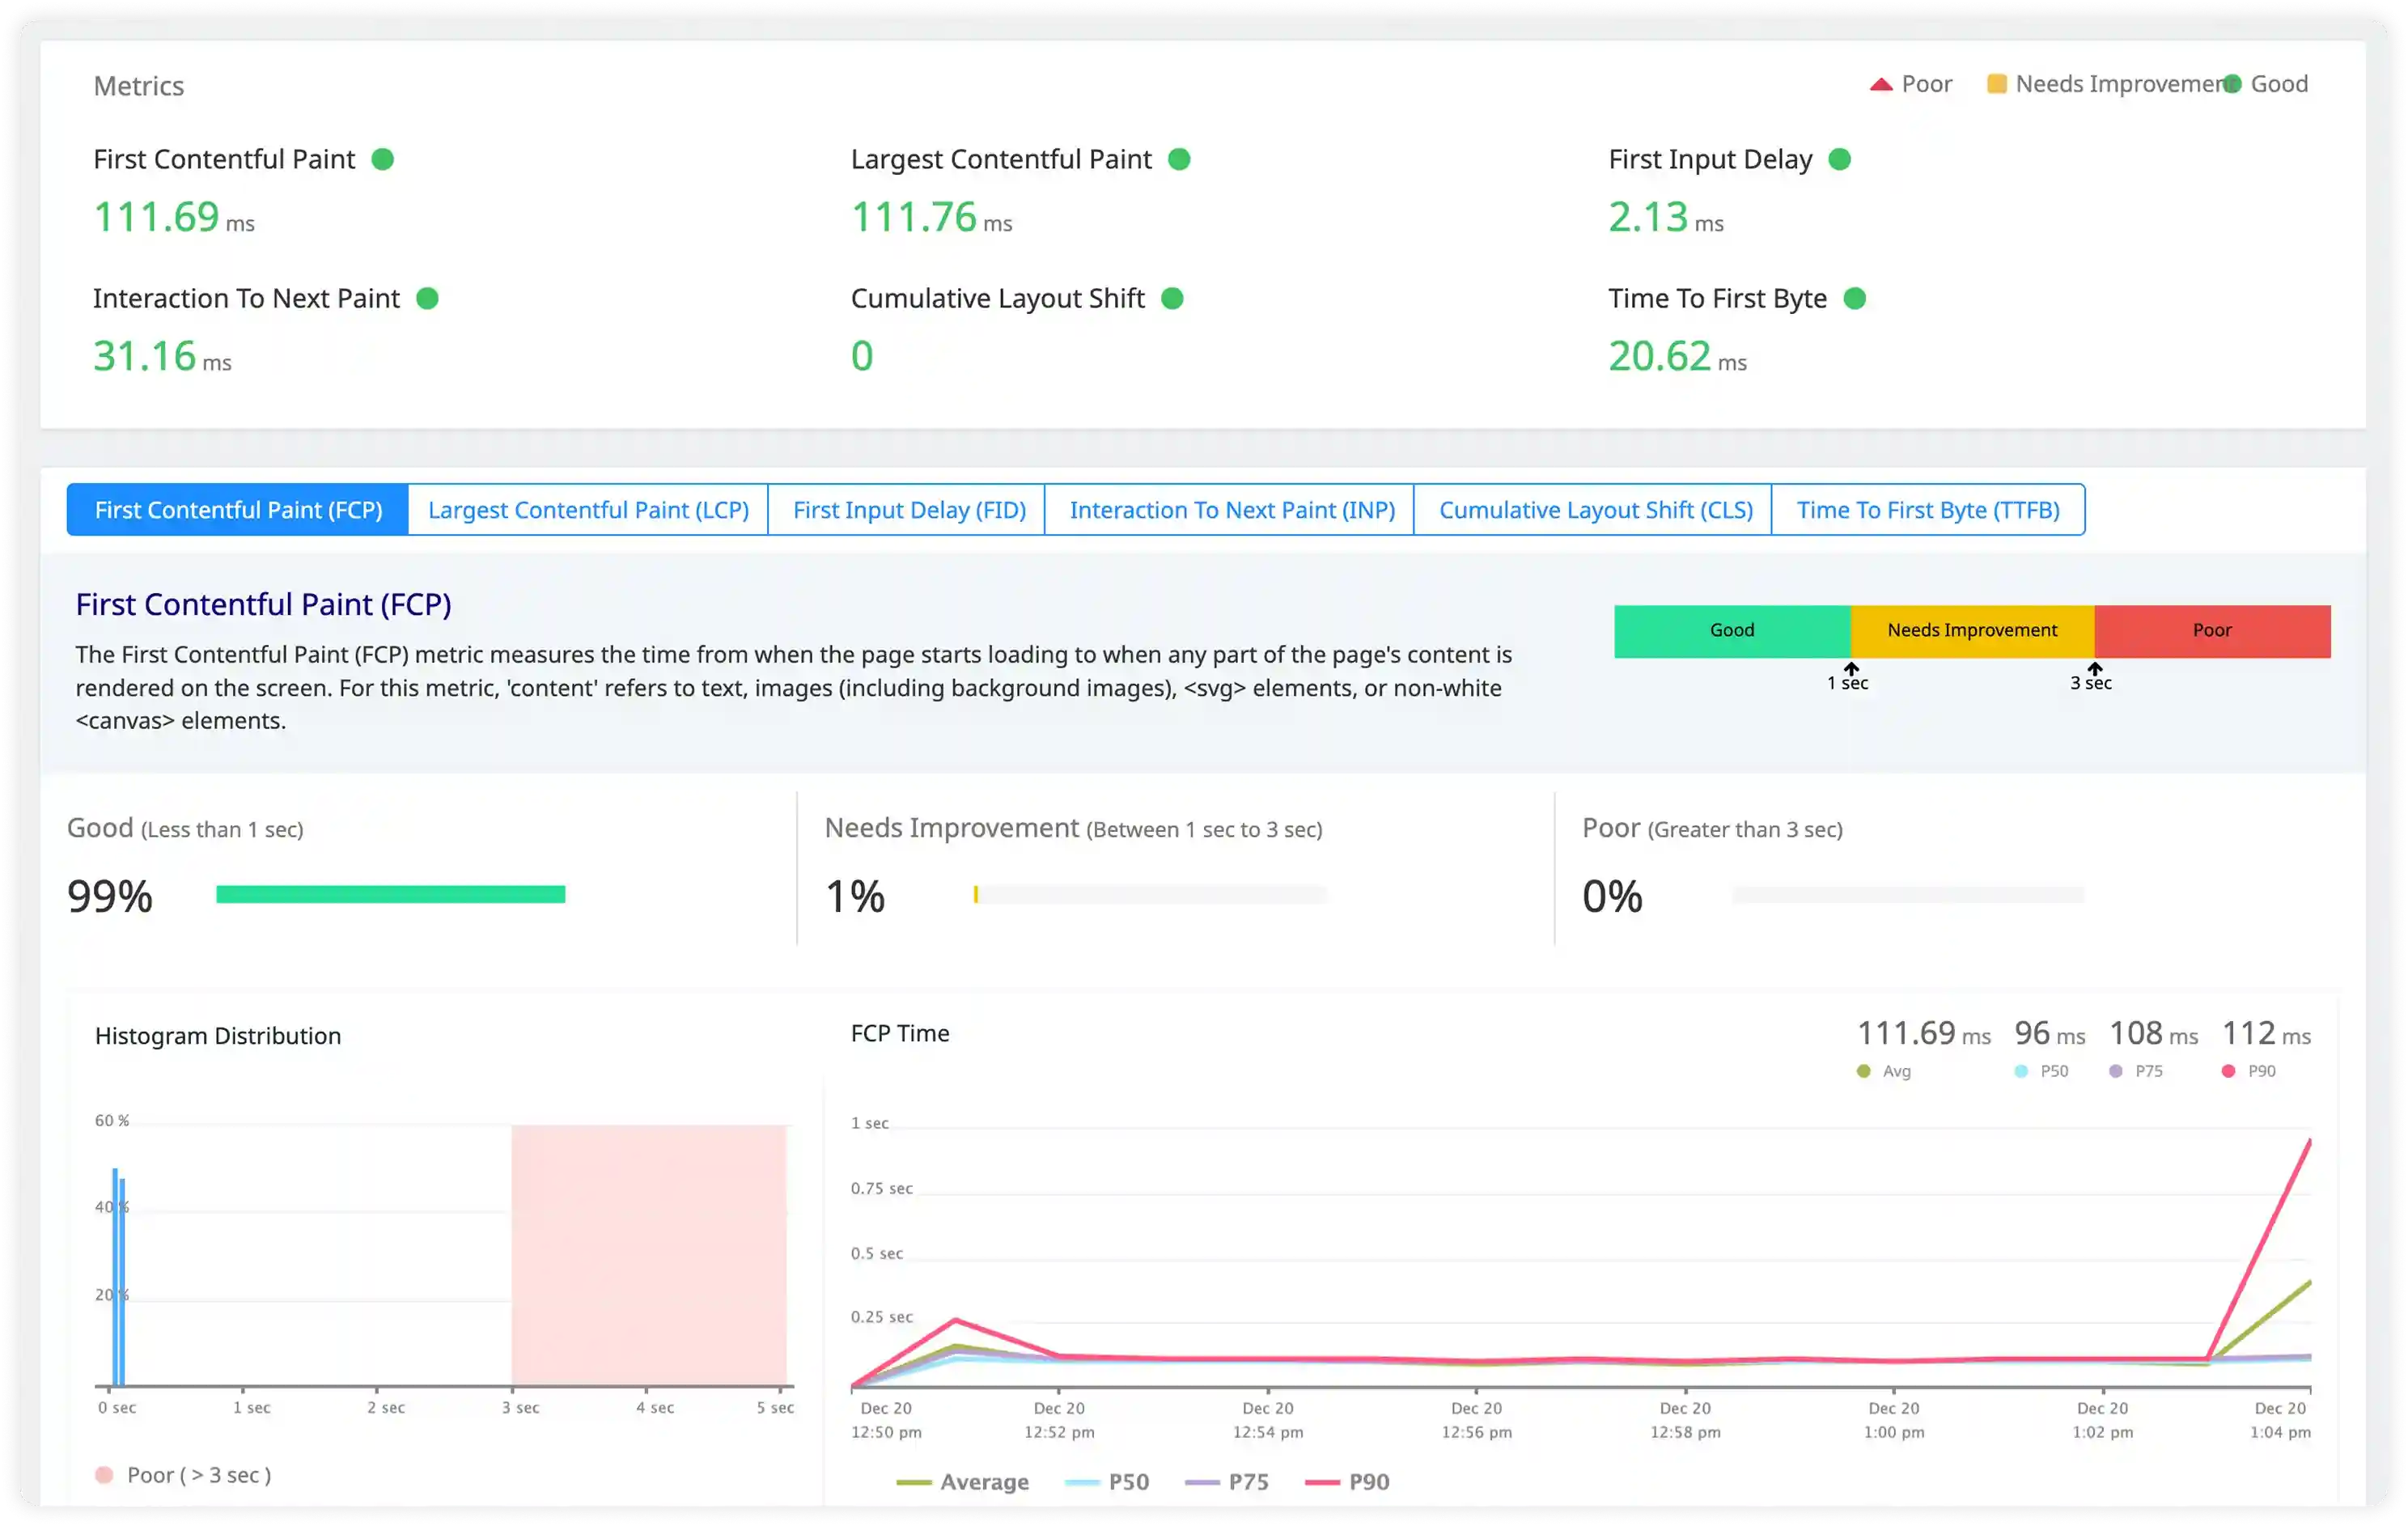
Measure real-world frontend performance including load time, interaction latency, and Core Web Vitals (LCP, CLS, INP). See how Angular performance varies across devices, browsers, and networks.
Capture runtime JavaScript errors and Angular-specific failures that don’t crash the app but break user experience. View stack traces with route, browser, and release context.
Detect slow or broken user interactions such as repeated clicks, unresponsive buttons, and stalled flows. Identify UX issues caused by frontend logic rather than backend failures.
Connect user sessions directly to frontend errors, slow routes, and backend APIs. Quickly trace issues from real user impact to the exact Angular code path responsible.
Analyze Angular performance across different browsers, devices, and operating systems. Identify environment-specific issues that affect only certain user segments.
Use real user context to prioritize and fix Angular issues faster. Reduce time spent guessing by focusing on problems that impact real users the most.
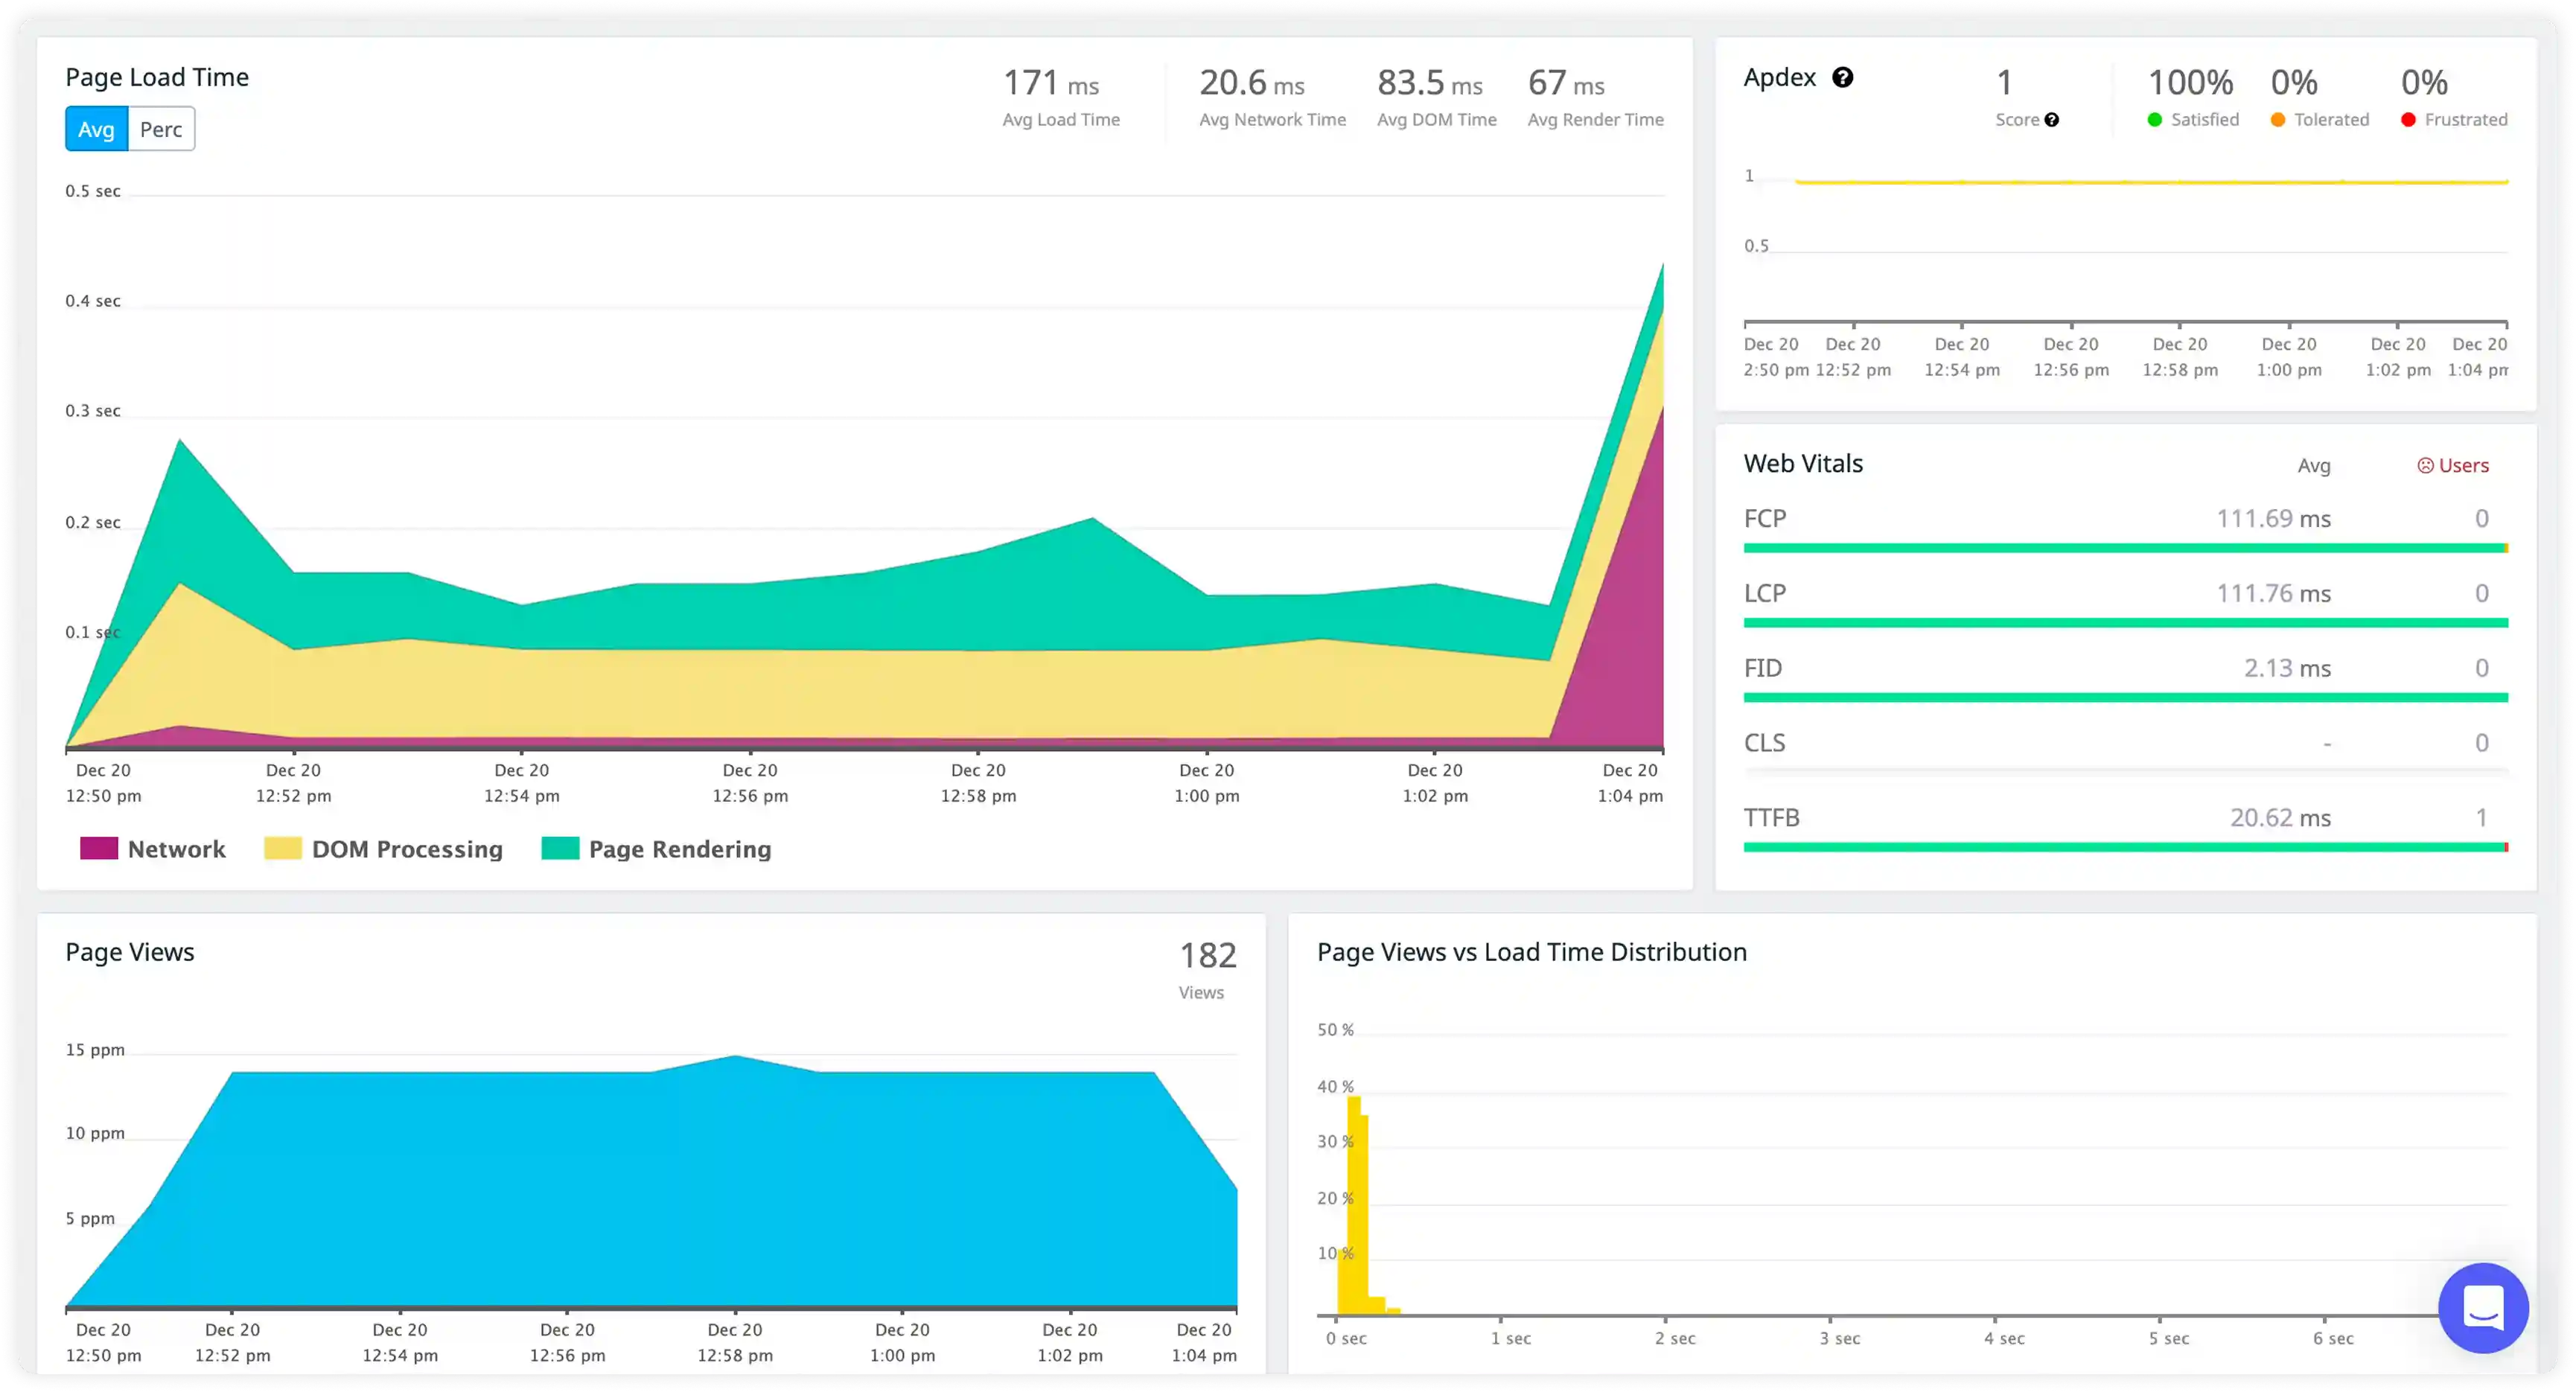
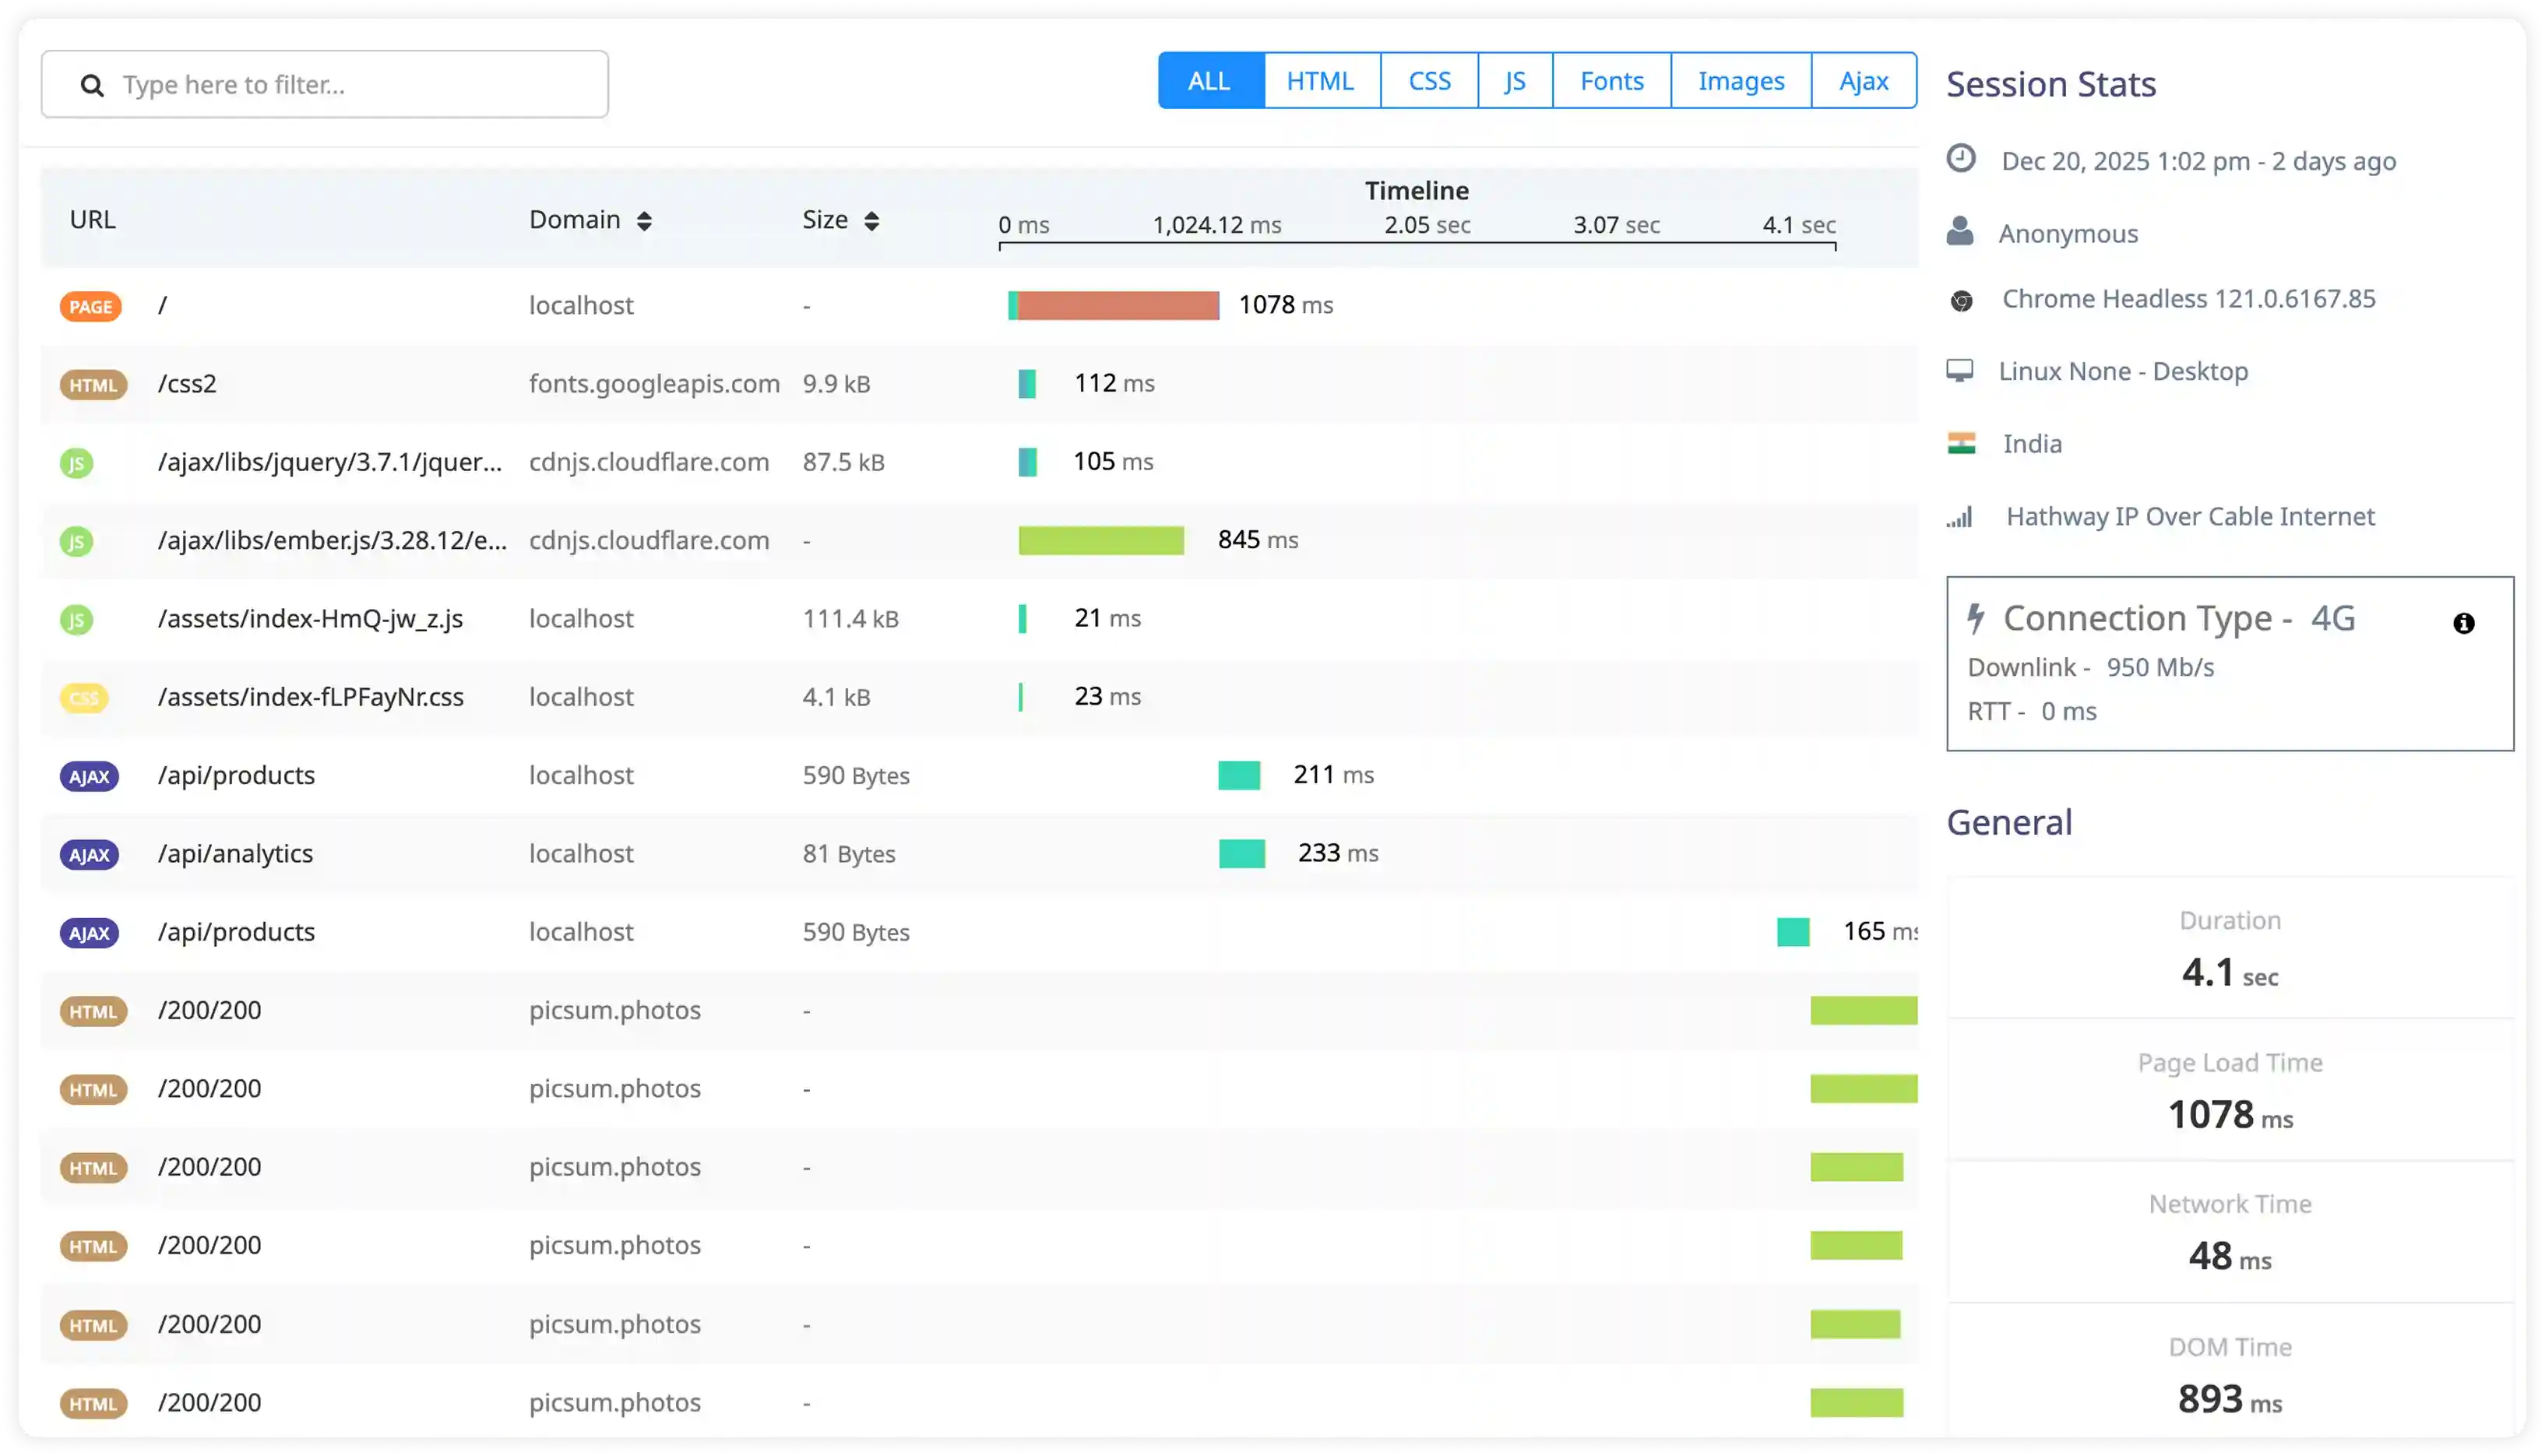
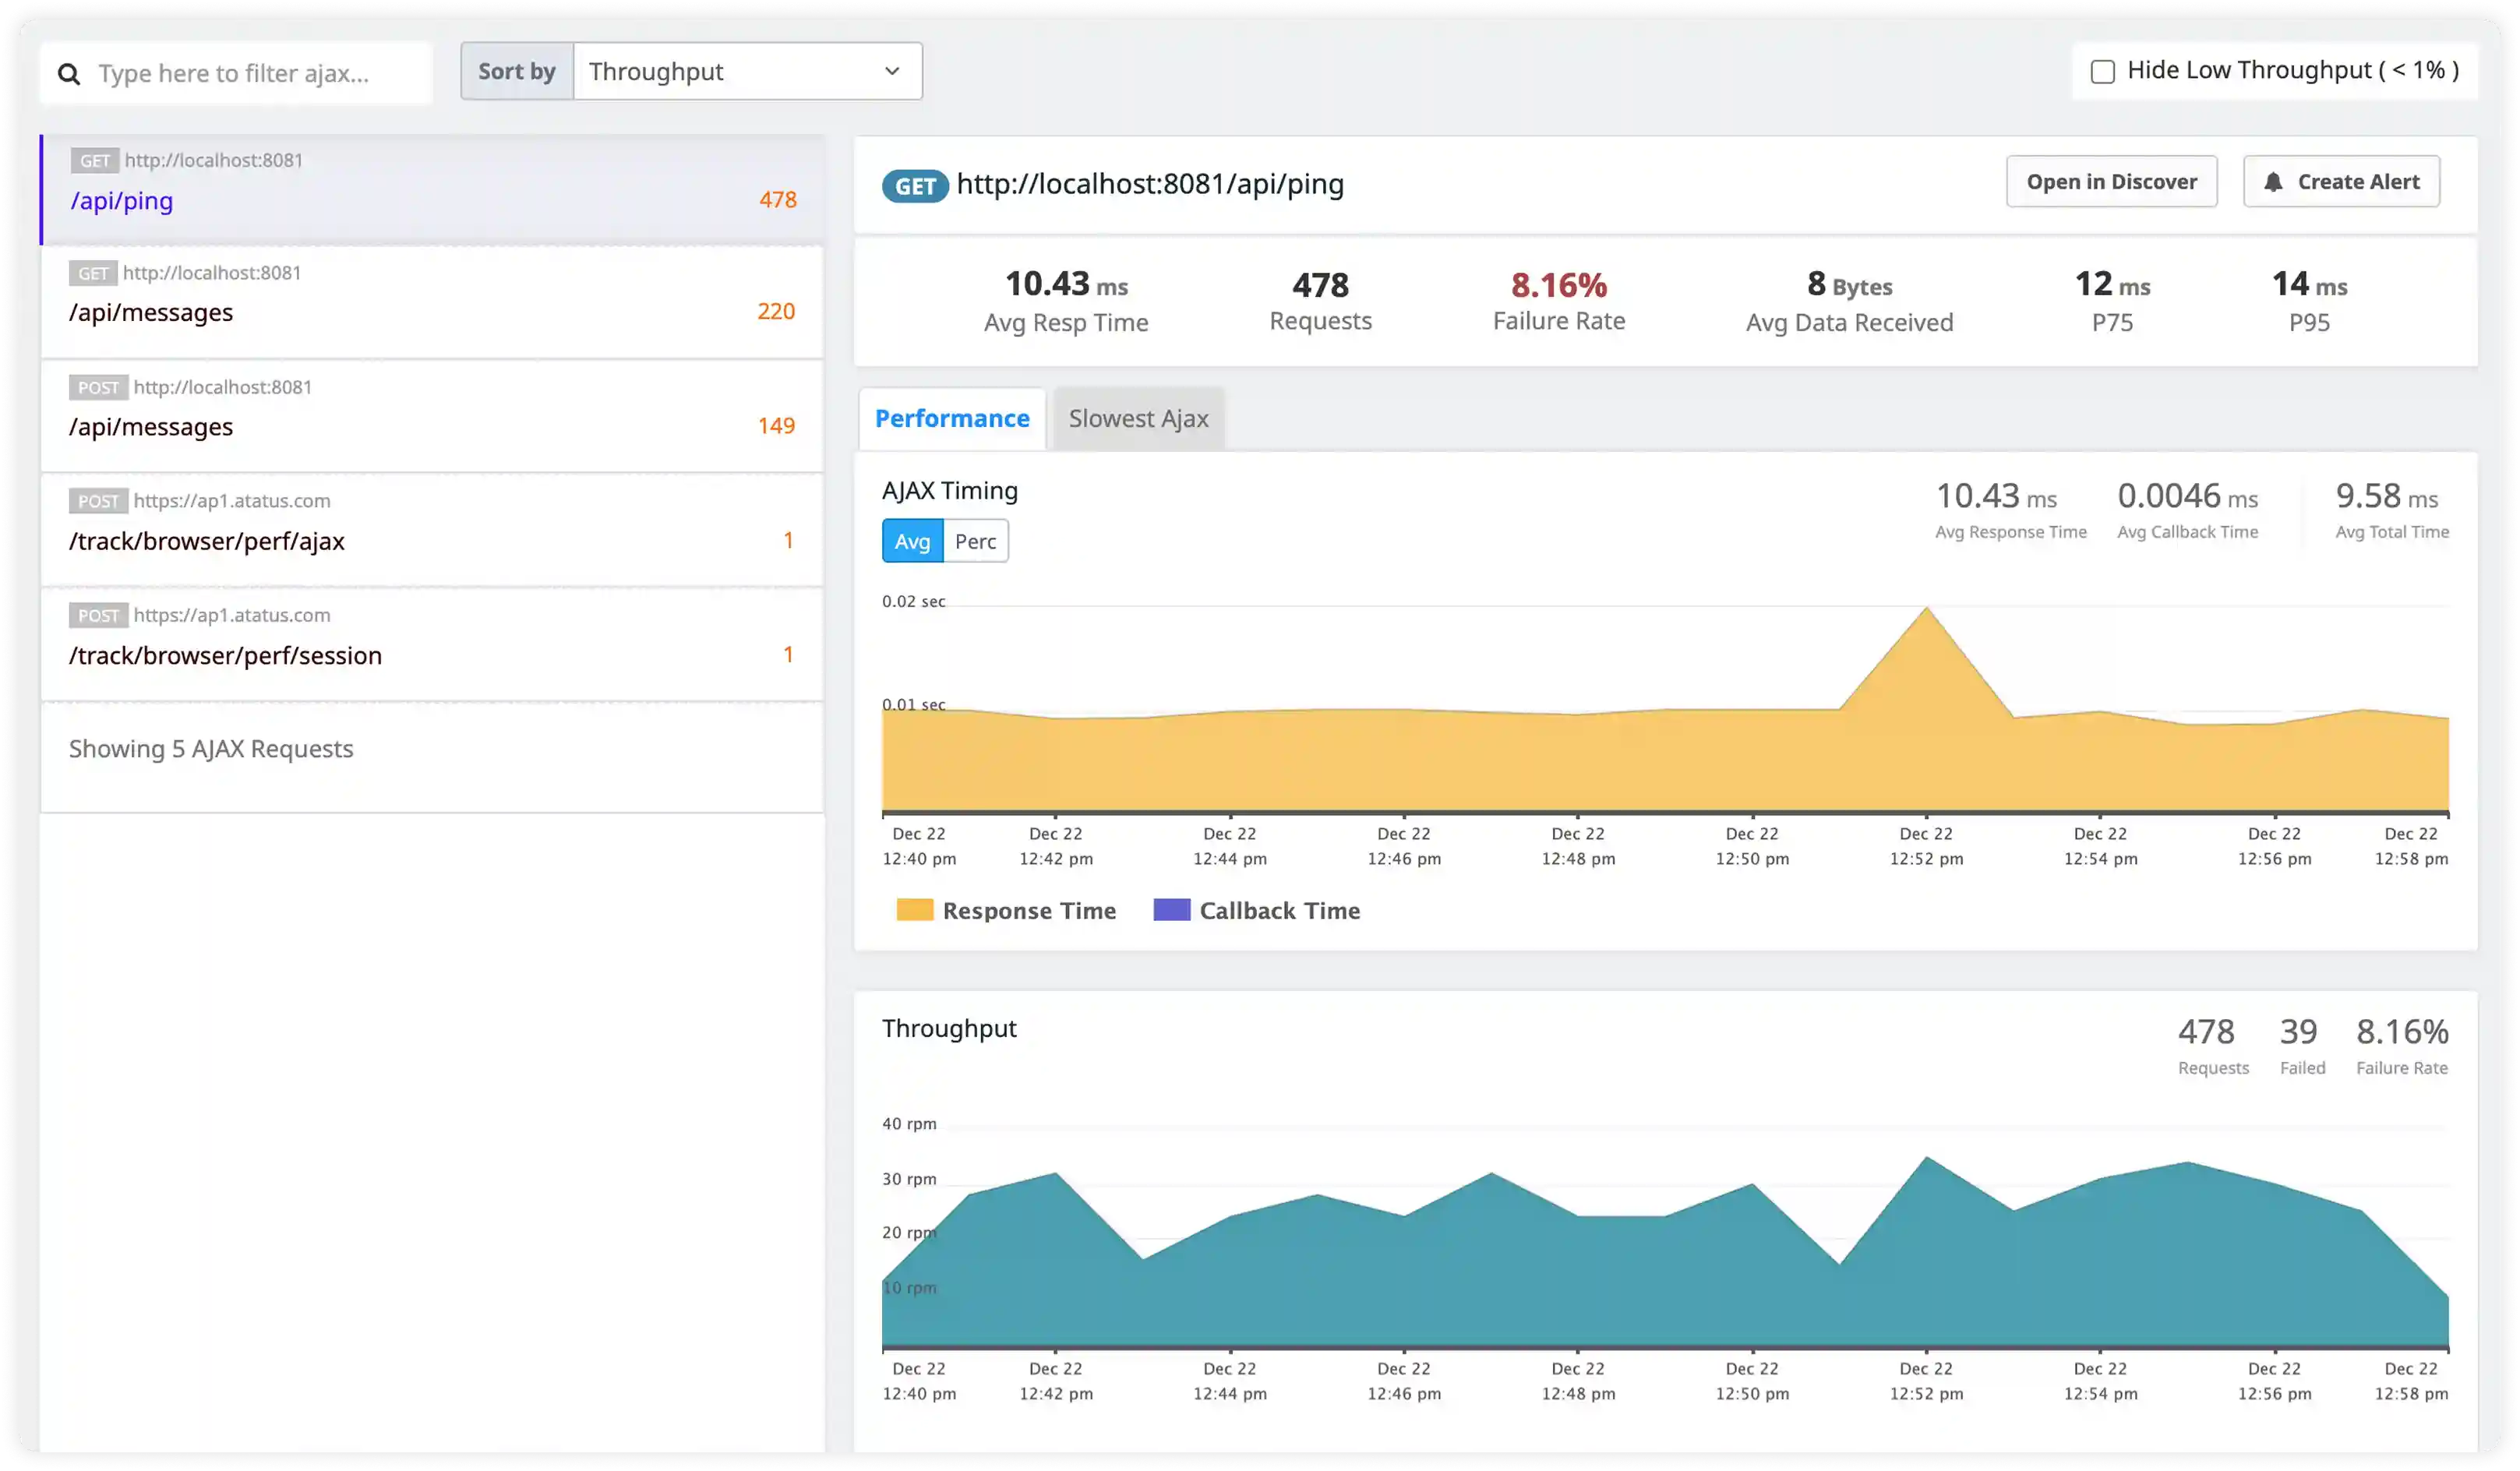
Gain real-time visibility into Angular component performance, SPA navigation, and Core Web Vitals without stack complexity
Tailored insights into component load times, change detection, and SPA routing behavior in production environments.
Real-time error tracking with Angular-specific stack traces and repro steps accelerates issue resolution.
Lightweight agent with zero sampling ensures minimal performance impact on Angular applications.
Actionable LCP, FID, CLS metrics surfaced without overwhelming developers with noise.
Handles high-traffic Angular SPAs across geo-regions with enterprise-grade reliability.
Scalable pricing grows with your user base—no contracts or restrictive feature tiers.
Atatus adapts to how engineering teams work across development, operations, and reliability.
Debug errors and slow paths with the full context of what happened.
Atatus for developersTrack deployments and see how each release affects stability.
Atatus for DevOpsWatch latency and error rates to ship with less production risk.
Atatus for release engineersPricing, deployment, data and the agent. If something is missing, a person will answer it on a demo call.
Angular performance monitoring collects in-depth metrics on each user-interaction and analyzes everything from page load events to HTTP requests to front-end application crashes.
Monitoring Angular apps helps you to pinpoint Angular issues, measure user experience with the key metrics provided and fix them as soon as possible.
In real-time monitoring, a small piece of code is injected into the application to collect metrics while it is in use.
The browser-based applications can be monitored by injecting a JavaScript code which tracks and detects the front-end performance issues along with the XHR requests.
It also provides you with in-depth front-end metrics which helps you in resolving the issues at a faster rate.
Atatus Real User Monitoring supports front-end frameworks such as JavaScript, AngularJS, Angular, React, Backbone, Ember, Vue, Ionic, Ionic2+ and Meteor.
Also, you can embed the JavaScript snippet in a web page inside the tag and monitor.
Yes, we collect the IP address of the browser client used by the user, which will be displayed in the users' information along with the page views, load time, error count and last seen of the user, respectively.
Yes, we do collect core web vitals metrics such as:
As part of Atatus Browser Monitoring, we have a Single Page Application (SPA) Monitoring feature that gives a 360-degree view of what customers are doing with single-page apps and AJAX-based apps.
The benefits of real-time monitoring of users are substantial.
Compared to all other browser monitoring tools Atatus offers affordable pricing plans. Collaboration requires in any monitoring tool so we do not limit your capabilities by charging per user.
We collect all the data points including Spans and Traces that are necessary for you without the need for you to select which to retain. With this you can easily monitor your entire application.
Rather than stop collecting the front-end performance metrics, our sales team will contact you to discuss the requirements.
Start free and send your first trace with OpenTelemetry or the Atatus agents. APM, logs, RUM, infrastructure and SIEM, all on one timeline.


