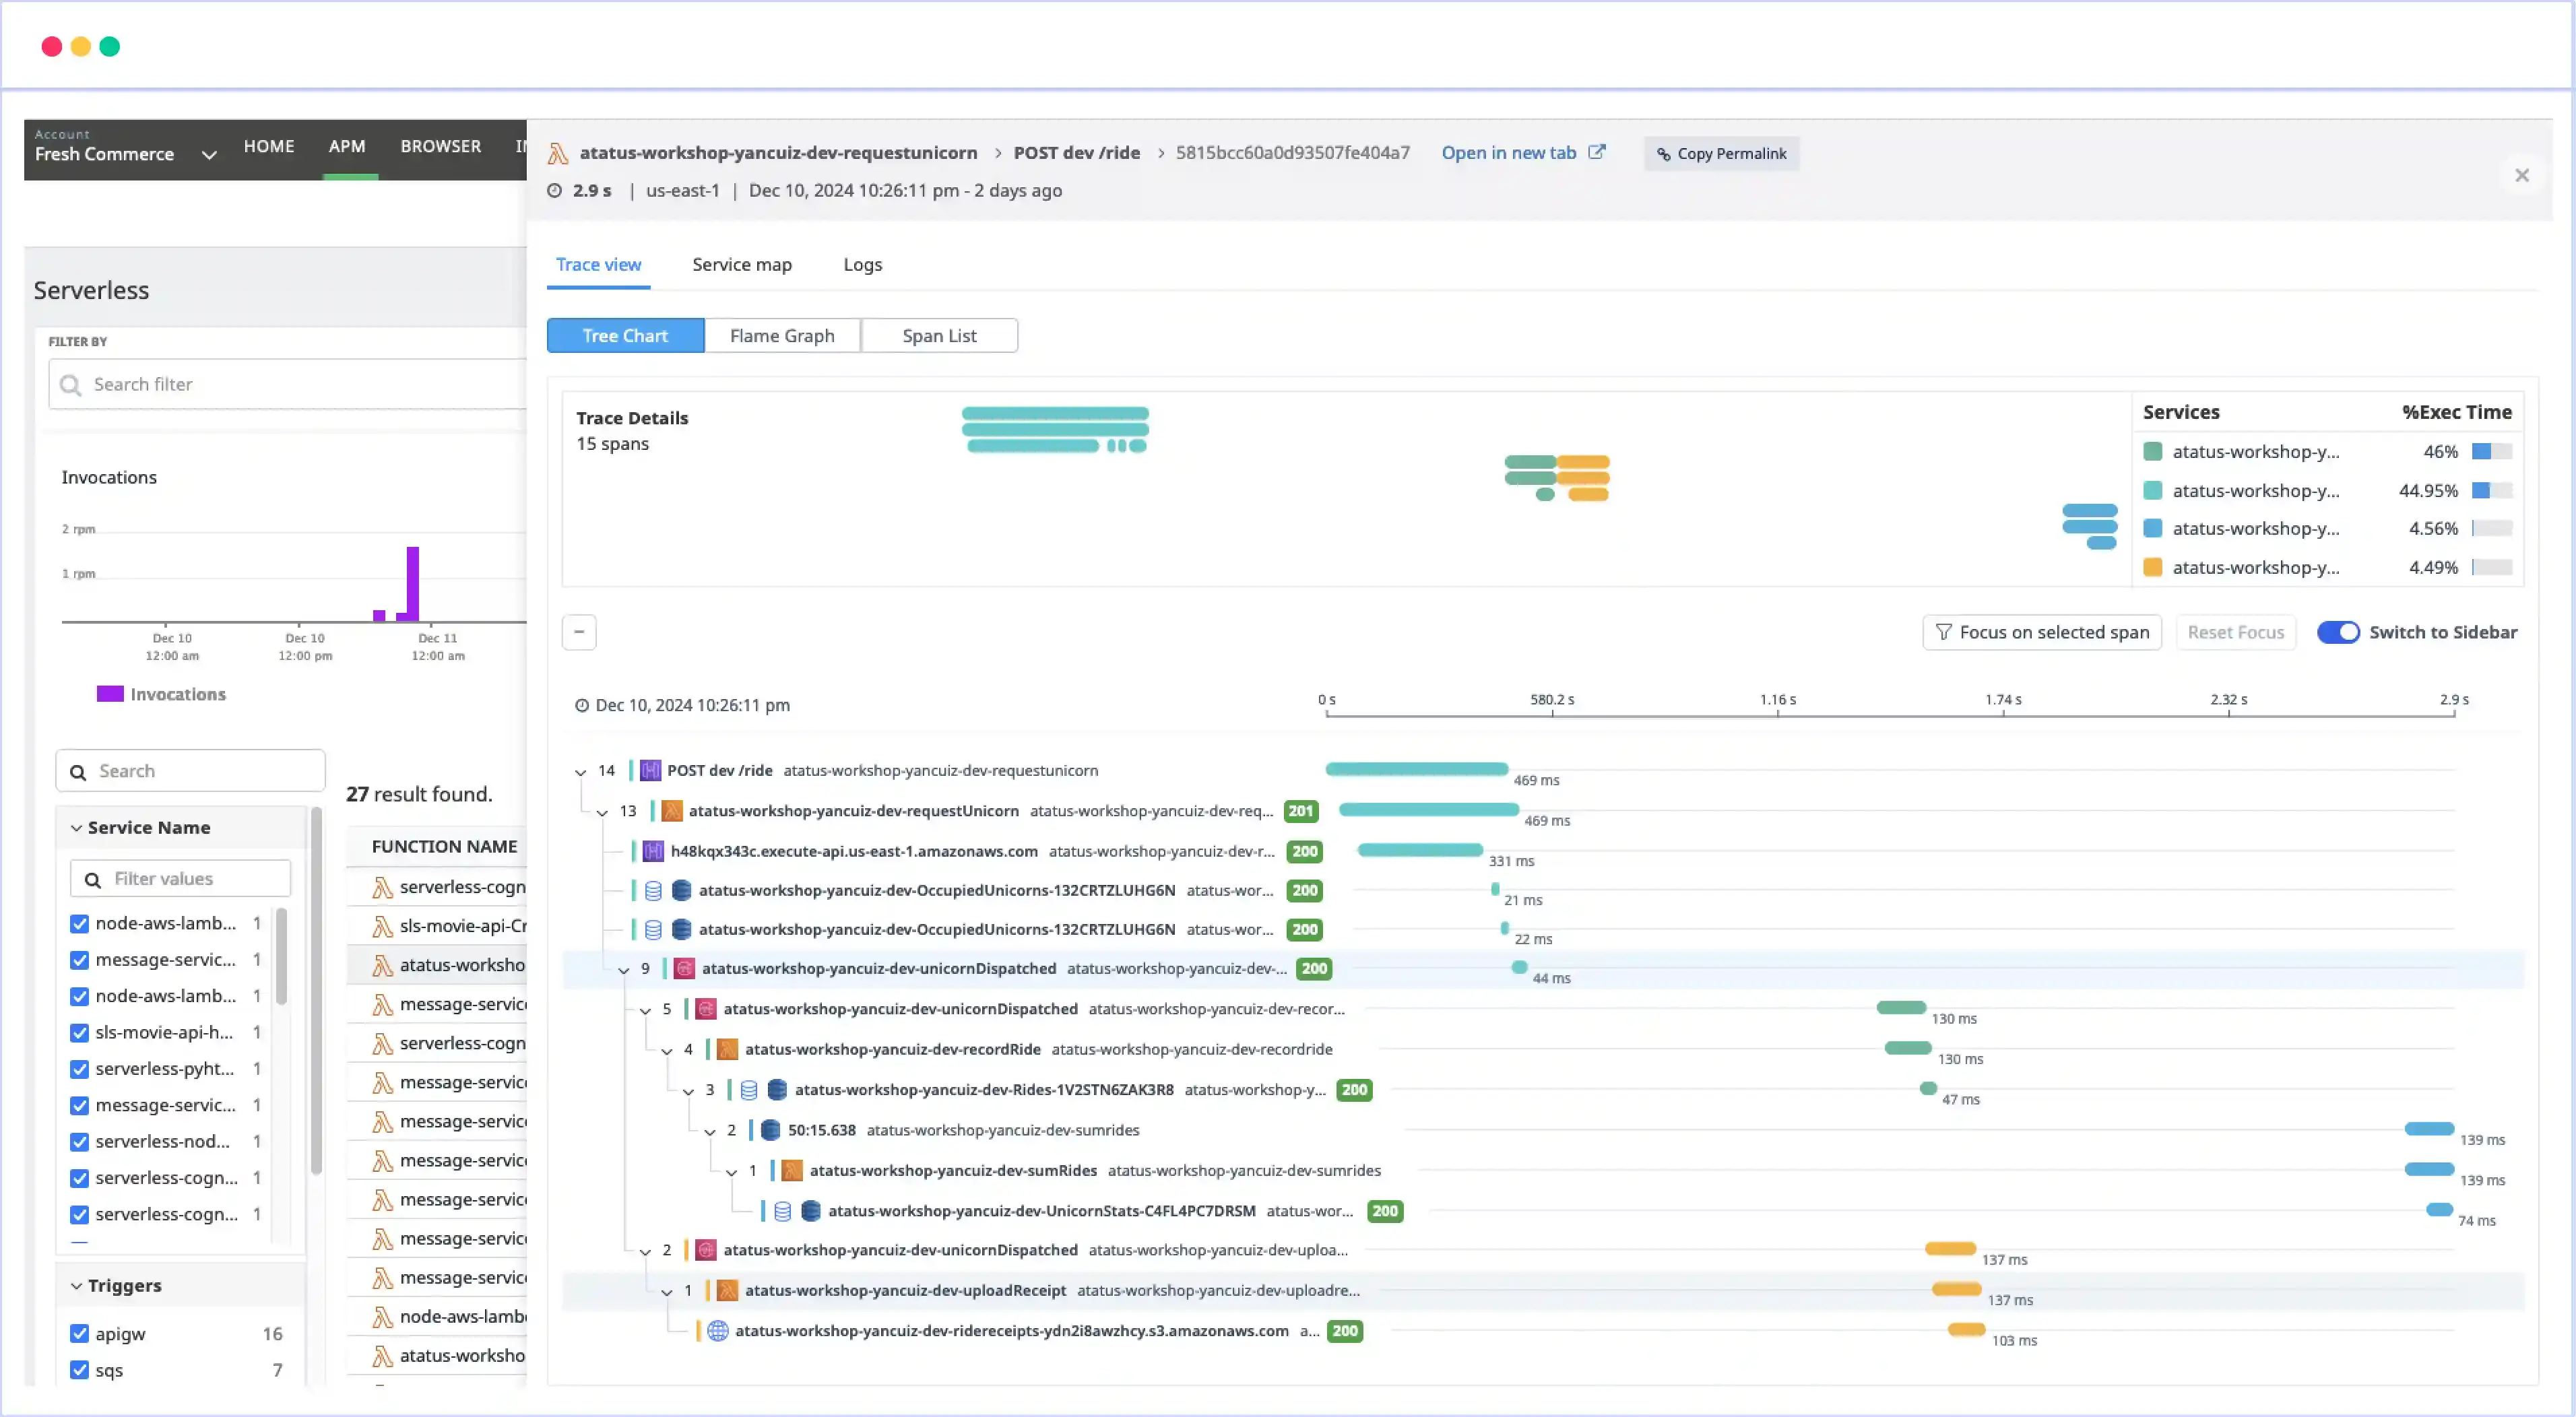
You can now see how your AWS Lambda functions perform without stitching together separate tools, custom scripts and manual checks. Atatus Serverless Monitoring tracks invocation count, execution duration and error rates for each Lambda function.
Your functions appear next to the rest of your application stack in Atatus, so you can follow a problem from an API call into the function behind it and on to the services it calls.
What you can do
- See function performance: Track invocation count, duration and error rates for every Lambda function.
- Right-size and control costs: Monitor memory usage so you can allocate the right amount to each function and keep serverless costs in check.
- Get alerted: Set alerts on predefined thresholds or custom conditions so you hear about slow or failing functions.
- Monitor alongside your stack: Watch Lambda functions next to your other services and resources, with traces that connect them.
- Grow without changing tools: Monitor a few functions or many from the same place as your application scales.