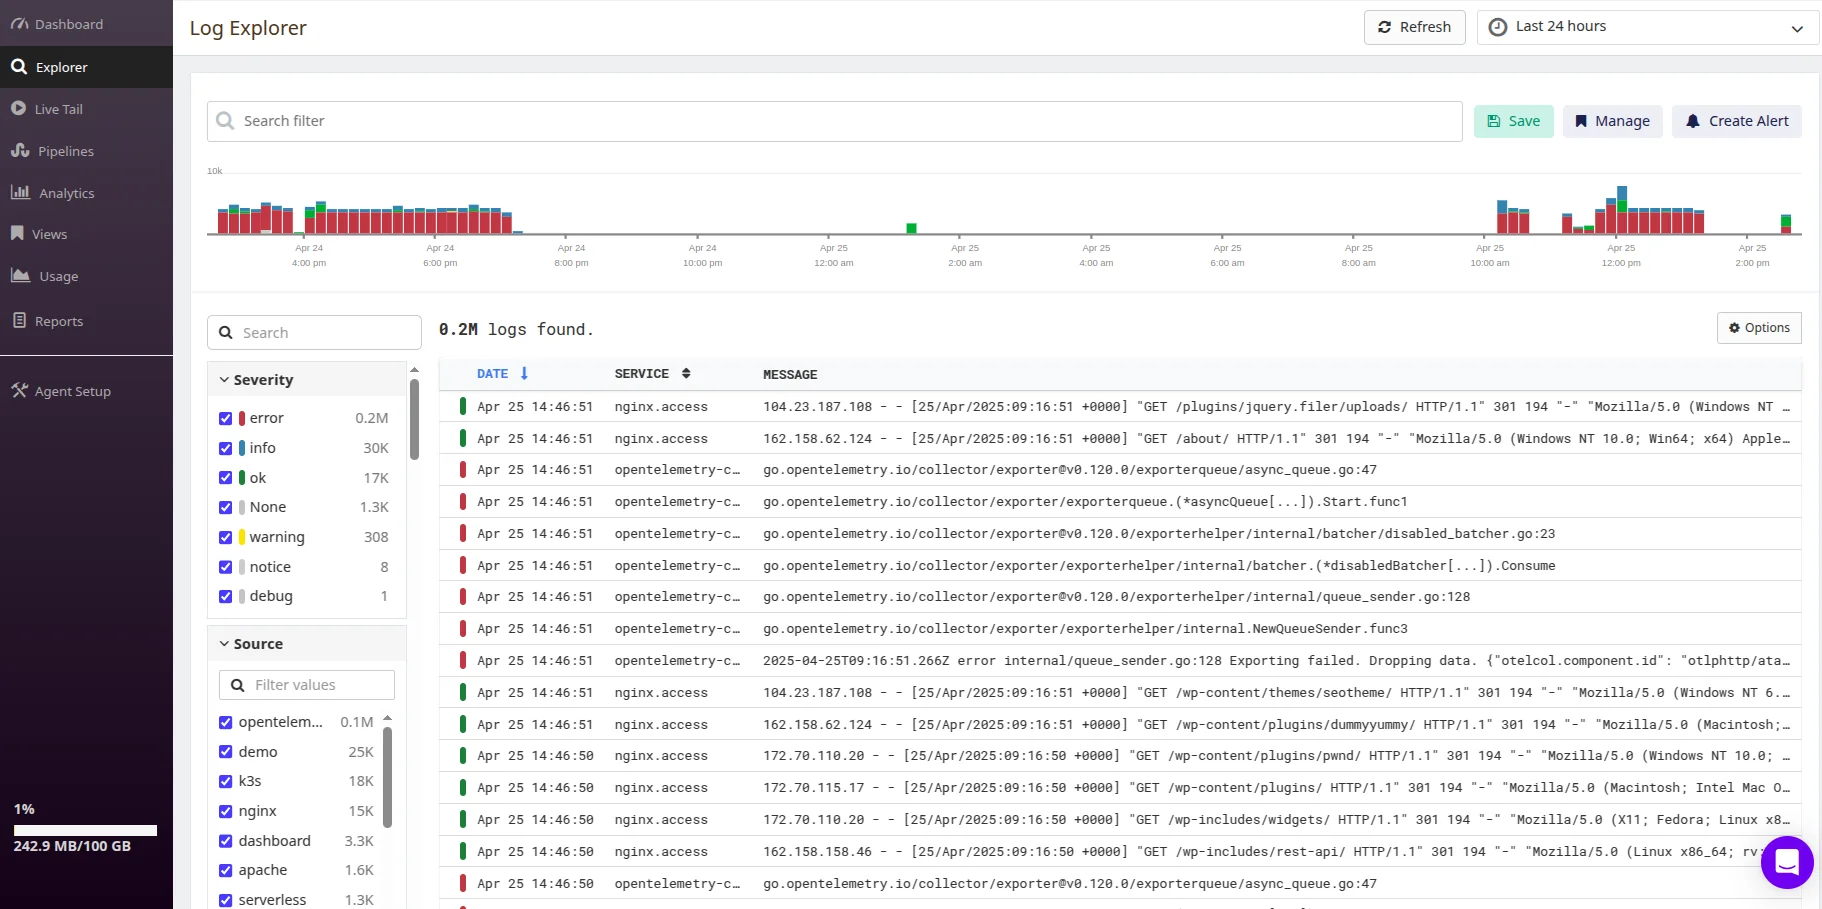
You can now see the logs and metrics from your AWS Lambda functions next to their traces. Add the Atatus Lambda Extension as a layer beside the Atatus agent layer, and it collects data from each function and sends it to Atatus Serverless Monitoring.
Traces already came from the Node.js and Python agent layers. With metrics, logs and traces for each function in one place, you can work out why an invocation was slow or failed without piecing the story together from separate tools. Setup steps for the Serverless Framework and AWS SAM are in the Lambda Extension docs.
What the extension adds
- Simple setup: Add the extension layer next to the Atatus agent layer and set
ATATUS_EXTENSION_ENABLEDto true. It works with the Serverless Framework and AWS SAM templates. - Function and extension logs: Set
ATATUS_EXTENSION_SEND_FUNCTION_LOGSto send your function logs to Atatus, andATATUS_EXTENSION_SEND_EXTENSION_LOGSto send the extension's own logs. - Metrics with every trace: See execution duration, invocation counts and error rates for each function alongside its traces.
- Data sent in bulk: The extension aggregates what it collects and sends it to Atatus in bulk.
- Alerts: Set alerts on thresholds or custom conditions so you hear about slow or failing functions early.