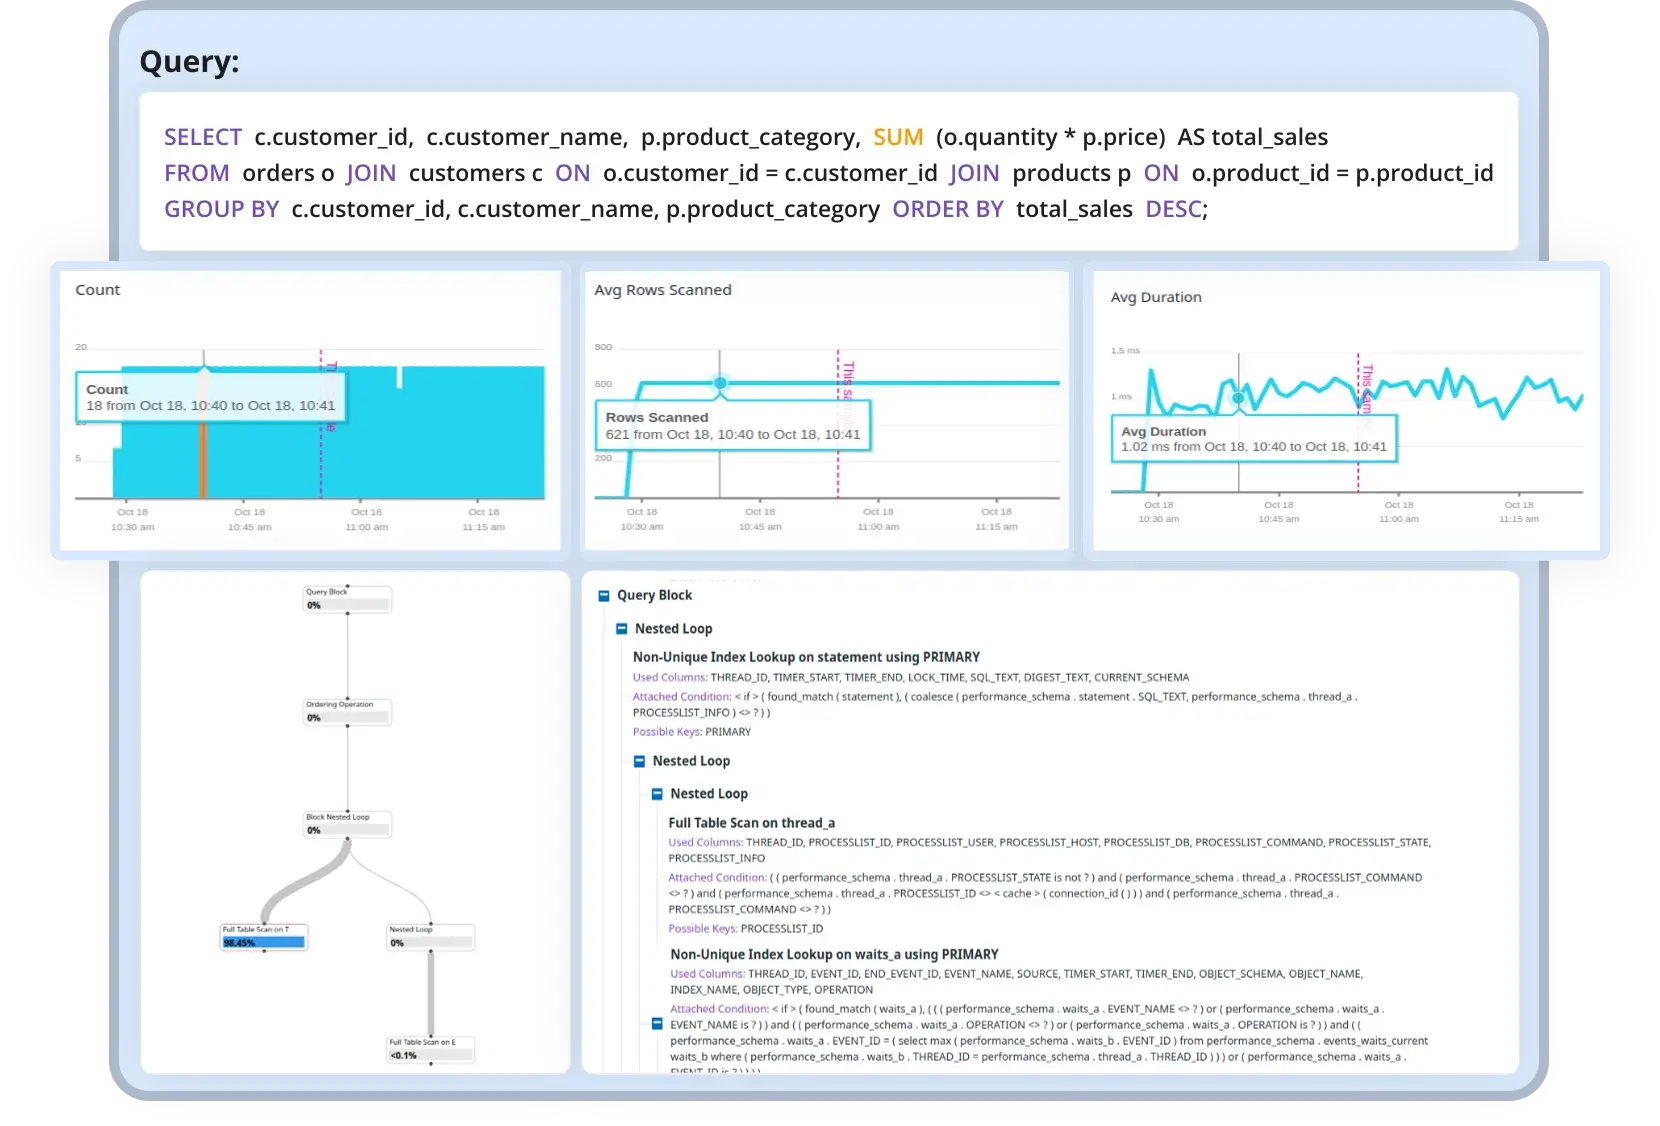
You can now see the database side of every slowdown in Atatus, next to the application data you already collect. Atatus Database Monitoring is generally available and tracks query execution times, resource consumption and connection issues for your databases.
The Atatus Infrastructure Agent connects to each database as a read-only user and reads the query statistics the database already keeps, so nothing runs inside your application.
What you can do
- See application and database together: Database metrics sit next to your application performance data, so you can tell whether a slow request comes from the code or the query.
- Find slow queries: See how long your queries take and which ones slow down the most, then optimize them for faster responses.
- Track resource consumption: Watch database resource usage to spot when load, not a single query, is behind a slowdown.
- Catch connection issues: Spot connection problems early, before they turn into errors in your application.
- Resolve issues faster: Live query and resource data helps you find and fix database bottlenecks before they cause downtime.