If your APIs run behind Kong Gateway, you can now capture every request at the gateway and analyze it in Atatus API Analytics, without adding an agent to each backend service. The new Atatus plugin for Kong logs your API traffic with request and response data, latency and errors for each call.
The plugin is a LuaRocks package. Install it, add atatus to the plugins list in kong.conf, enable it with your license key and restart Kong. Requests then appear in Atatus with their endpoint, status, duration and caller. See the Kong API analytics page for details.
What you get
- Traffic logging at the gateway: Log the API calls that pass through Kong, including REST, GraphQL and XML/SOAP traffic, with their headers and request and response bodies.
- Customer usage: Tie each request to a user and a company, read from Kong consumer headers or from a header or token field you choose, and see how each customer uses your APIs.
- Alerts on API traffic: Get alerted when throughput, response time or 4xx and 5xx counts for an endpoint cross the threshold you set, such as during a sudden traffic spike.
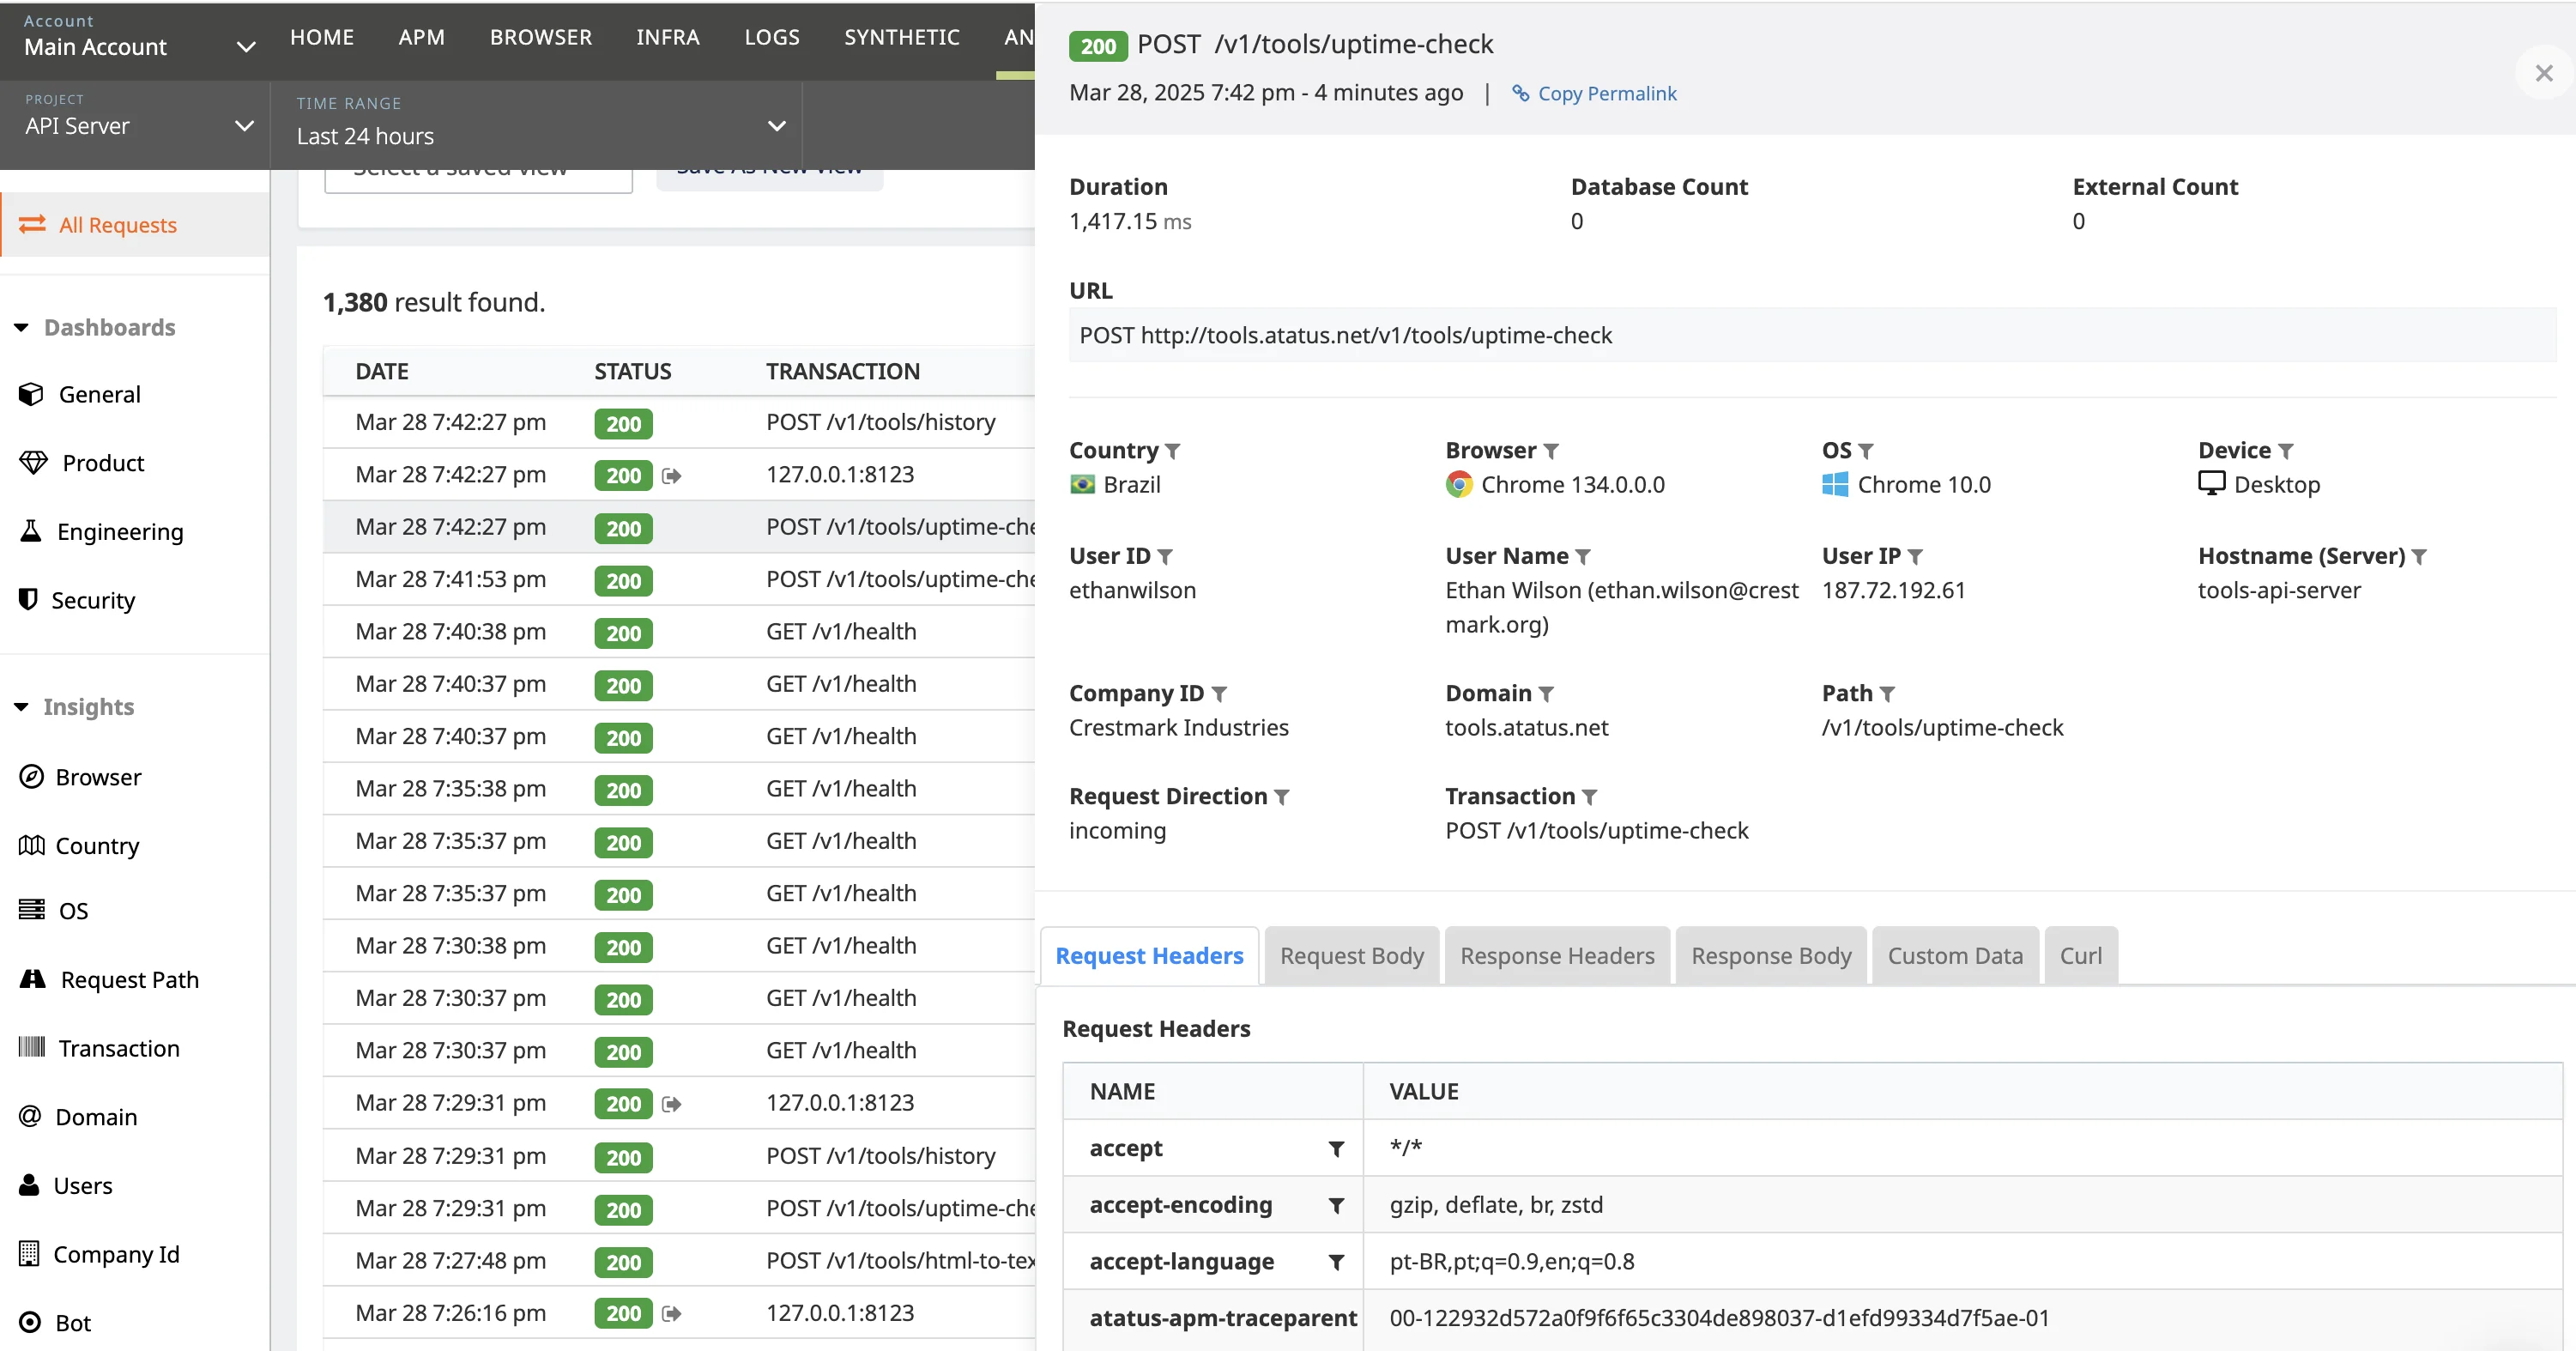
- Request detail: Open any call to see its headers, bodies, country, browser and the user and company that made it.
- Fits your Kong setup: The plugin is built for the open-source and Enterprise editions of Kong Gateway, including Kong AI Gateway, and for gateways run with Kong Ingress Controller or Kong Konnect.