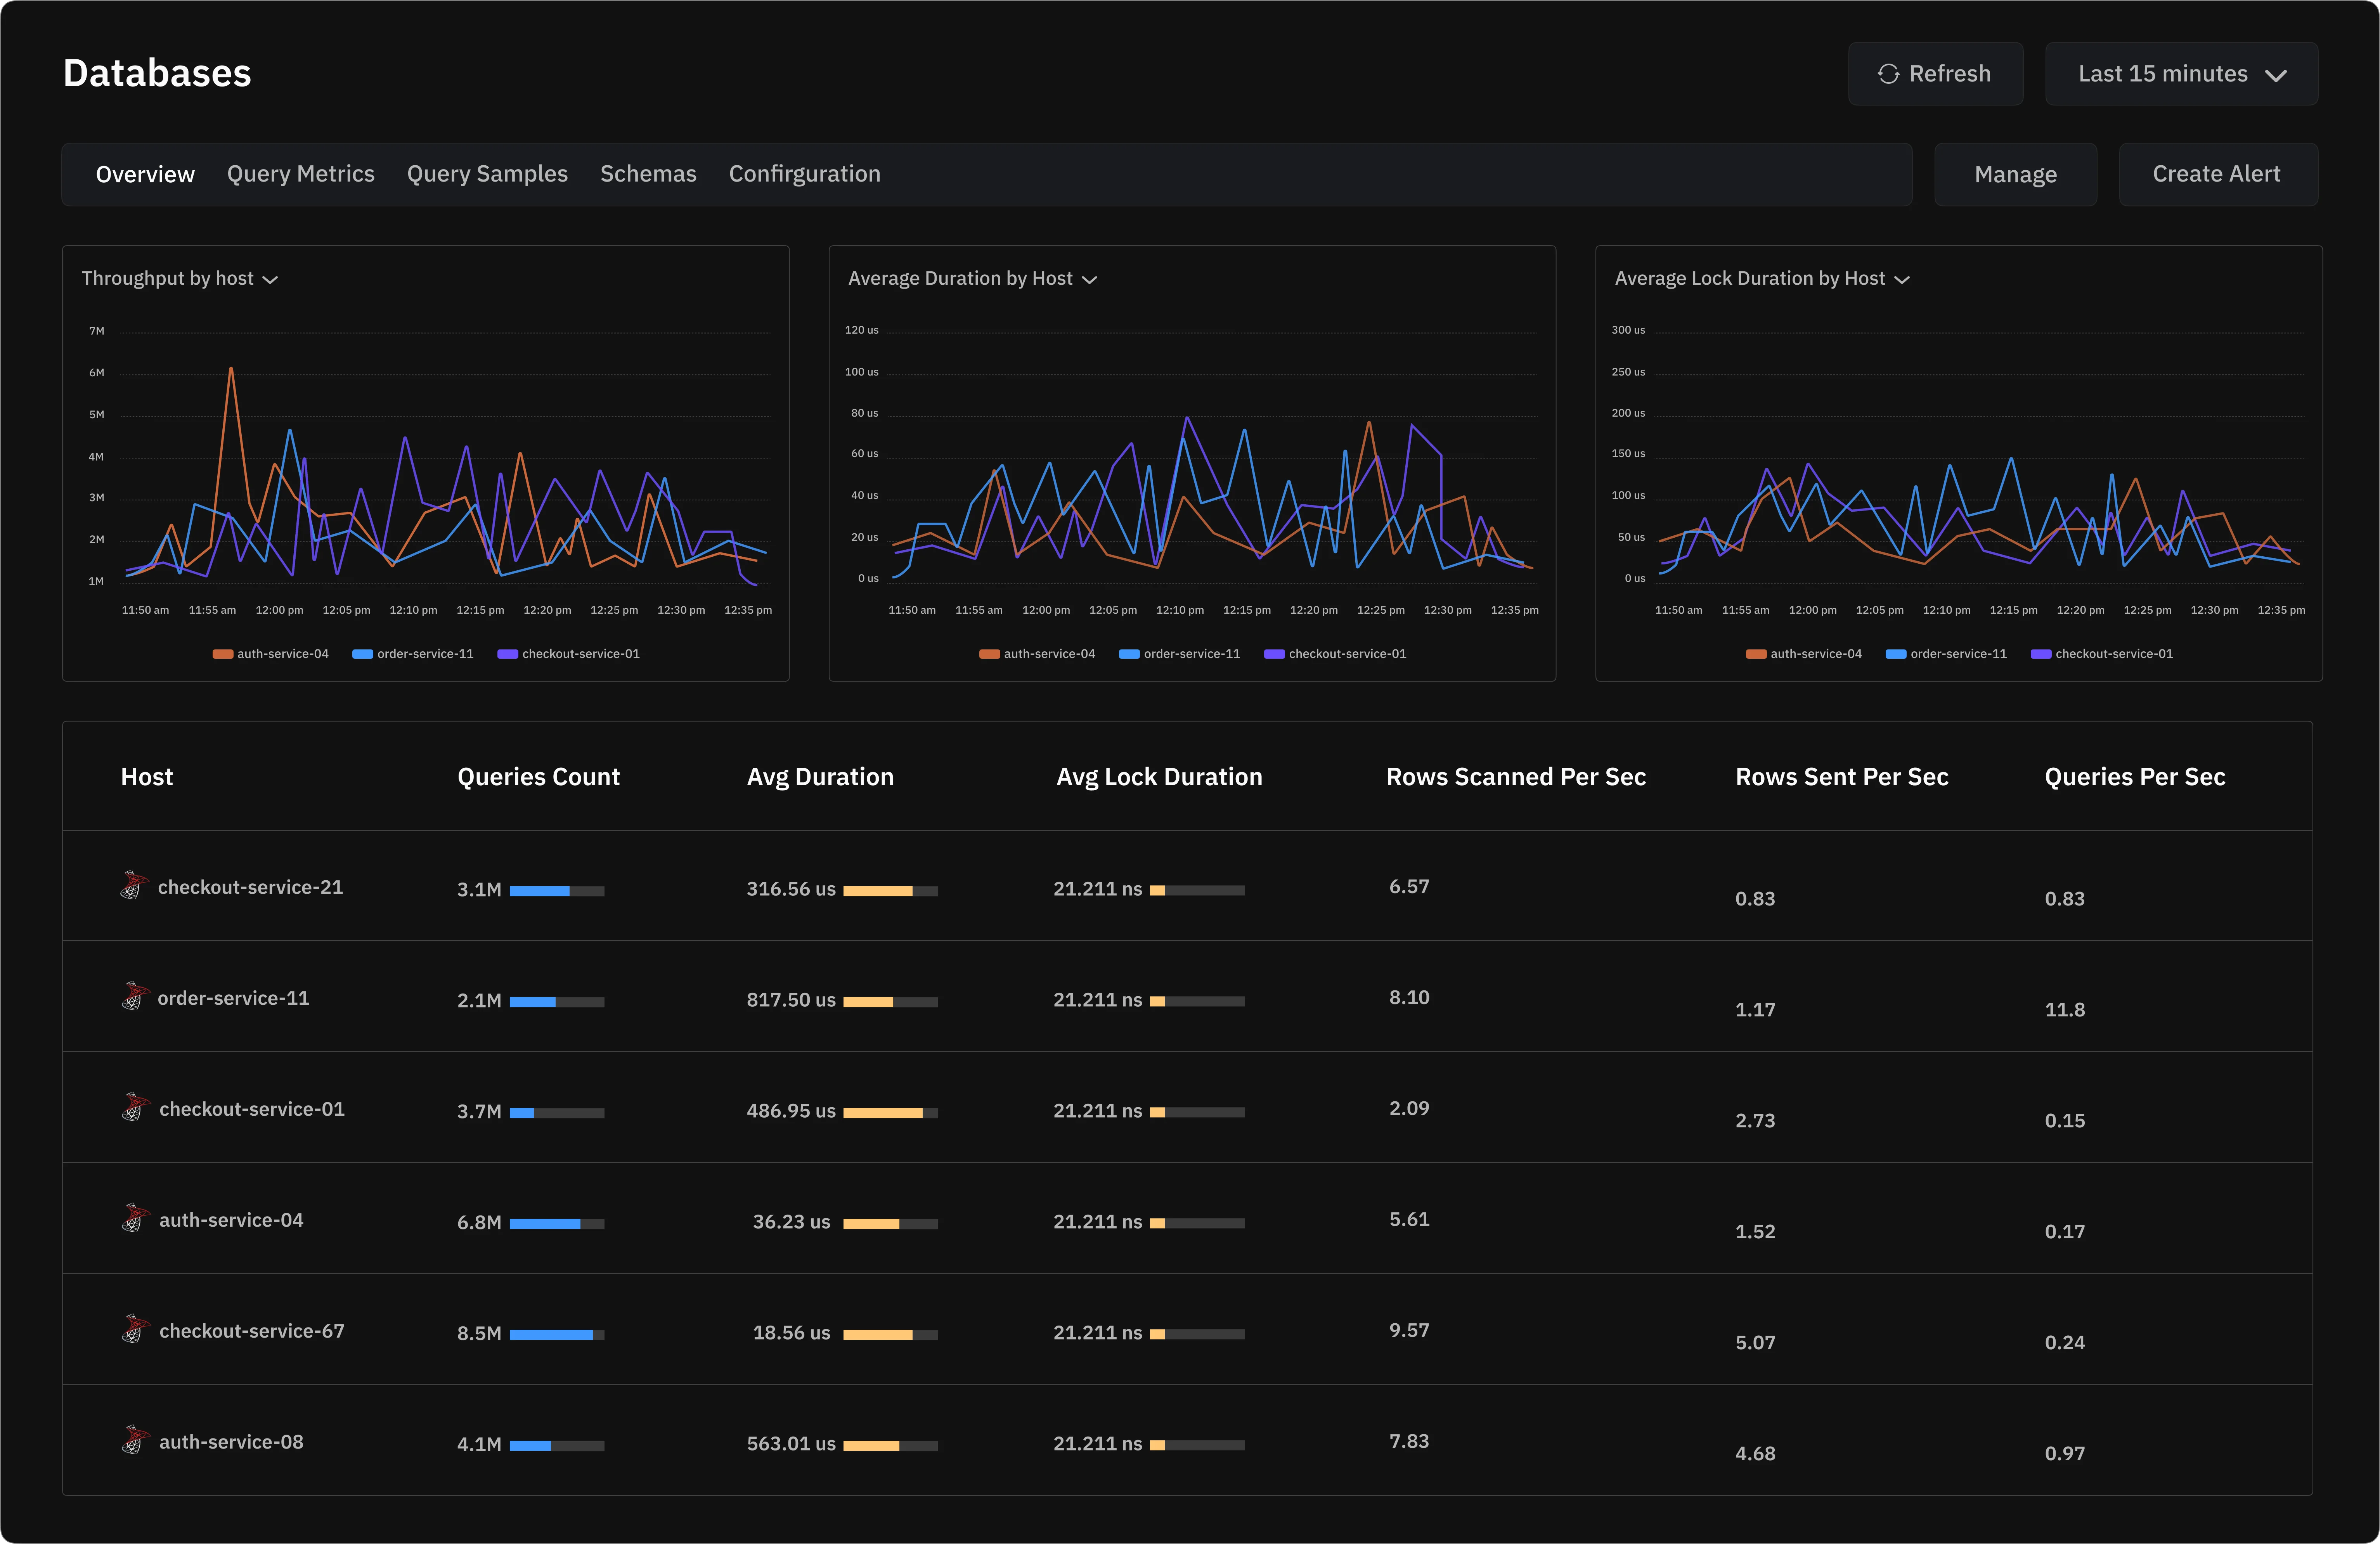
You can now find the SQL Server queries behind slow transactions and blocking, and see where the database spends its time. SQL Server monitoring in Atatus collects query metrics, query samples, execution plans and wait events through the Atatus Infrastructure Agent.
It supports SQL Server 2012 to 2022, self-hosted or on AWS RDS, Azure SQL Database, Azure SQL Managed Instance, Azure VMs and Google Cloud SQL. The agent connects with a read-only login, so engineering and operations teams can share one view of database health.
What you can do
- Slow queries: Rank normalized queries by count and average duration to see which ones to tune first.
- Execution plans: Read the plan for a query to find scans, costly joins and other expensive steps.
- Wait events and blocking: See what queries are waiting on, including lock waits, to understand blocking.
- Database load: Track load over time to see when and where pressure builds.
- Schema and settings: Optionally collect schema information on SQL Server 2017 and later, plus configuration settings, to review next to query data.