You can now put data from across Atatus on a single dashboard and build it in a few steps. The new dashboards support metrics from APM, logs, traces, databases, browser monitoring, synthetics and more, with new chart types and a simpler query builder.
Pick a metric, choose how to show it and add it to the dashboard. When a dashboard is ready, export it as JSON to back it up, share it or reuse it elsewhere.
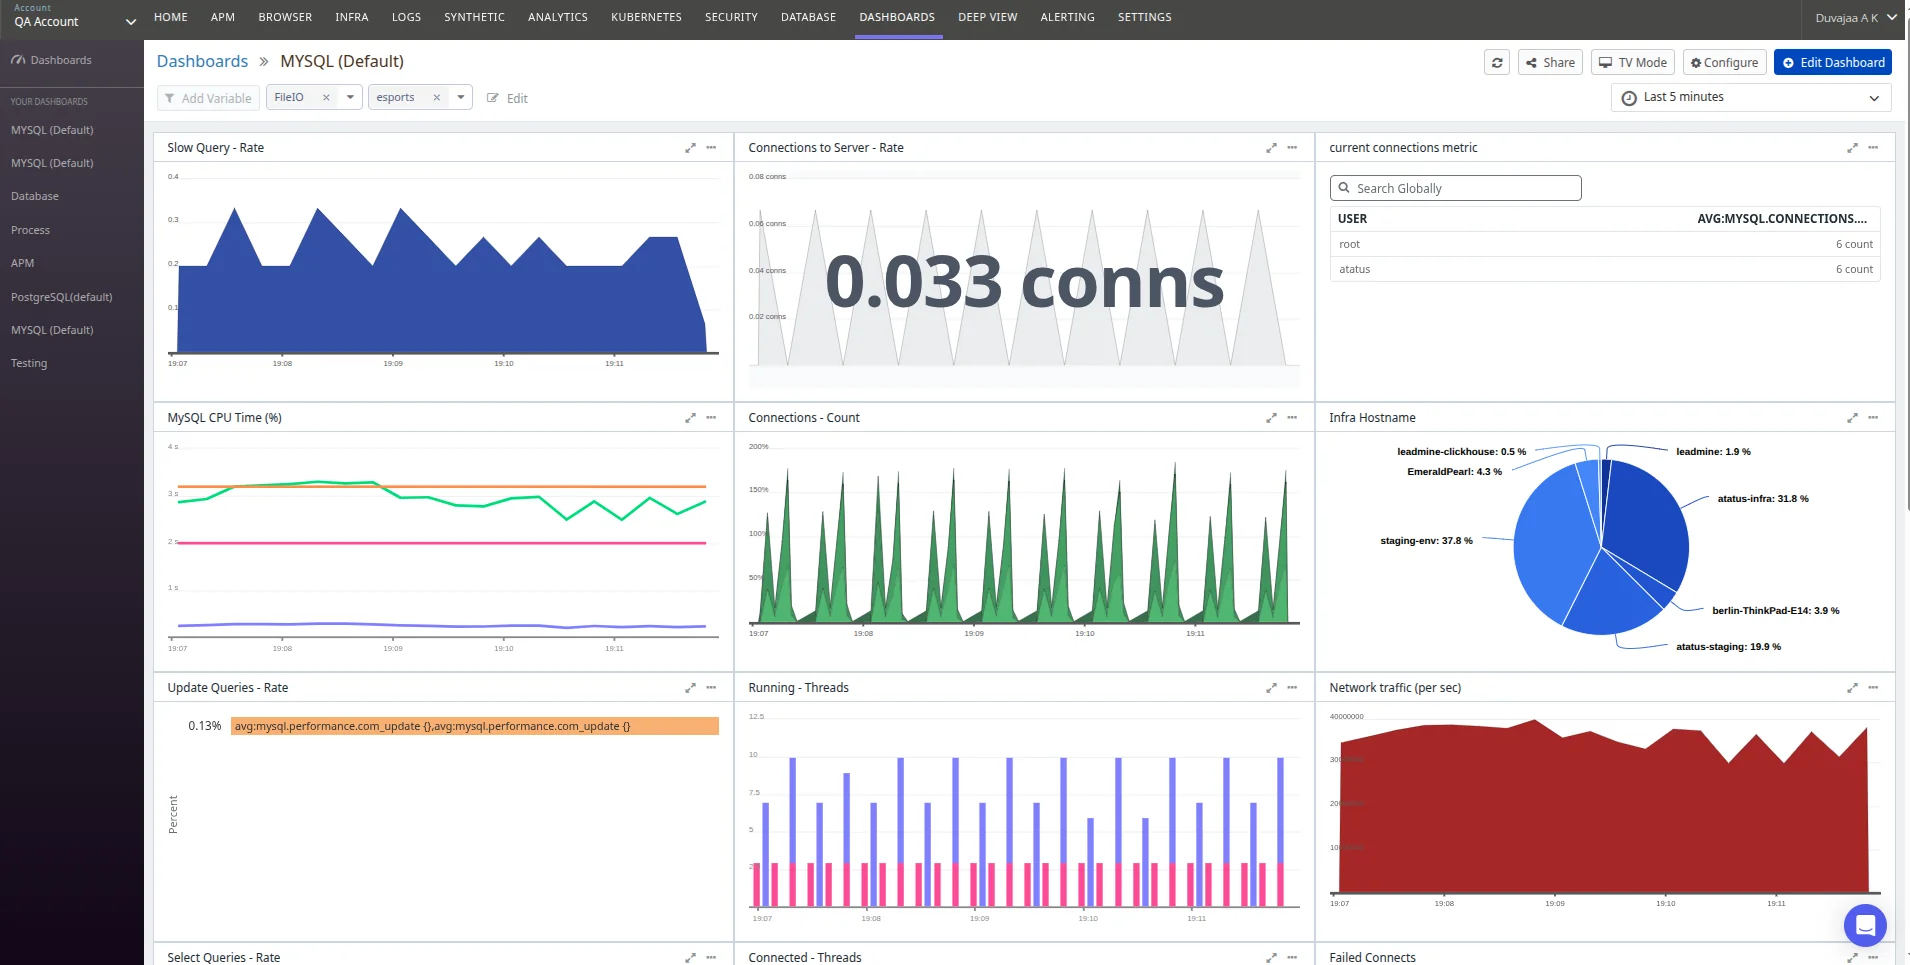
What you can do
- Every data source: Chart APM, logs, traces, database, browser, synthetics and infrastructure metrics side by side.
- Quick to build: Select a metric, pick a visualization and add the widget, with no complex setup.
- More ways to show data: Use Timeseries, Query Value, Query Table, Top List and Pie Chart widgets.
- Query builder: Filter, group, sort and apply functions to metrics in a cleaner query editor.
- Import and export: Save a dashboard as JSON, or import one from a file, to share it, back it up or reuse it.