You can now see how each Node.js function on AWS Lambda performs: every invocation with its duration, status and errors, which calls had a cold start, and a trace that follows the request into the services it calls. It is part of Atatus Serverless Monitoring.
Setup needs no code changes. Add the Atatus Node.js layer to your function, set your license key and set AWS_LAMBDA_EXEC_WRAPPER to /opt/atatus_wrapper. It also works with the Serverless Framework.
What you can see
- Every invocation: Each invocation shows its timestamp, duration, trigger and status. Filter by duration to find the slow ones.
- Error tracking: Errors in your functions are captured with their stack traces, so failed invocations stand out.
- Cold starts: See which invocations paid for a cold start, so you can tell slow code from slow starts.
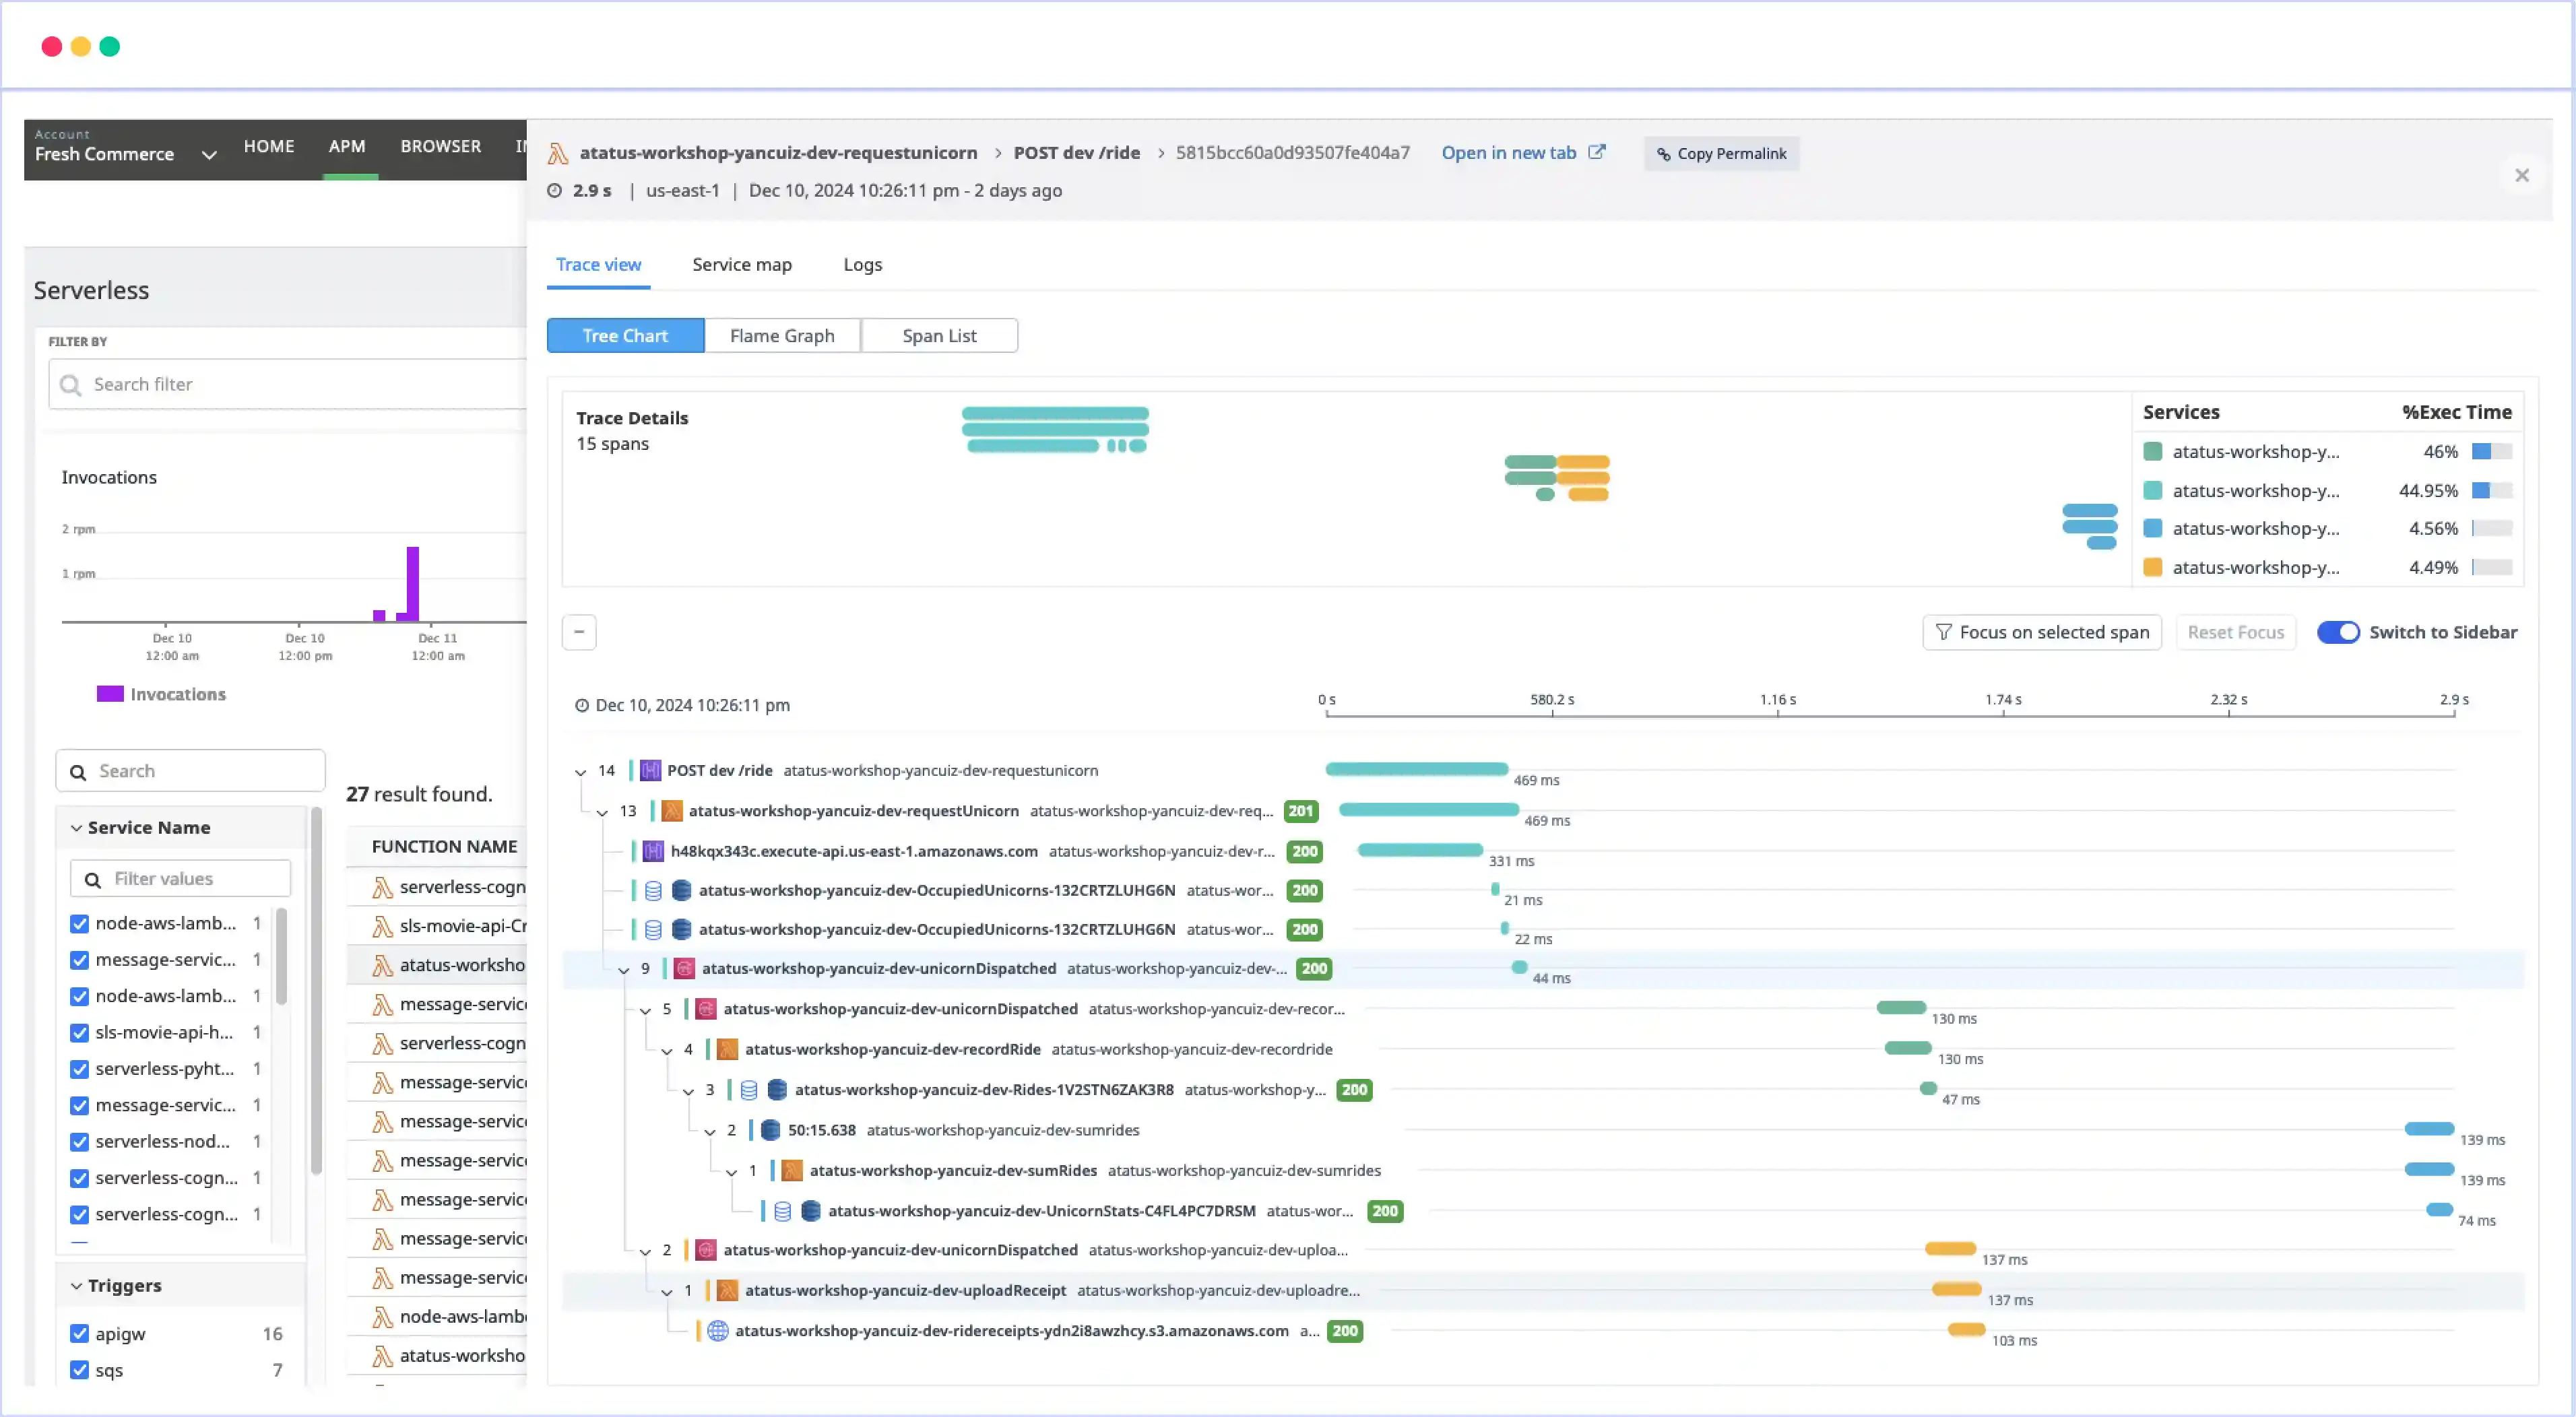
- Distributed traces: Follow a request from your API into the function and on to the queues, databases and services it calls.
- Trends over time: Track invocations, average and P75, P90 and P95 latency, and errors for each function.