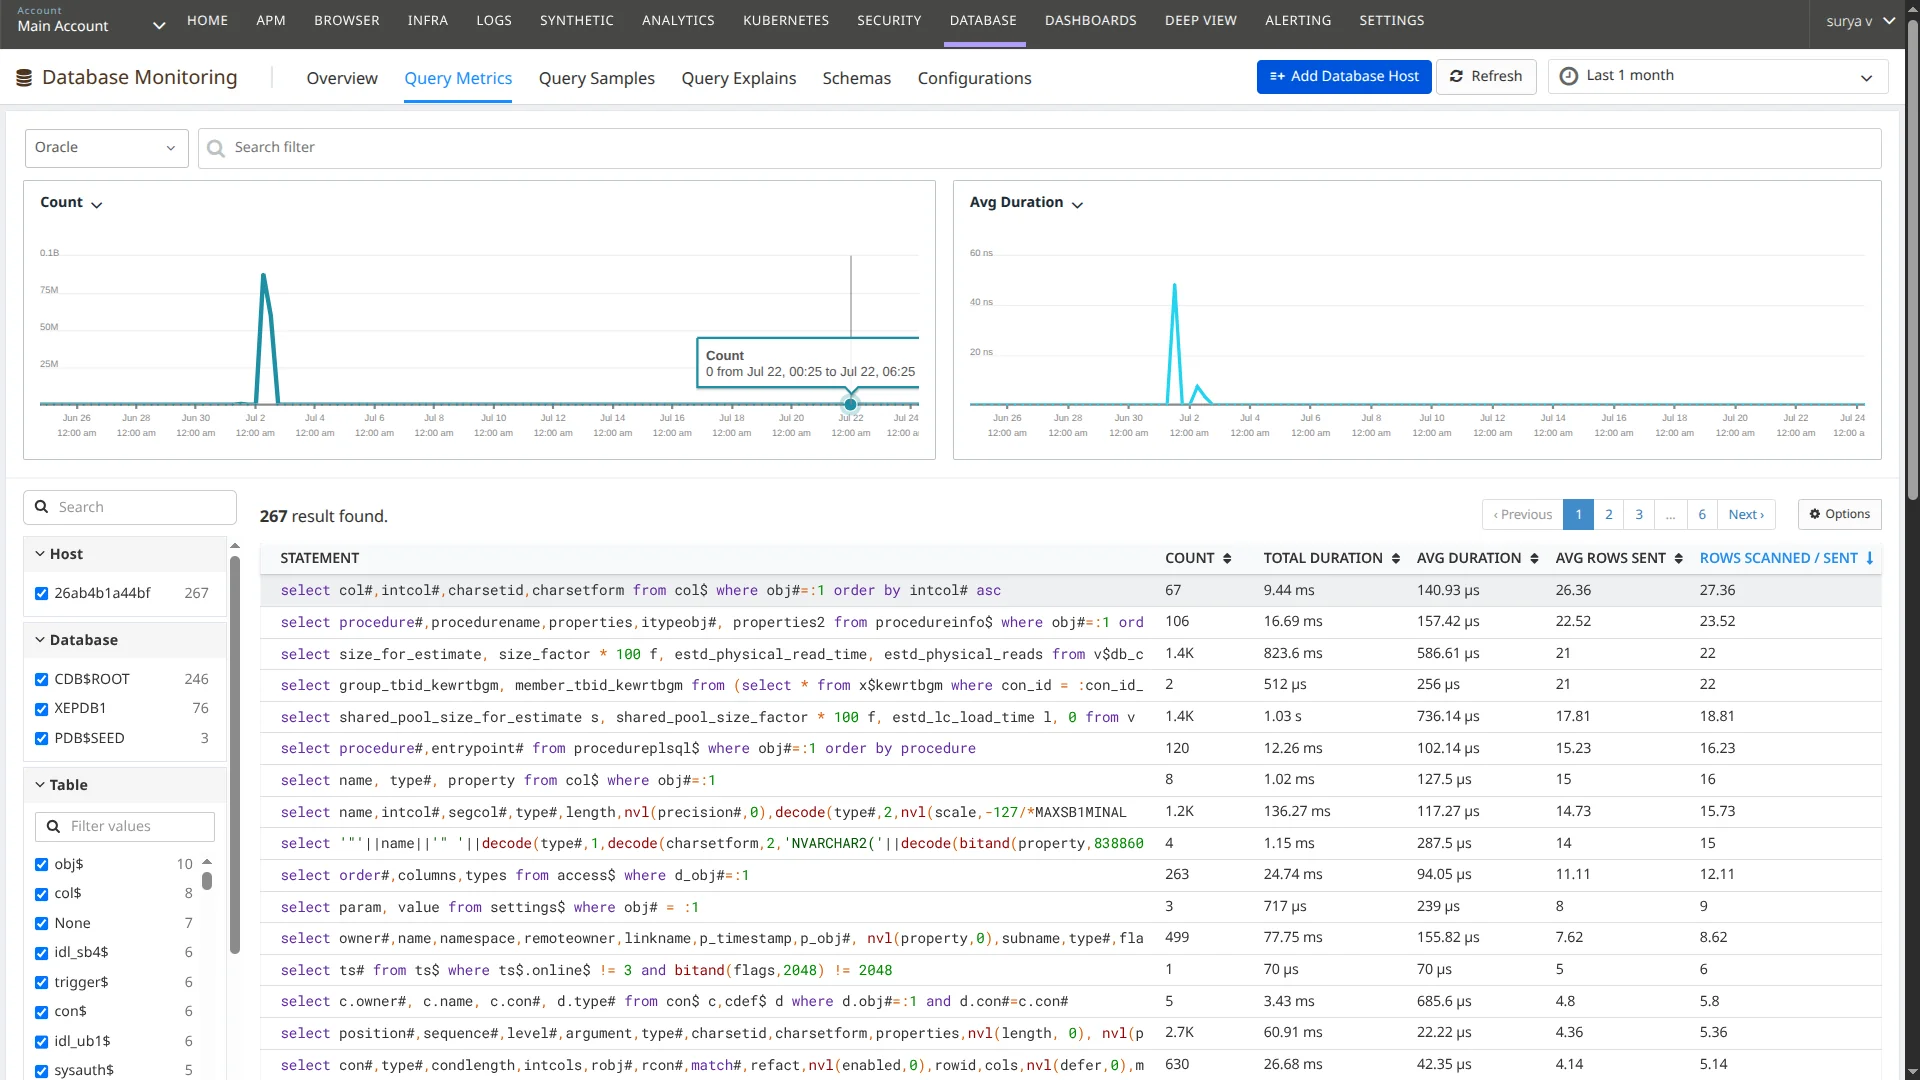
You can now find the Oracle queries that slow your application down and see why they are slow. Oracle Database Monitoring collects query metrics, query samples and explain plans, along with schema and configuration details, through the Atatus Infrastructure Agent.
The agent logs in as a read-only Oracle user and supports Oracle 11g to 21c, self-hosted or on AWS RDS. Developers, DBAs and SREs get a shared view of the database during incidents and tuning work.
What you can do
- Slow SQL, ranked: See the queries using the most CPU time, elapsed time and logical reads, and how they trend over time.
- Explain plans: Read how Oracle ran a statement to spot full table scans, costly joins and other plan problems.
- Wait events and sessions: Group waits by class to tell I/O, CPU and locking problems apart, and see which sessions are waiting.
- Query samples: Filter queries by schema, module or user to narrow down what is causing a slowdown.
- Schema and configuration: Check database structure and settings next to query data while you tune.