You can now watch your PostgreSQL databases in Atatus and catch slow queries, connection build-ups and resource pressure before they slow down your application. PostgreSQL monitoring tracks query performance, active connections, cache hits, index usage and resource use in one place.
The Atatus Infrastructure Agent collects these metrics by connecting to PostgreSQL as a read-only user, so nothing runs inside your application.
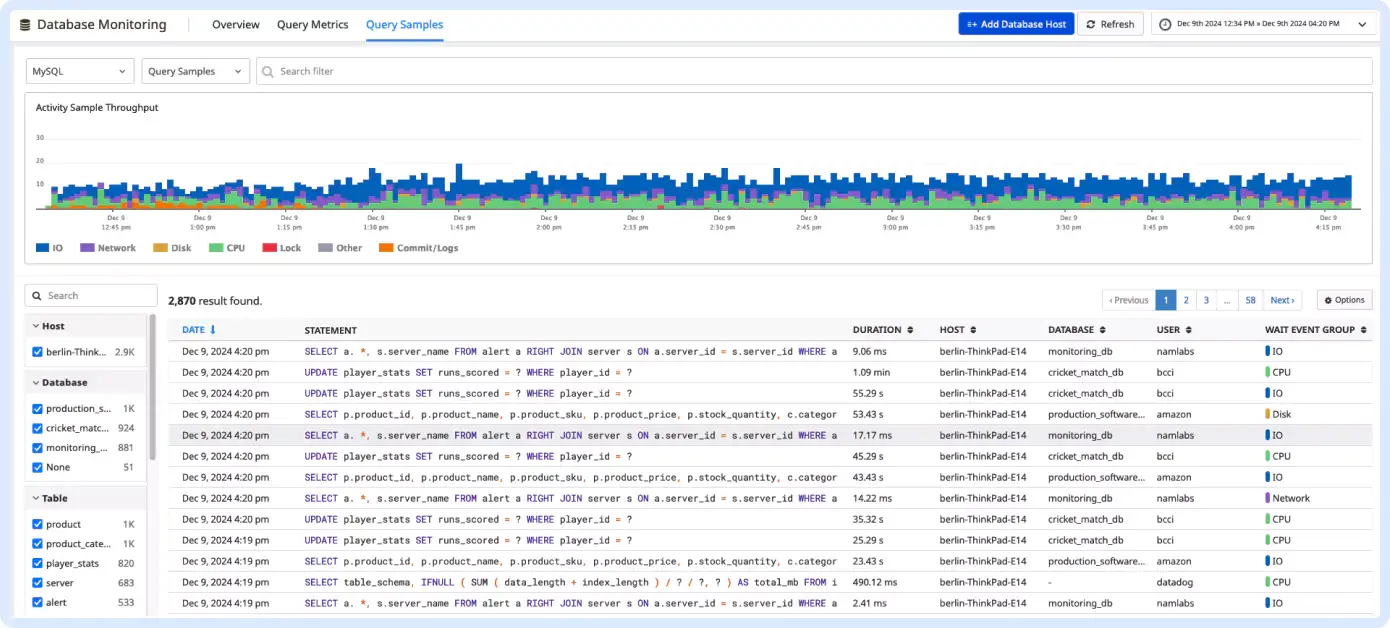
What you can do
- Optimize slow queries: See query execution times and find the resource-heavy queries worth tuning.
- Watch connections: Track active connections so you notice a build-up before the database runs out of room.
- Check index and cache efficiency: Monitor index usage and cache hits to find queries that read more data than they need.
- Track resource use: Follow CPU, memory, disk I/O and connections next to database activity to find the cause of a slowdown faster.
- Get alerted early: Set alerts for anomalies, resource usage or downtime so you can act before users notice.