You can now bring the metrics your services already expose in Prometheus or StatsD format into Atatus, and chart and alert on them next to your traces and logs, without replacing your exporters. The Atatus Infrastructure Agent scrapes Prometheus endpoints and accepts StatsD metrics, and stores both as custom metrics.
Teams that already instrument with Prometheus client libraries, exporters or StatsD keep that instrumentation and get one place to view and alert on it. Both integrations are bundled with the agent on Linux and Windows.
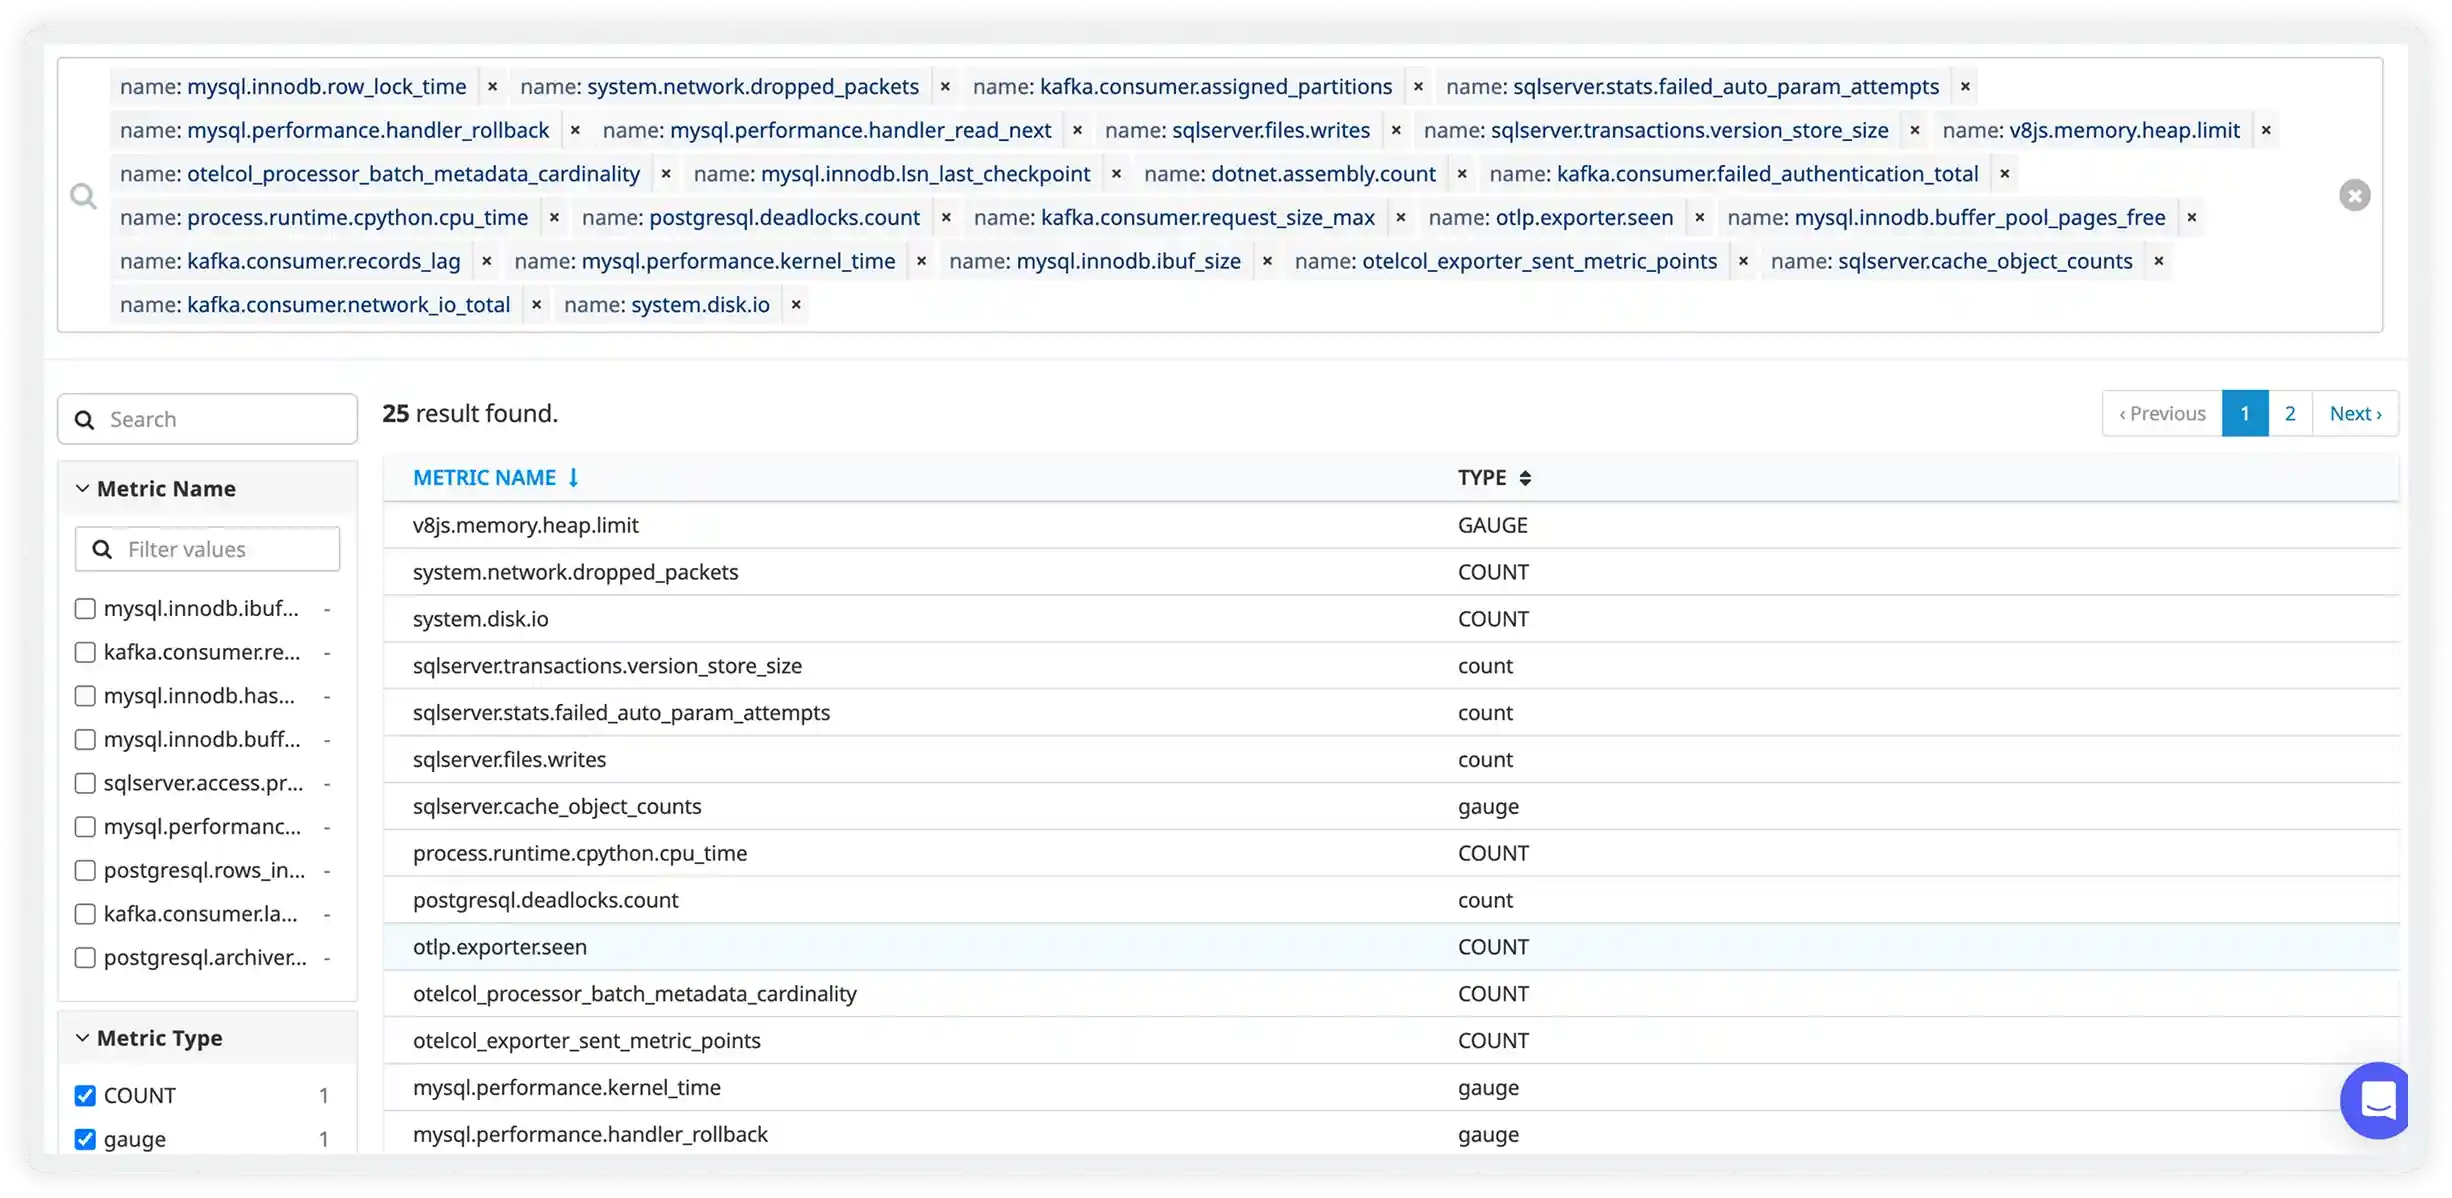
What you can do
- Scrape existing endpoints: Point the agent at any Prometheus-format endpoint, such as your app's /metrics, an exporter or the RabbitMQ Prometheus plugin.
- Keep only what you need: Include and exclude metrics by name pattern, and add a namespace prefix so metrics from different services stay apart.
- Many endpoints, one agent: Each entry in prometheus.yaml has its own hosts, path, namespace and filters.
- StatsD metrics: Send StatsD counters, gauges, timers, sets and histograms to the agent, and track how many metrics it receives by type.
- Chart and alert: Find metrics by name, filter them by tag, add them to dashboards and use them in alert rules like any other metric.