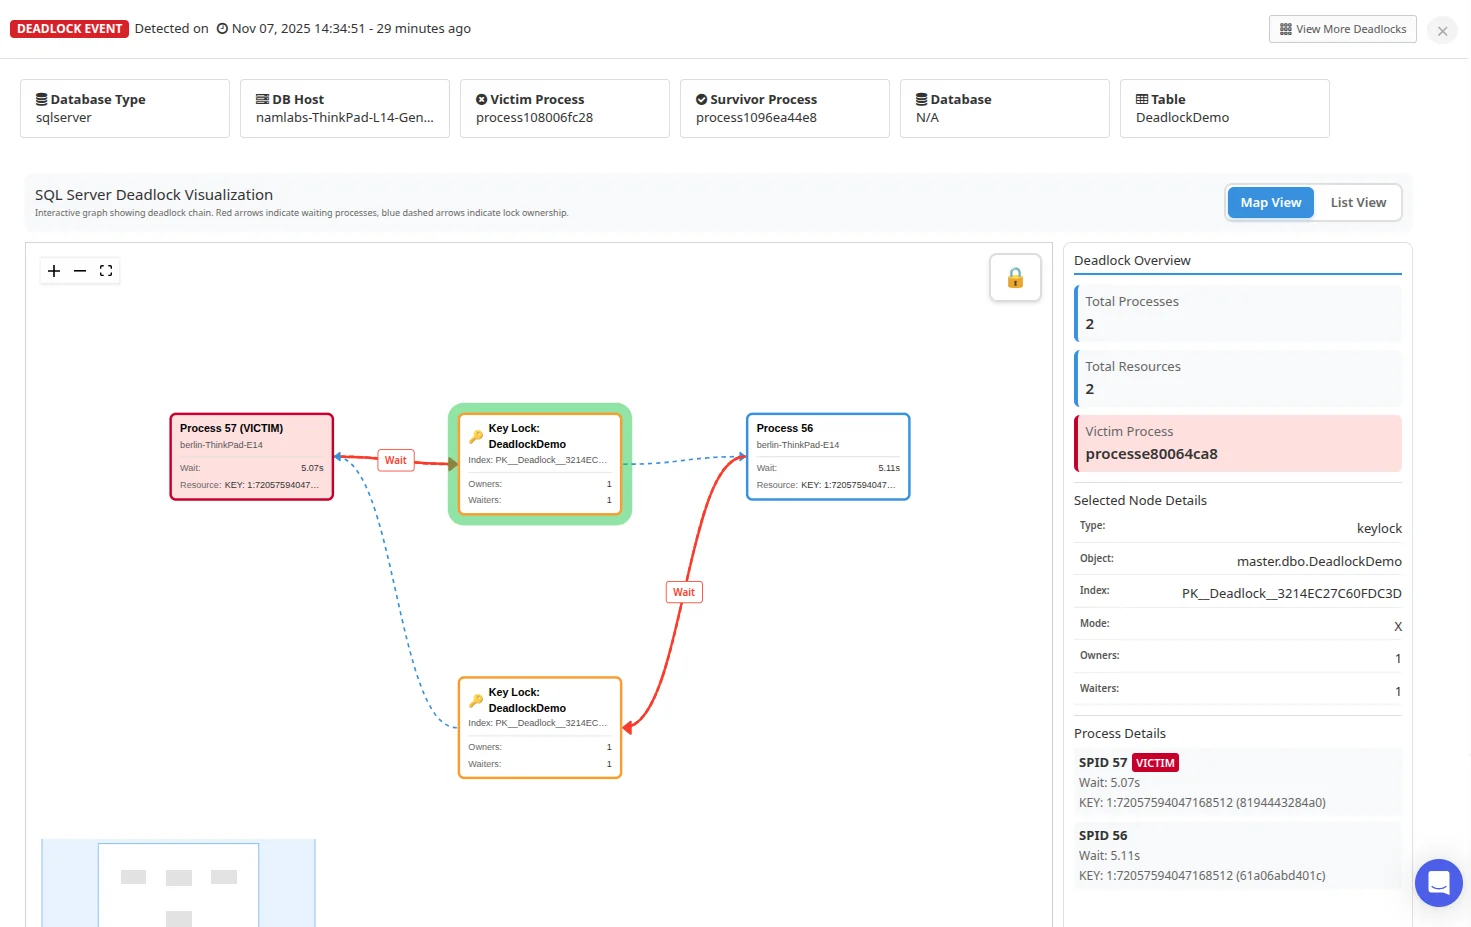
When two SQL Server transactions block each other and one is rolled back, you can now see exactly which queries and locks were involved. Atatus captures SQL Server deadlock events as part of SQL Server monitoring and shows the victim, the survivor and every lock they held or waited for.
Developers, DevOps engineers and DBAs can use this to find the queries and indexes behind recurring deadlocks and decide what to change, such as the order in which transactions touch tables, their isolation level or retry logic.
What you can do
- Deadlocks on record: Deadlock events are collected along with your other SQL Server data, so you can review them after they happen.
- Victim and survivor: See which process SQL Server chose as the victim and which one completed, with the query each was running.
- Map or list view: Read a deadlock as a graph of which process held which lock and which one waited, or as a list.
- Lock detail: See the lock mode, wait, isolation level, and the table and index each lock was on.
- Recurring patterns: Browse past deadlocks to see whether the same tables, indexes and queries keep showing up.