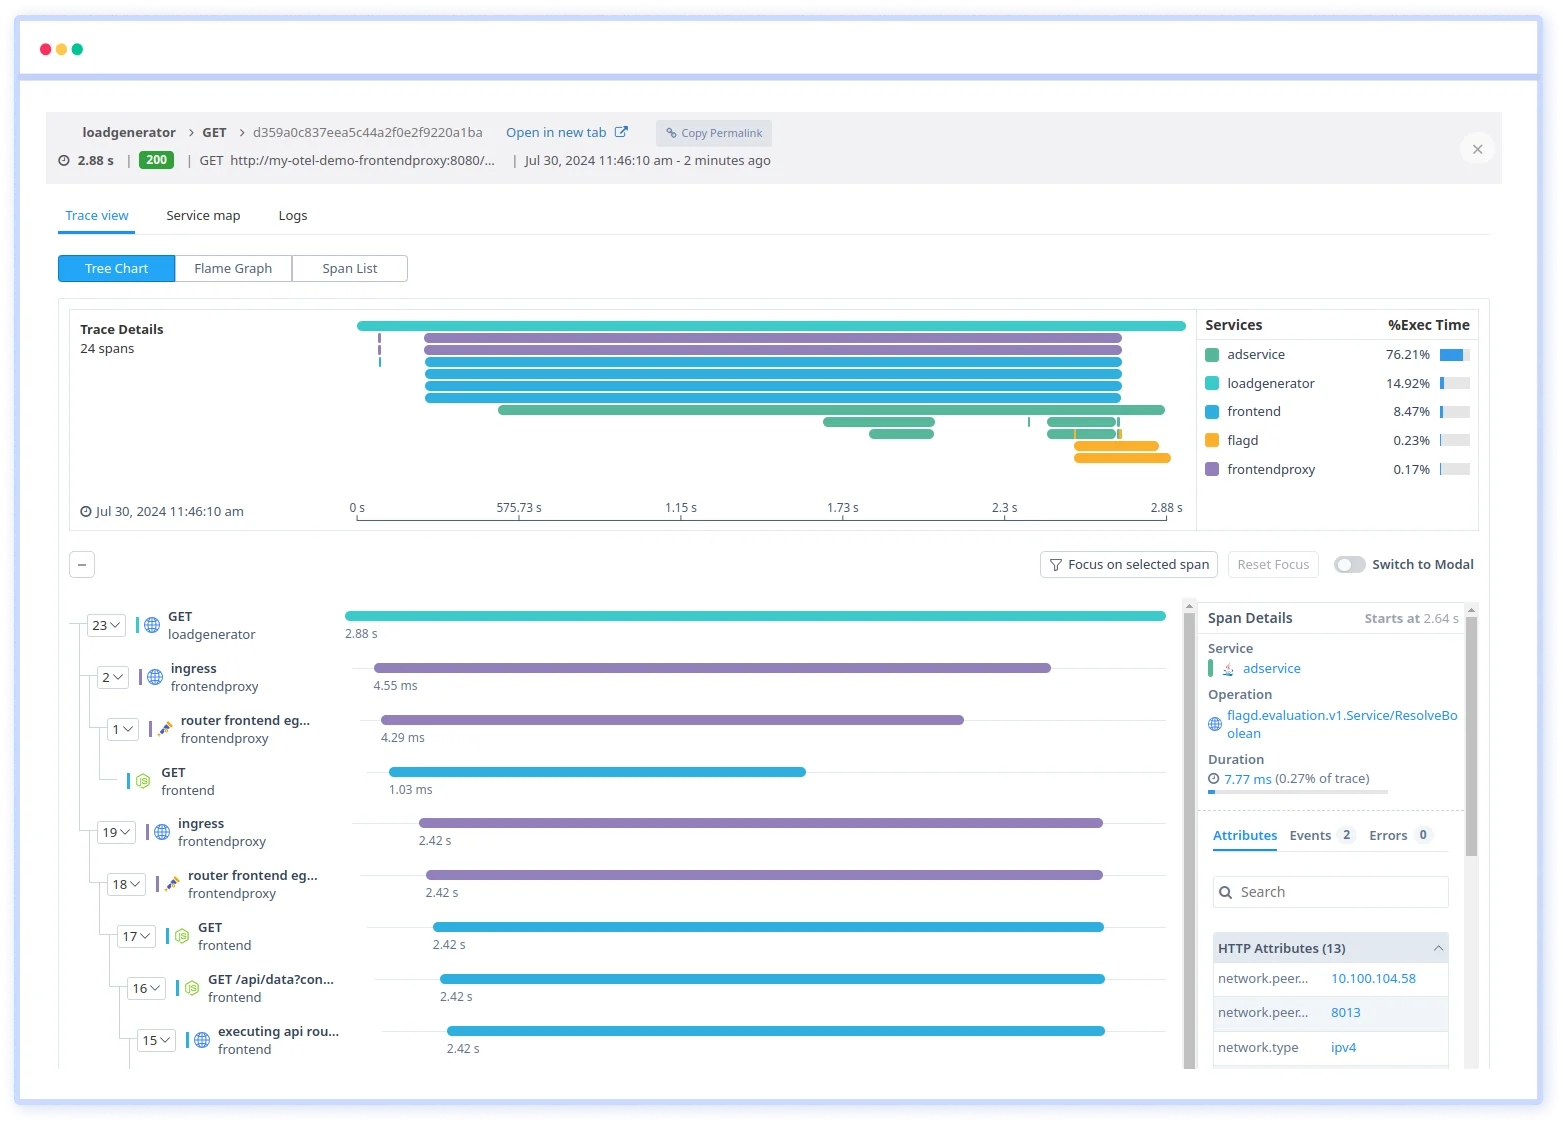
You can now follow a request through every Java service and component it touches, and see where time was spent or an error occurred. Distributed tracing in Atatus Java APM gives you end-to-end visibility into how each request is processed across microservices, cloud-native environments, containers and service meshes.
The agent works with popular Java frameworks and libraries and collects span duration, errors and tags automatically, so you can find bottlenecks and failing dependencies faster.
What you can do
- Trace end to end: Follow requests across microservices and components to see the full path of each transaction.
- Pick a trace view: Analyze a trace as a tree chart, a flame graph or a span list.
- See errors in context: Errors and exceptions are tracked inside traces, with stack traces and context.
- Track key metrics: Follow response times, error rates and throughput for your services.
- Control data volume: Configure sampling to manage data volume and focus on critical transactions.
- Filter with tags: Add custom tags and annotations to traces for better filtering and analysis.